Decoding BBB Tight Junctions: Structural Gatekeepers and Therapeutic Transport Mechanisms in CNS Drug Development
This comprehensive article examines the critical role of blood-brain barrier (BBB) tight junctions as structural and functional gatekeepers, with a focus on transport mechanisms relevant to CNS drug delivery.
Decoding BBB Tight Junctions: Structural Gatekeepers and Therapeutic Transport Mechanisms in CNS Drug Development
Abstract
This comprehensive article examines the critical role of blood-brain barrier (BBB) tight junctions as structural and functional gatekeepers, with a focus on transport mechanisms relevant to CNS drug delivery. Targeting researchers, scientists, and drug development professionals, it progresses from foundational molecular biology of claudins, occludins, and ZO proteins to advanced methodological approaches for modulating paracellular permeability. The article further addresses common experimental challenges in BBB modeling, compares validation techniques for transport studies, and synthesizes current strategies for optimizing therapeutic cargo passage. This review serves as a focused resource for navigating the complexities of BBB biology to advance neurologic therapeutics.
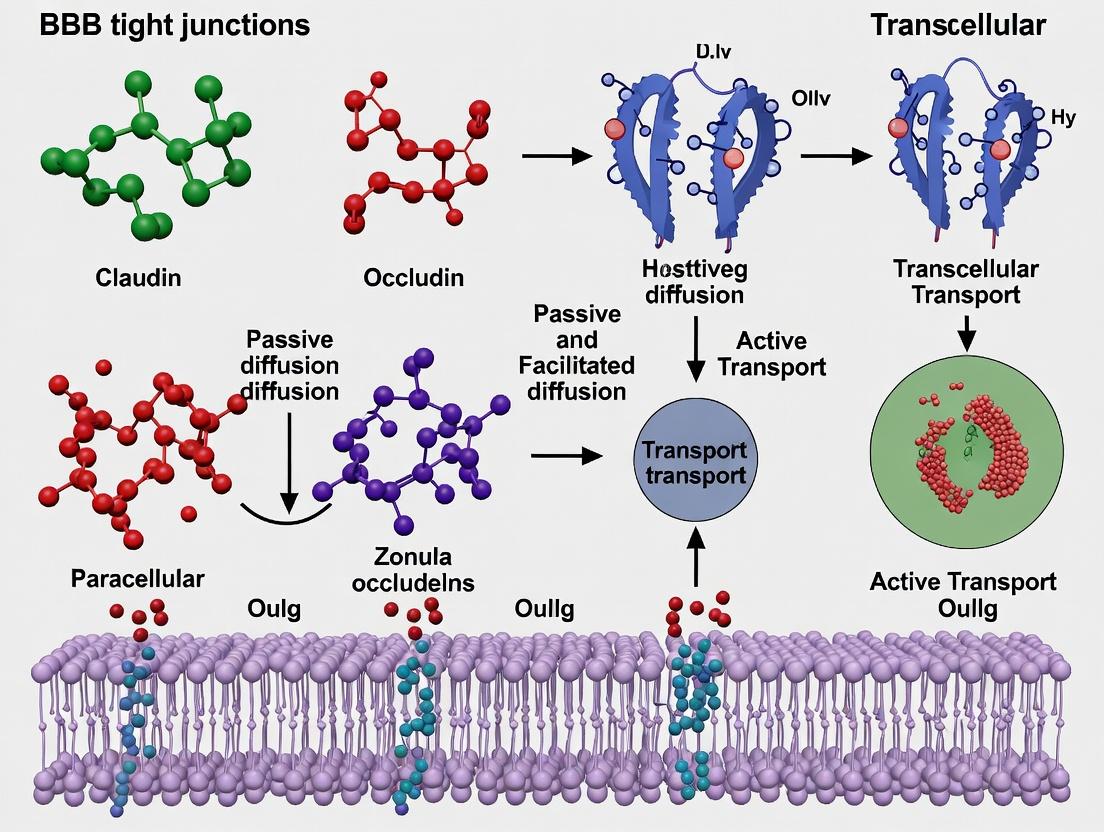
The Architecture of the BBB Seal: Unpacking Tight Junction Proteins and Paracellular Dynamics
The blood-brain barrier (BBB) is a dynamic, multi-cellular structure essential for central nervous system (CNS) homeostasis. This whitepaper, framed within a thesis on tight junctions and transport mechanisms, provides an in-depth technical review of the neurovascular unit (NVU) as the functional cornerstone of the BBB's selective permeability. We detail current molecular understanding, experimental methodologies, and quantitative data critical for research and therapeutic development.
The Neurovascular Unit: Composition and Core Functions
The NVU is a conceptual and physical framework defining the BBB not as a passive wall, but as a functional unit. Its coordinated cellular components regulate the exchange of molecules between blood and brain parenchyma with high selectivity.
Core Cellular Constituents:
- Brain Microvascular Endothelial Cells (BMECs): The primary physical and metabolic barrier. Exhibit continuous, non-fenestrated endothelium with elaborate tight junctions, low pinocytotic activity, and polarized expression of transport systems.
- Pericytes: Embedded within the capillary basement membrane. Regulate capillary diameter (cerebral blood flow), endothelial proliferation, and barrier integrity through paracrine signaling.
- Astrocyte End-Feet: Processes of astrocytes that ensheathe >99% of the abluminal capillary surface. Provide trophic support and modulate BBB function and water transport (via aquaporin-4).
- Microglia: Resident immune cells surveilling the CNS environment. Influence barrier properties under inflammatory conditions.
- Neurons: Project to capillaries and astrocytes, enabling direct neurovascular coupling (functional hyperemia).
- Basement Membrane & Extracellular Matrix: A laminar structure (endothelial and parenchymal basal lamina) providing structural support and a reservoir for signaling molecules.
The Selective Barrier: Tight Junctions and Transport Mechanisms
The BBB's selectivity arises from the synergy between physical (tight junctions) and biochemical (transporters) components.
Tight Junctions (TJs): The Paracellular Gate
TJs are complex protein networks sealing the intercellular space between adjacent BMECs, creating high transendothelial electrical resistance (TEER > 1500 Ω·cm² in vivo).
Key Protein Complexes:
- Integral Membrane Proteins:
- Claudins (esp. Claudin-3, -5, -12): Primary determinants of paracellular charge and size selectivity. Claudin-5 is the dominant sealing protein.
- Occludin: Regulatory protein modulating TJ assembly and disassembly.
- Junctional Adhesion Molecules (JAMs): Involved in cell-cell adhesion and leukocyte migration.
- Cytoplasmic Plaque Proteins (ZO-1, ZO-2, Cingulin, AF-6): Link transmembrane proteins to the actin cytoskeleton, enabling dynamic regulation.
Regulation: TJ assembly and permeability are dynamically regulated by phosphorylation events, inflammatory cytokines (TNF-α, IL-1β), and growth factors (VEGF).
Transport Mechanisms: The Controlled Pathways
Substance crossing occurs via specific, regulated pathways:
| Transport Mechanism | Description | Key Example Molecules/Systems | Direction |
|---|---|---|---|
| Transcellular Lipophilic Diffusion | Passive diffusion of small (<400-500 Da), lipid-soluble molecules. | O₂, CO₂, ethanol, steroid hormones. | Bidirectional |
| Carrier-Mediated Transport (CMT) | Facilitated diffusion or active transport via specific solute carriers (SLC). | GLUT1 (glucose), LAT1 (large neutral amino acids), MCT1 (monocarboxylates). | Influx/Efflux |
| Receptor-Mediated Transcytosis (RMT) | Vesicular transport initiated by ligand binding to specific surface receptors. | Transferrin receptor (TfR), Insulin receptor, LDLR-related proteins. | Primarily Influx |
| Adsorptive-Mediated Transcytosis (AMT) | Vesicular transport triggered by electrostatic interaction with cationic charges. | Cationized albumin, cell-penetrating peptides (e.g., TAT). | Primarily Influx |
| Active Efflux Transport | ATP-dependent export of toxins and drugs back into blood. | P-glycoprotein (P-gp/ABCB1), BCRP (ABCG2), MRPs. | Efflux |
Quantitative Data on BBB Components and Permeability
Table 1: Key Quantitative Parameters of the Human BBB In Vivo
| Parameter | Approximate Value / Range | Notes |
|---|---|---|
| Total Brain Capillary Surface Area | 12–18 m² | Allows extensive interface for selective exchange. |
| Capillary Density | 100–300 cm capillaries / cm³ tissue | Varies by brain region. |
| Transendothelial Electrical Resistance (TEER) | 1500–8000 Ω·cm² | In vivo measurement; sign of tight paracellular seal. |
| Paracellular Pore Radius | ~4 Å (0.4 nm) | Estimated functional pore size for diffusion. |
| GLUT1 Transporter Density | ~6–10 pmol/mg protein | Critical for glucose transport (Km ~5 mM). |
| P-glycoprotein Expression | High on luminal membrane | Major contributor to multidrug resistance. |
Table 2: Permeability Coefficients (Log P) for Representative Molecules
| Molecule | Log P (in vitro model approx.) | Primary Crossing Mechanism | Notes |
|---|---|---|---|
| Sucrose (MW 342) | ~ -6.5 to -7.0 cm/s | Paracellular (limited) / Passive Diffusion | Common integrity marker. |
| Caffeine | ~ -4.5 cm/s | Transcellular Diffusion | High lipid solubility. |
| L-Dopa | Variable | CMT via LAT1 | Prodrug for dopamine. |
| Antibody (IgG) | ~ -8.5 to -9.5 cm/s | Minimal; requires RMT engagement. | Baseline permeability very low. |
Detailed Experimental Protocols for BBB Research
Protocol 1: Establishment and Validation of an In Vitro BBB Model Using Primary BMECs
Objective: To create a physiologically relevant monoculture or co-culture model for permeability and mechanistic studies.
- BMEC Isolation: Isolate microvessels from human or rodent gray matter. Digest tissue with collagenase/dispase, separate on a density gradient (e.g., 18% dextran), and further digest with collagenase/collagenase-dispase to isolate capillaries.
- Endothelial Cell Culture: Plate isolated microvessels on collagen IV/fibronectin-coated surfaces. Culture in endothelial medium (e.g., EGM-2MV) supplemented with 1% platelet-poor plasma-derived serum, basic FGF, and hydrocortisone.
- Co-culture (Optional): For a triculture NVU model, plate primary brain pericytes on the basolateral side of a Transwell filter, and primary astrocytes on the bottom of the well plate. Seed BMECs on the apical side of the filter.
- TEER Measurement: Use an epithelial voltohmmeter with STX2 chopstick electrodes. Measure TEER (Ω·cm²) daily. Subtract the value of a cell-free coated insert. Models with TEER >150 Ω·cm² (monoculture) or >800 Ω·cm² (co-culture) are considered high-quality.
- Sodium Fluorescein Permeability Assay: Apply 100 µM sodium fluorescein (MW 376 Da) in HBSS to the apical chamber. Sample from the basolateral chamber at 30, 60, and 90 minutes. Quantify fluorescence (Ex/Em 485/535 nm). Calculate apparent permeability (Papp) using the formula: Papp = (dQ/dt) / (A * C₀), where dQ/dt is the flux rate, A is the membrane area, and C₀ is the initial donor concentration.
Protocol 2: Immunofluorescence Analysis of Tight Junction Proteins
Objective: To visualize and semi-quantify the localization and continuity of TJ strands.
- Fixation & Permeabilization: Wash cells (on coverslips or Transwell filters) with PBS. Fix with 4% paraformaldehyde for 15 min. Permeabilize with 0.1% Triton X-100 for 10 min. Block with 5% BSA/10% normal serum for 1 hour.
- Primary Antibody Incubation: Incubate with antibodies against target proteins (e.g., mouse anti-ZO-1, rabbit anti-Claudin-5) diluted in blocking buffer overnight at 4°C.
- Secondary Antibody & Imaging: Incubate with appropriate fluorophore-conjugated secondary antibodies (e.g., Alexa Fluor 488, 555) for 1 hour at RT. Mount with DAPI-containing medium. Image using a confocal microscope with a 63x oil objective. Analyze ZO-1 continuity and Claudin-5 signal intensity at cell borders using ImageJ software.
The Scientist's Toolkit: Key Research Reagent Solutions
Table 3: Essential Reagents for BBB/NVU Research
| Reagent/Material | Supplier Examples | Function in Research |
|---|---|---|
| Transwell Permeable Supports (polyester, 0.4µm or 1µm pore) | Corning, Falcon | Physical scaffold for growing polarized endothelial cell monolayers for TEER and transport assays. |
| EVOM3 / Epithelial Voltohmmeter with STX2 Electrodes | World Precision Instruments | Gold-standard instrument for non-destructive, real-time measurement of barrier integrity (TEER). |
| Primary Human Brain Microvascular Endothelial Cells (HBMECs) | Cell Systems, ScienCell | More physiologically relevant than immortalized lines; express functional TJs and transporters. |
| Recombinant Human/Mouse VEGF, TNF-α, IFN-γ | PeproTech, R&D Systems | Cytokines used to experimentally modulate TJ permeability and model inflammatory BBB disruption. |
| Anti-Claudin-5, Anti-ZO-1, Anti-Occludin Antibodies | Thermo Fisher, Abcam, Invitrogen | Key tools for immunofluorescence and Western blot analysis of TJ protein expression and localization. |
| Sodium Fluorescein, Lucifer Yellow, Dextran Conjugates (3-70 kDa) | Sigma-Aldrich, Thermo Fisher | Fluorescent permeability tracers of varying sizes to assess paracellular and transcellular flux. |
| Ko143 (BCRP inhibitor), Cyclosporin A / Tariquidar (P-gp inhibitors) | Tocris, Sigma-Aldrich | Pharmacological tools to inhibit major efflux transporters and study their role in drug penetration. |
| hCMEC/D3 Cell Line | Merck Millipore | A well-characterized, immortalized human brain endothelial cell line for standardized, high-throughput studies. |
Visualization of Key Pathways and Workflows
Title: TNF-α Signaling Leading to BBB Disruption
Title: Standard Compound Permeability Assay Workflow
This whitepaper provides an in-depth technical guide to the core molecular constituents of the tight junction (TJ), with a specific focus on their role in forming and regulating the blood-brain barrier (BBB). Within the context of BBB research, the precise assembly and dynamic regulation of claudins, occludin, junctional adhesion molecules (JAMs), and ZO scaffolding proteins govern paracellular permeability and coordinate signaling pathways critical for CNS homeostasis and drug delivery. This document synthesizes current data, experimental protocols, and research tools to serve as a resource for scientists investigating BBB transport mechanisms.
At the BBB, brain endothelial cells are linked by continuous, complex tight junctions that drastically reduce paracellular flux. These junctions are not static barriers but dynamic structures composed of transmembrane proteins linked to the actin cytoskeleton via cytoplasmic plaque proteins. Their core molecular composition—detailed herein—directly determines barrier selectivity and integrity, making them primary targets for research in neurovascular disease and CNS drug delivery.
Core Molecular Components: Structure and Function
Transmembrane Proteins
Claudins: A family of >25 proteins, each with four transmembrane domains forming two extracellular loops. The first loop dictates paracellular charge and size selectivity. Claudin-3, -5, and -12 are predominant at the BBB, with claudin-5 being essential for sealing the barrier against small molecules.
Occludin: A 65-kDa phosphoprotein with four transmembrane domains. Its precise role is modulatory; it strengthens the barrier, regulates selective trafficking, and is involved in sensing and responding to junctional tension.
Junctional Adhesion Molecules (JAMs): Immunoglobulin superfamily proteins (e.g., JAM-A, -B, -C) with a single transmembrane domain. They mediate homophilic and heterophilic adhesion, support cell polarity, and participate in leukocyte transmigration.
Cytoplasmic Plaque & Scaffolding Proteins
Zonula Occludens (ZO) Proteins: The ZO family (ZO-1, ZO-2, ZO-3) are membrane-associated guanylate kinase (MAGUK) proteins. They act as primary scaffolds, binding directly to the cytoplasmic tails of claudins, occludin, and JAMs, and linking the entire complex to the actin cytoskeleton. They are essential for TJ assembly, stabilization, and signal transduction.
Table 1: Core Tight Junction Proteins at the BBB
| Protein | Gene | Size (kDa) | Primary Function at BBB | Key Interactions |
|---|---|---|---|---|
| Claudin-5 | CLDN5 | ~23 | Major barrier-forming protein; charge-selective pore | ZO-1, ZO-2, other claudins |
| Occludin | OCLN | ~65 | Barrier regulation, microtubule organization, signaling | ZO-1, ZO-2, ZO-3, actin |
| JAM-A | F11R | ~32 | Adhesion, leukocyte transmigration, polarity | ZO-1, AF-6, PAR-3 |
| ZO-1 | TJP1 | 220 | Master scaffold, links transmembrane proteins to actin | All TJ transmembranes, actin, transcription factors |
Table 2: Quantitative Expression and Permeability Data (Model Systems)
| Protein | Relative mRNA Expression (Brain Endothelium vs. Peripheral) | Paracellular Permeability Change upon Knockdown/Silencing | Pore Characteristics (if applicable) |
|---|---|---|---|
| Claudin-5 | >100-fold higher | ↑ Lucifer Yellow flux (>300%) | Cation selectivity, ~4 Å radius |
| Occludin | ~10-fold higher | ↑ Sucrose flux (~150%), dysregulated trafficking | Not a pore-forming protein |
| JAM-A | ~2-fold higher | Mild ↑ in ions, significant ↑ in leukocyte adhesion | Adhesion molecule |
| ZO-1 | ~5-fold higher | Severe barrier disruption, discontinuous TJ strands | Scaffold, no direct pore function |
Experimental Protocols for Key Investigations
Protocol: Assessment of TJ Protein Localization and Expression (Immunofluorescence & Western Blot)
Objective: To visualize junctional distribution and quantify expression levels of claudins, occludin, JAMs, and ZOs in BBB models. Materials: Confluent human brain microvascular endothelial cell (hBMEC) monolayers, transwell inserts, ice-cold PBS, RIPA lysis buffer with protease/phosphatase inhibitors, 4% PFA, Triton X-100, blocking serum, primary and fluorescent secondary antibodies, SDS-PAGE system. Procedure:
- Fixation & Permeabilization: Wash cells with PBS, fix with 4% PFA for 15 min, permeabilize with 0.2% Triton X-100 for 10 min.
- Immunostaining: Block with 5% BSA for 1h. Incubate with primary antibody (e.g., anti-claudin-5, 1:200) overnight at 4°C. Wash and incubate with Alexa Fluor-conjugated secondary antibody (1:500) for 1h at RT. Mount with DAPI-containing medium.
- Imaging: Acquire high-resolution z-stack images using a confocal microscope. Analyze junctional continuity using line scan intensity profiles.
- Protein Extraction: Lysate cells in RIPA buffer on ice for 30 min. Centrifuge at 14,000g for 15 min at 4°C.
- Western Blot: Resolve 20-30 µg protein on 8-15% SDS-PAGE, transfer to PVDF membrane. Block, incubate with primary antibodies (e.g., anti-ZO-1, 1:1000) and HRP-conjugated secondaries. Develop with ECL and quantify band density normalized to β-actin.
Protocol: Functional Assessment of Barrier Integrity (TEER and Tracer Flux)
Objective: To quantitatively measure the functional integrity of TJs in real-time and via molecular flux. Materials: Electric Cell-substrate Impedance Sensing (ECIS) system or volt-ohm meter (for TEER); transwell inserts; fluorescent tracers (e.g., Na-Fluorescein (376 Da), 10 kDa dextran); plate reader. Procedure:
- TEER Monitoring: Plate hBMECs on collagen-coated electrode arrays (ECIS) or transwell filters. Monitor TEER daily until plateau. For manual TEER, use a chopstick electrode, measure in Ω·cm² (subtract blank filter resistance).
- Paracellular Tracer Flux Assay: Apply tracer (e.g., 100 µM Na-Fluorescein) to the apical compartment. Sample 100 µL from the basolateral compartment at 30, 60, 120 min, replacing with fresh medium. Measure fluorescence (Ex/Em: 485/535 nm). Calculate apparent permeability (Papp) using the formula: Papp = (dQ/dt) / (A * C₀), where dQ/dt is flux rate, A is membrane area, and C₀ is initial apical concentration.
Protocol: Proximity Ligation Assay (PLA) for Protein-Protein Interactions
Objective: To detect and visualize direct interactions between TJ components (e.g., claudin-5/ZO-1) in situ. Materials: Duolink PLA kit, primary antibodies from different hosts (e.g., mouse anti-claudin-5, rabbit anti-ZO-1), paraformaldehyde-fixed cell monolayers. Procedure:
- Perform standard immunostaining steps (fixation, permeabilization, blocking).
- Incubate with the two primary antibodies overnight at 4°C.
- Follow PLA protocol: Add species-specific PLA probes (PLUS and MINUS), hybridize, ligate, and amplify with fluorescent nucleotides.
- Mount and image. Each fluorescent spot represents a single interaction event.
Signaling Pathways and Regulatory Mechanisms
TJ assembly and permeability are regulated by intricate signaling networks. Key pathways include the VEGF/VEGFR2 pathway (destabilizing), the Wnt/β-catenin pathway (stabilizing and inductive for BBB properties), and small GTPase (RhoA, Rac1, Cdc42) pathways regulating actin dynamics.
Title: Key Signaling Pathways Regulating BBB Tight Junction Integrity
The Scientist's Toolkit: Key Research Reagent Solutions
Table 3: Essential Reagents for BBB Tight Junction Research
| Reagent/Material | Supplier Examples | Primary Function in Research |
|---|---|---|
| Primary Antibodies (anti-claudin-5, occludin, ZO-1, JAM-A) | Invitrogen, Santa Cruz, Cell Signaling | Detection and visualization of TJ proteins via WB, IF, IP. |
| Human Brain Microvascular Endothelial Cells (hBMECs) | ScienCell, Cell Systems, primary isolation | Gold-standard in vitro model for BBB studies. |
| Transwell Permeable Supports (0.4 µm, polyester) | Corning, Costar | Physical scaffold for forming endothelial monolayers for TEER and flux assays. |
| Electric Cell-substrate Impedance Sensing (ECIS) System | Applied BioPhysics | Real-time, label-free monitoring of TEER and cell behavior. |
| Paracellular Tracer Kit (Fluorescein, HRP, Dextrans) | Sigma-Aldrich, Thermo Fisher | Quantitative measurement of paracellular permeability. |
| Duolink Proximity Ligation Assay (PLA) Kit | Sigma-Aldrich | In situ detection of protein-protein interactions with high specificity. |
| Rho/Rac/Cdc42 Activation Assay Kits | Cytoskeleton, Inc. | Pull-down assays to measure active GTPase levels regulating TJ actin dynamics. |
| Recombinant VEGF-A / Wnt3a Proteins | R&D Systems | To exogenously activate destabilizing or stabilizing signaling pathways. |
| Claudin-5 siRNA / Overexpression Plasmid | Dharmacon, Origene | For functional loss-of-function or gain-of-function studies. |
The core molecular components of the TJ—claudins, occludin, JAMs, and ZO proteins—constitute a sophisticated, regulatable complex that is fundamental to BBB integrity. Mastery of their biology, coupled with the experimental methodologies and tools outlined here, is paramount for advancing research in neurovascular diseases, brain metastasis, and the development of strategies for CNS drug delivery. Future research will continue to unravel their post-translational modifications, interactome dynamics, and potential as therapeutic targets.
This whitepaper, framed within the context of advanced research on the Blood-Brain Barrier (BBB) and its transport mechanisms, provides a comprehensive technical guide to the signaling networks governing Tight Junction (TJ) integrity. We dissect the dynamic interplay between kinases, phosphatases, and small GTPases—the core regulatory triad that controls paracellular permeability. The focus is on molecular interactions at the BBB endothelium, with implications for drug delivery and neurological disease therapeutics.
The BBB, a specialized neurovascular unit, relies on intricate TJ complexes between endothelial cells to maintain CNS homeostasis. TJ integrity is not static but is dynamically regulated by intracellular signaling pathways. Kinases (adding phosphate groups), phosphatases (removing them), and small GTPases (molecular switches) form a signaling nexus that orchestrates TJ protein assembly, disassembly, and stabilization. Dysregulation of this nexus is a hallmark of pathologies like stroke, multiple sclerosis, and brain tumors, making it a prime target for therapeutic intervention.
Core Signaling Components
Kinases
Kinases phosphorylate TJ and associated proteins, altering their conformation, localization, and interactions.
Key Kinases in BBB TJ Regulation:
| Kinase | Primary Target(s) | Effect on TJ Integrity | Key Supporting Evidence (Model) |
|---|---|---|---|
| Protein Kinase C (PKC) isoforms | Occludin, ZO-1 | Dual role: PKCη stabilizes; PKCβ/θ disrupts. | In vitro hCMEC/D3 monolayer; TEER ↓ with PKCβ activation. |
| Rho-associated kinase (ROCK) | MLC, ZO-1 | Disruptive: Increases MLC phosphorylation, induces contraction. | Mouse pial venules; ROCK inhibitor Y-27632 increased TJ protein expression. |
| Phosphatidylinositol 3-kinase (PI3K) | Akt/PKB | Context-dependent: Can stabilize via Rac1 or disrupt via inflammation. | In vivo TBI model; LY294002 (PI3K inhibitor) reduced edema. |
| Src Family Kinases (SFK) | Occludin, β-catenin | Disruptive: Tyrosine phosphorylation leads to internalization. | bEnd.3 cells; PP2 (SFK inhibitor) prevented VEGF-induced permeability. |
| AMP-activated protein kinase (AMPK) | ZO-1, Claudin-5 | Stabilizing: Promotes junctional assembly. | Primary rat BMECs; Metformin (AMPK activator) increased TEER by ~40%. |
Phosphatases
Phosphatases counteract kinases to dephosphorylate targets, often promoting TJ stability.
Key Phosphatases in BBB TJ Regulation:
| Phosphatase | Primary Target(s) | Effect on TJ Integrity | Key Supporting Evidence (Model) |
|---|---|---|---|
| Protein Phosphatase 2A (PP2A) | Occludin (p-Ser/Thr) | Stabilizing: Maintains occludin at membranes. | MDCKII cells; Okadaic acid (PP2A inhibitor) reduced TEER by 70% in 2h. |
| PTEN | PIP3 (PI3K product) | Stabilizing: Antagonizes PI3K/Akt pathway. | In vivo ischemic stroke; endothelial PTEN knockout worsened outcome. |
| Myosin Light Chain Phosphatase (MLCP) | p-MLC | Stabilizing: Reduces actomyosin contraction. | HBMEC; Thrombin-induced barrier failure required MLCP inactivation. |
Small GTPases
Small GTPases act as binary switches (GTP-bound: ON, GDP-bound: OFF) to control cytoskeletal dynamics and vesicular trafficking.
Key Small GTPases in BBB TJ Regulation:
| GTPase | Upstream Regulator | Downstream Effector | Net Effect on TJ |
|---|---|---|---|
| RhoA | GEFs: p115RhoGEF, GEF-H1 | ROCK, mDia | Disruption: Stress fiber formation, contraction. |
| Rac1 | GEFs: Tiam1, β-PIX | p21-activated kinase (PAK), WAVE | Stabilization: Lamellipodia formation, promotes junction assembly. |
| Cdc42 | GEFs: FGD1, Intersectin | PAK, N-WASP | Stabilization: Filopodia formation, establishes cell polarity. |
| Rap1 | EPAC, cAMP | afadin, KRIT1 | Stabilization: Enhances cortical actin, promotes TJ protein recycling. |
Quantitative Data Summary: Functional Assays
| Assay Readout | Normalized Value (Control) | Value After Disruption (e.g., Pro-inflammatory Cytokines) | Value After Stabilization (e.g., Pharmacological Agonist) | Common Model System |
|---|---|---|---|---|
| Transendothelial Electrical Resistance (TEER) Ω·cm² | 100% | 40-60% | 120-150% | hCMEC/D3, primary BMECs |
| Paracellular Permeability (Papp) to 4 kDa FITC-dextran (cm/s x 10⁻⁶) | 1.0 - 2.5 | 5.0 - 15.0 | 0.5 - 1.5 | In vitro BBB models |
| Junctional Claudin-5 Intensity (AU) | 100% | 50-70% | 110-130% | Immunofluorescence, rodent brain slices |
Signaling Pathways and Nexus Integration
Diagram 1: Core TJ Integrity Signaling Nexus
Title: Core kinase, phosphatase, and GTPase interactions regulating TJs.
Diagram 2: Experimental Workflow for Nexus Analysis
Title: Integrated workflow for studying TJ signaling pathways.
Detailed Experimental Protocols
Protocol 1: Measuring Kinase Activity in BBB Endothelial Cells via FRET Biosensors
Objective: To quantify spatiotemporal activity of kinases (e.g., PKA, PKC) in live cells in response to stimuli.
- Cell Culture: Seed hCMEC/D3 cells on collagen-IV-coated 35mm glass-bottom dishes at 80% confluency.
- Transfection: Transfect with 2 µg of A-kinase activity reporter (AKAR) or CKAR (for PKC) FRET biosensor plasmid using Lipofectamine 3000. Incubate for 24-48h.
- Serum Starvation: Replace medium with low-serum (0.5% FBS) EBM-2 for 4h to reduce baseline activity.
- Imaging Setup: Use a confocal microscope with environmental control (37°C, 5% CO₂). Acquire images using 440 nm excitation and collect emission at 475 nm (CFP) and 535 nm (YFP) every 30 seconds.
- Stimulation & Inhibition: After 2 min baseline, add stimulus (e.g., 100 µM Forskolin for PKA; 100 nM PMA for PKC). In inhibitor studies, pre-treat with H-89 (10 µM for PKA) or Gö6983 (5 µM for PKC) for 30 min.
- Data Analysis: Calculate FRET ratio (YFP/CFP emission) over time for ROI at cell-cell junctions. Normalize to baseline (ΔR/R₀).
Protocol 2: Assessing Small GTPase Activation via Pull-Down Assay
Objective: To determine the active, GTP-bound state of RhoA, Rac1, or Cdc42 from BBB lysates.
- Lysate Preparation: Grow primary BMECs to confluence in 10 cm dishes. Treat as required (e.g., 10 ng/mL TNF-α for 30 min). Place on ice, wash with cold PBS, and lyse in 500 µL Mg²⁺ Lysis/Wash Buffer (MLB: 25 mM HEPES pH 7.5, 150 mM NaCl, 1% Igepal CA-630, 10 mM MgCl₂, 1 mM EDTA, 2% glycerol + protease inhibitors). Clarify at 14,000 x g for 10 min at 4°C.
- Pull-Down: Incubate 400 µg of lysate supernatant with 20 µg of GST-tagged Rhotekin-RBD (for RhoA) or PAK-PBD (for Rac1/Cdc42) beads for 1h at 4°C with gentle rotation.
- Washing: Pellet beads (5,000 x g, 1 min, 4°C), wash 3x with 500 µL MLB.
- Elution & Detection: Resuspend beads in 40 µL 2X Laemmli buffer, boil for 5 min. Run supernatant (active GTPase) and 20 µg total lysate (input control) on 12% SDS-PAGE. Transfer to PVDF and immunoblot for RhoA, Rac1, or Cdc42. Quantify band intensity; active fraction = (pulled-down signal / total input signal).
Protocol 3: Functional Assessment of TJ Integrity via TEER and Tracer Flux
Objective: To correlate signaling perturbations with functional barrier integrity.
- Cell Culture on Filters: Seed hCMEC/D3 cells (50,000 cells/cm²) on collagen/fibronectin-coated 0.4 µm polyester Transwell inserts. Culture for 5-7 days with daily medium changes.
- TEER Measurement: Use an epithelial voltohmmeter. Measure blank filter resistance (Rₛᵦₗₐₙₖ) and cell-covered filter resistance (Rₛₐₘₚₗₑ). Calculate TEER as (Rₛₐₘₚₗₑ – Rₛᵦₗₐₙₖ) × filter area (cm²). Record daily until stable (>40 Ω·cm²).
- Experimental Perturbation: Add treatments (e.g., 10 µM Y-27632 (ROCKi), 25 µM NSC23766 (Rac1 inhibitor)) to both apical and basolateral compartments. Measure TEER at 0, 2, 4, 8, 24h.
- Paracellular Tracer Flux: At desired timepoint, add 100 µL of 1 mg/mL 4 kDa FITC-dextran to the apical compartment. After 1h, collect 100 µL from the basolateral compartment. Measure fluorescence (Ex: 485 nm, Em: 535 nm). Calculate apparent permeability: Pₐₚₚ = (Vᵦ × Cᵦ) / (A × Cₐ × t), where Vᵦ is basolateral volume, Cᵦ is basolateral tracer concentration, A is filter area, Cₐ is initial apical concentration, and t is time.
The Scientist's Toolkit: Research Reagent Solutions
Essential Research Reagents for TJ Signaling Studies:
| Reagent | Category/Name | Function in TJ Research | Example Supplier/Cat # (for citation) |
|---|---|---|---|
| Selective Kinase Inhibitors | Y-27632 dihydrochloride (ROCKi) | Inhibits ROCK-mediated MLC phosphorylation; reduces stress fibers, improves barrier. | Tocris Bioscience (1254) |
| PP2 (Src Family Kinase Inhibitor) | Selectively inhibits SFKs; blocks VEGF-induced occludin phosphorylation. | Cayman Chemical (13198) | |
| GTPase Modulators | CN03 (RhoA activator) | Recombinant bacterial toxin; glucosylates and constitutively activates RhoA; induces barrier disruption. | Cytoskeleton, Inc. (CN03) |
| Rac1 Inhibitor (NSC23766) | Specifically blocks Rac1 interaction with GEFs Tiam1 and Trio; used to probe Rac1's stabilizing role. | MedChemExpress (HY-12536) | |
| Phosphatase Activators/Inhibitors | Okadaic Acid (PP2A/PP1 inhibitor) | Cell-permeable toxin; inhibits Ser/Thr phosphatases; used to study occludin phosphorylation dynamics. | Abcam (ab120375) |
| DT-061 (PP2A activator) | Stabilizes PP2A holoenzyme; used to promote junctional stability. | Sigma-Aldrich (SML2243) | |
| FRET Biosensors | pmCKAR (Plasma Membrane-targeted CKAR) | Genetically encoded FRET sensor for real-time PKC activity at the plasma membrane. | Addgene (Plasmid #14878) |
| Activity Assay Kits | G-LISA RhoA Activation Assay | Colorimetric ELISA-based kit to quantify active GTP-bound RhoA; faster than pull-downs. | Cytoskeleton, Inc. (BK124) |
| Validated Antibodies | Anti-phospho-occludin (Ser490) | Detects PKC-specific phosphorylation site critical for occludin internalization. | Invitrogen (MA5-24695) |
| Anti-Claudin-5 (Clone 4C3C2) | Highly specific for immunofluorescence and WB of BBB-enriched claudin-5. | Thermo Fisher Scientific (35-2500) | |
| Specialized Cell Media | EndoGRO-MV Complete Culture Medium | Serum-free, optimized medium for primary human brain microvascular endothelial cells. | MilliporeSigma (SCME004) |
| In Vivo Tracers | Evans Blue Dye (2% solution) | Albumin-bound dye for visual and spectrophotometric quantification of BBB leakage in vivo. | Sigma-Aldrich (E2129) |
| Advanced Imaging Reagents CellLight BacMam 2.0 (RFP-Lifeact) | Baculovirus delivery of Lifeact-RFP for non-cytotoxic labeling of F-actin in live BBB cells. | Thermo Fisher Scientific (C10604) |
The integrity of the blood-brain barrier (BBB) is fundamental to central nervous system (CNS) homeostasis, with tight junctions (TJs) forming the critical paracellular seal between brain endothelial cells. This whitepaper, framed within a broader thesis on BBB tight junctions and transport mechanisms, details the pathophysiological dysregulation of TJ complexes in neuroinflammatory, ischemic, and neurodegenerative contexts. Understanding these mechanisms is pivotal for developing therapeutic strategies aimed at preserving BBB integrity or selectively modulating permeability.
Pathophysiological Mechanisms of TJ Dysregulation
2.1 Neuroinflammation (e.g., Multiple Sclerosis, EAE) Pro-inflammatory cytokines (TNF-α, IL-1β, IL-6) and immune cell infiltration drive TJ disassembly. Key mechanisms include:
- Transcriptional Downregulation: Inflammatory mediators activate NF-κB and other pathways, repressing transcription of TJ proteins (claudin-5, occludin, ZO-1).
- Post-Translational Modification: Phosphorylation, ubiquitination, and internalization of occludin and ZO-1, leading to enhanced endocytosis and degradation.
- MMP-Mediated Degradation: Upregulation of matrix metalloproteinases (MMP-2, MMP-9) directly cleaves TJ and basal lamina components.
2.2 Ischemic Stroke (Focal Cerebral Ischemia) Ischemia-reperfusion injury induces rapid and dynamic TJ alterations via:
- Oxidative Stress & Nitrosative Stress: Reactive oxygen species (ROS) and peroxynitrite modify TJ proteins, disrupting their association.
- Inflammatory Cascade: Similar to neuroinflammation, post-ischemic inflammation perpetuates TJ disruption.
- Vascular Edema: Cytotoxic and ionic edema increase pericellular pressure, mechanically stressing TJ complexes.
2.3 Neurodegenerative Diseases (Alzheimer's Disease, Parkinson's Disease) Chronic, progressive TJ breakdown is observed, driven by:
- Amyloid-β (Aβ) and α-Synuclein: These pathogenic peptides can directly interact with endothelial cells, inducing oxidative stress and inflammatory signaling that downregulates TJ proteins.
- Pericyte Dysfunction: Loss of pericytes, essential for TJ protein expression and maintenance, is a hallmark.
- Chronic Neuroinflammation: Sustained glial activation creates a pro-inflammatory milieu affecting the BBB.
Table 1: Quantitative Changes in Key TJ Proteins Across Pathologies
| Pathology / Model | Claudin-5 Expression | Occludin Expression | ZO-1 Expression | Paracellular Permeability (e.g., Sucrose, Inulin) | Key Mediators Identified |
|---|---|---|---|---|---|
| EAE (Peak) | ↓ 60-70% (mRNA & protein) | ↓ 50-60% (protein) | Altered localization; ↑ cytoplasmic | ↑ 3-5 fold (Evans Blue, FITC-dextran 4kDa) | TNF-α, MMP-9, IFN-γ |
| MCAO (24h post-reperfusion) | ↓ ~40% (protein) | ↓ ~70% (protein; cleavage) | Discontinuous staining | ↑ 2-3 fold (FITC-dextran 70kDa) | ROS, MMP-9, IL-1β |
| Alzheimer's (APP/PS1 mouse, 12mo) | ↓ 30-40% (protein) | ↓ 40-50% (protein) | Fragmented staining | ↑ 1.5-2 fold (NaF, ⁹⁹mTc-DTPA) | Aβ1-42, RAGE, oxidative stress |
| In Vitro TNF-α/IL-1β Treatment | ↓ 50% (mRNA) | ↓ 40% (protein; ↑ phospho) | Internalization | ↓ TEER by 60-70% | NF-κB, MLCK |
Key Experimental Protocols for Investigating TJ Dysregulation
3.1 In Vitro BBB Model for Cytokine Challenge
- Purpose: To study direct effects of inflammatory cytokines on brain endothelial TJs.
- Protocol:
- Culture immortalized human brain microvascular endothelial cells (hBMECs) or primary cells on collagen/fibronectin-coated transwell inserts until confluent.
- Confirm barrier integrity by measuring Transendothelial Electrical Resistance (TEER) >150 Ω·cm² (hBMEC line) or >1000 Ω·cm² (primary).
- Treat the apical and basolateral compartments with a cytokine cocktail (e.g., 10 ng/mL TNF-α + 10 ng/mL IL-1β) for 6-48 hours.
- Measurements: Monitor TEER periodically. At endpoint, perform immunocytochemistry for claudin-5, occludin, ZO-1. Analyze paracellular permeability using FITC-dextran (4 kDa) flux assay. Harvest protein/mRNA for Western blot and qPCR analysis.
3.2 Focal Ischemia-Reperfusion Model (MCAO) and BBB Assessment
- Purpose: To evaluate temporal dynamics of TJ disruption after stroke.
- Protocol:
- Induce transient focal ischemia in C57BL/6 mice (male, 10-12 weeks) by intraluminal middle cerebral artery occlusion (MCAO) (e.g., 60 min occlusion).
- At reperfusion timepoints (3h, 24h, 72h), inject mice intravenously with a permeability tracer (e.g., Evans Blue dye, 2% solution, 4 mL/kg or FITC-dextran 70 kDa).
- After 30-60 min circulation, perfuse transcardially with PBS. Harvest ipsilateral and contralateral hemispheres.
- Measurements: Quantify extravasated Evans Blue via spectrophotometry (absorbance 620 nm) after formamide extraction, or image FITC-dextran fluorescence. Isolate microvessels via centrifugation for Western blot analysis of TJ proteins and phospho-occludin.
3.3 Immunohistochemical Co-Localization Analysis in Post-Mortem Tissue
- Purpose: To assess TJ protein localization and association with pathological hallmarks.
- Protocol:
- Obtain formalin-fixed, paraffin-embedded human or murine brain sections (e.g., hippocampal cortex for AD).
- Perform antigen retrieval (citrate buffer, pH 6.0). Block with serum.
- Co-stain with primary antibodies: mouse anti-claudin-5 (or rabbit anti-ZO-1) and rabbit anti-fibrillar Aβ (or goat anti-IBA1 for microglia). Use appropriate species-specific fluorescent secondary antibodies.
- Image using confocal microscopy.
- Analysis: Use image analysis software (e.g., ImageJ) to quantify fluorescence intensity of TJ protein along capillaries. Perform Pearson's correlation coefficient analysis to assess co-localization with pathological markers.
Visualization of Core Signaling Pathways
Title: Inflammatory Signaling to TJ Disruption
Title: Experimental Workflow for Stroke TJ Analysis
The Scientist's Toolkit: Key Research Reagent Solutions
Table 2: Essential Reagents and Materials for TJ Dysfunction Research
| Category | Item / Reagent | Function & Application | Example Vendor/Product |
|---|---|---|---|
| In Vitro Models | Primary Human BMECs | Gold standard for physiologically relevant BBB studies. | ScienCell Research (#1000) |
| hCMEC/D3 Cell Line | Immortalized human brain endothelial line; common for mechanistic studies. | Merck (SCC066) | |
| Transwell Inserts | Permeable supports for culture and TEER/permeability measurements. | Corning (3460, polyester) | |
| Critical Assays | EVOM2 Voltohmmeter | Measures Transendothelial Electrical Resistance (TEER) in real-time. | World Precision Instruments |
| FITC- or TRITC-Dextran | Fluorescent permeability tracers of varying sizes (4kDa-150kDa). | Merck (FD4, FD70S) | |
| Evans Blue Dye | Classic albumin-binding dye for in vivo permeability quantification. | Sigma-Aldrich (E2129) | |
| Key Antibodies | Anti-Claudin-5 | IF/IHC/WB for the critical TJ transmembrane protein. | Thermo Fisher (35-2500) |
| Anti-Occludin | IF/IHC/WB; phospho-specific antibodies assess regulation. | Thermo Fisher (33-1500) | |
| Anti-ZO-1 (TJP1) | IF/IHC to visualize junctional protein organization. | Thermo Fisher (33-9100) | |
| Inducers/Modulators | Recombinant TNF-α, IL-1β | Induce inflammatory TJ disruption in vitro and in vivo. | PeproTech (300-01A, 200-01B) |
| MMP Inhibitor (GM6001) | Broad-spectrum MMP inhibitor to probe protease-mediated cleavage. | Merck (CC1010) | |
| Rho Kinase (ROCK) Inhibitor (Y-27632) | Inhibits actomyosin contraction, can protect TJs. | Tocris Bioscience (1254) | |
| Analysis | Fluorescent Mounting Medium | For preserving fluorescence in stained tissue/cell sections. | Vector Labs (H-1000) |
| Microvessel Isolation Kit | Enriches brain capillaries for protein/RNA analysis from tissue. | Miltenyi Biotec (130-093-634) |
This whitepaper provides an in-depth comparative analysis of the specialized tight junctions (TJs) of the blood-brain barrier (BBB) and the endothelial barriers found in peripheral vasculature. This examination is situated within a broader thesis investigating the molecular architecture of BBB TJs and their interplay with specialized transport mechanisms. Understanding these differences is paramount for researchers and drug development professionals aiming to design effective central nervous system (CNS)-targeted therapeutics.
Structural and Molecular Composition
The fundamental disparity lies in the complexity, density, and regulatory control of the TJ protein networks. BBB endothelial TJs form a continuous, high-resistance barrier, while peripheral endothelial TJs are more dynamic and porous.
Table 1: Core Molecular Composition Comparison
| Component | BBB Endothelial Tight Junctions | Peripheral Endothelial Barriers (e.g., dermal, muscle) |
|---|---|---|
| Primary Transmembrane Proteins | Claudin-1, -3, -5, -12; Occludin; JAM-A, -B, -C | Claudin-5 (variable); Occludin (lower expression); JAM-A |
| Key Regulatory Scaffold Proteins | ZO-1, ZO-2, AF-6, cingulin | ZO-1, ZO-2 |
| Adherens Junction Dominance | VE-cadherin (highly expressed, linked to TJ stability) | VE-cadherin (primary cell-cell adhesion) |
| Association with Pericytes | Extensive, direct contact regulating TJ protein expression | Limited or indirect contact |
| Basement Membrane | Two distinct layers (endothelial + astrocytic) | Single, often less dense layer |
| Functional Transmembrane Protein | Claudin-5 is the principal sealing protein; Claudin-3 adds redundancy. | Claudin-5 expression is heterogeneous and context-dependent. |
Table 2: Quantitative Functional Metrics
| Parameter | BBB Endothelial TJs | Peripheral Endothelial TJs |
|---|---|---|
| Transendothelial Electrical Resistance (TEER) | 1500-2000 Ω·cm² (in vivo) / 200-800 Ω·cm² (in vitro models) | 5-50 Ω·cm² |
| Permeability Coefficient (Pe) to Sucrose | ~0.1 - 1.0 x 10⁻⁶ cm/s | ~10 - 100 x 10⁻⁶ cm/s |
| Paracellular Pore Radius (Theoretical) | ~4-6 Å | ~30-60 Å |
| Protein Complexity (Estimated unique TJ-related proteins) | >50 | ~20-30 |
Signaling and Regulatory Pathways
BBB TJ integrity is maintained by a concert of constitutive and inducible signaling pathways from the neurovascular unit (NVU), absent in peripheral endothelium.
Diagram 1: NVU Signaling for BBB TJ Regulation (100/100 chars)
Experimental Protocols for Comparative Study
Protocol 4.1: Quantitative Measurement of Barrier Integrity (TEER & Permeability)
- Objective: To compare the functional tightness of BBB vs. peripheral endothelial cell monolayers.
- Materials: Transwell inserts (e.g., 0.4 µm pore, polyester); Epithelial volt/ohmmeter (EVOM); Radioactive or fluorescent tracer (e.g., ¹⁴C-sucrose, FITC-dextran 4kDa); cell culture models (e.g., hCMEC/D3 for BBB, HUVEC for peripheral).
- Method:
- Culture: Seed cells at high density on Transwell filters. Grow to confluence (BBB models may require coculture with astrocytes/pericytes).
- TEER Measurement: Place electrodes in the apical and basolateral chambers. Measure resistance (Ω). Subtract background (cell-free insert) resistance. Multiply by the membrane area (Ω·cm²). Perform daily.
- Tracer Flux Assay: Add tracer to the apical chamber. Sample from the basolateral chamber at timed intervals (e.g., 30, 60, 120 min). Quantify tracer via scintillation counting or fluorometry.
- Analysis: Calculate apparent permeability: ( Pe = (Vr \cdot Cr) / (A \cdot Cd \cdot t) ), where ( Vr ) = receiver volume, ( Cr ) = receiver concentration, ( A ) = membrane area, ( C_d ) = donor concentration, ( t ) = time.
Protocol 4.2: Immunofluorescence and Super-Resolution Imaging of TJ Strands
- Objective: To visualize and quantify the density and continuity of TJ protein networks.
- Materials: Confluent cell monolayers on coverslips; primary antibodies (anti-Claudin-5, anti-ZO-1, anti-Occludin); fluorescent secondary antibodies; STED or SIM super-resolution microscope.
- Method:
- Fix cells with ice-cold methanol or 4% PFA. Permeabilize with 0.1% Triton X-100 (if using PFA).
- Block with 5% BSA. Incubate with primary antibodies overnight at 4°C.
- Incubate with fluorophore-conjugated secondary antibodies. Stain nuclei (DAPI). Mount.
- Acquire Z-stack images via confocal microscopy. For strand analysis, use super-resolution (STED/SIM) in the XY plane.
- Quantification: Use ImageJ plugins (e.g., "JACoP" for colocalization, "Analyze Particles" for gap detection). Measure fluorescence intensity at cell borders and strand continuity.
Protocol 4.3: Transcriptomic/Proteomic Profiling of TJ Complexes
- Objective: To comprehensively identify and quantify TJ-associated molecules.
- Materials: BBB and peripheral endothelial cells; TRIzol/RIPA buffer; mass spectrometer; next-generation sequencer.
- Method:
- Sample Prep: Lyse cells in appropriate buffer. For proteomics, immunoprecipitate TJ complexes using an antibody against a core protein (e.g., ZO-1).
- RNA-seq: Isolate total RNA, prepare poly-A library, sequence on an Illumina platform. Align reads to reference genome, quantify gene expression (FPKM/TPM).
- Mass Spectrometry: Digest proteins with trypsin. Analyze peptides via LC-MS/MS (e.g., Orbitrap). Identify proteins via database search (e.g., UniProt).
- Bioinformatics: Perform differential expression analysis (DESeq2 for RNA-seq, Limma for proteomics). Conduct pathway enrichment analysis (GO, KEGG).
The Scientist's Toolkit: Key Research Reagent Solutions
Table 3: Essential Reagents for BBB vs. Peripheral Barrier Research
| Reagent / Material | Primary Function & Application | Example Product/Catalog # (Illustrative) |
|---|---|---|
| hCMEC/D3 Cell Line | Immortalized human BBB endothelial model for in vitro BBB studies. | Merck, SCC066 |
| HUVEC (Human Umbilical Vein Endothelial Cells) | Standard model for peripheral macrovasculature endothelial studies. | Lonza, C2519A |
| Anti-Claudin-5 Antibody | Key marker for endothelial TJs; used in WB, IF, IP. Critical for both BBB (high) and peripheral (variable) staining. | Thermo Fisher, 35-2500 |
| Anti-ZO-1 Antibody | Marker for TJ scaffold protein; indicates maturation and localization of TJ complexes. | Proteintech, 21773-1-AP |
| TEER Measurement System | Quantitative, non-invasive assessment of monolayer barrier integrity in real-time. | World Precision Instruments, EVOM3 |
| Fluorescent Tracers (FITC-Dextran, 4-70 kDa) | Size-defined molecules to measure paracellular permeability. | Sigma Aldrich, FD4, FD40S |
| ROCK Inhibitor (Y-27632) | Used to improve viability of primary endothelial cells; modulates actin/TJ linkage. | Tocris, 1254 |
| Recombinant Wnt3a Protein | Activates canonical Wnt signaling to induce/maintain BBB-specific TJ properties in vitro. | R&D Systems, 5036-WN |
| Transwell Permeable Supports | Polyester or polycarbonate filters for growing cell monolayers for transport assays. | Corning, 3460 |
Diagram 2: Experimental Workflow for Comparative TJ Studies (99/100 chars)
The BBB tight junction is a uniquely sophisticated, high-resistance structure forged by the specific demands of the CNS and signals from the NVU. It is molecularly distinct from the more permeable and dynamic barriers of peripheral endothelium, primarily through the expression level, combinatorial complexity, and stable anchoring of claudins and associated scaffolding proteins. This comparative understanding directly informs strategies for modulating barrier permeability—either to enhance CNS drug delivery or to treat conditions of pathological barrier leakage.
Bridging the Barrier: Experimental Models and Strategies to Modulate TJ Permeability
This guide details the primary in vitro models of the blood-brain barrier (BBB), framed within the critical research context of understanding BBB tight junction integrity and transport mechanisms. The selection of an appropriate model directly impacts the validity of data on paracellular permeability, transcytosis, and efflux transport—key determinants of central nervous system drug delivery and neurotoxicity.
In vitro BBB models are engineered to recapitulate the neurovascular unit, with a focus on the specialized brain microvascular endothelial cells (BMECs) that form restrictive tight junctions. The choice of model balances physiological relevance with practicality.
Transwell Assays
The cornerstone functional setup for permeability measurement. Cells are cultured on a porous membrane insert, allowing separate access to the apical (blood) and basolateral (brain) compartments.
Key Protocol: Measurement of Apparent Permeability (Papp)
- Cell Seeding: Seed BMECs on collagen/fibronectin-coated polyester or polycarbonate Transwell inserts (0.4–3.0 µm pore size, typical density 50,000–100,000 cells/cm²).
- Barrier Validation: Confirm monolayer integrity prior to assay via Transendothelial Electrical Resistance (TEER ≥ 150 Ω·cm² for most models) using a volt/ohmmeter with chopstick or EndOhm electrodes.
- Tracer Application: Add a permeability tracer (e.g., sodium fluorescein (376 Da), Lucifer yellow (457 Da), or FITC-dextran (4-70 kDa)) to the apical donor compartment. Use Hank's Balanced Salt Solution (HBSS) with 10 mM HEPES, pH 7.4.
- Sampling: At defined intervals (e.g., 30, 60, 90, 120 min), sample from the basolateral acceptor compartment. Replace with fresh buffer to maintain sink conditions.
- Quantification: Analyze tracer concentration via fluorometry or spectrophotometry. Calculate Papp (cm/s) using: Papp = (dQ/dt) / (A × C0), where dQ/dt is the steady-state flux rate, A is the membrane area, and C0 is the initial donor concentration.
Primary Cultures
Isolated brain microvessels are enzymatically digested to obtain primary BMECs, often co-cultured with primary astrocytes or pericytes to enhance barrier properties.
Key Protocol: Rat Primary BMEC Isolation and Co-culture
- Dissection: Isolate cortices from 5-10 rats (e.g., Sprague-Dawley, 2-4 weeks old). Mince in ice-cold DMEM.
- Enzymatic Digestion: Digest in DMEM containing 1 mg/mL collagenase type II and 10 µg/mL DNase I for 1.5 hours at 37°C.
- Density Gradient Centrifugation: Suspend pellet in 20% Bovine Serum Albumin (BSA)-DMEM. Centrifuge at 1000×g for 20 minutes. Collect the microvessel-rich pellet.
- Second Digestion: Digest microvessels in collagenase/dispase (1 mg/mL) and DNase I (10 µg/mL) for 1 hour at 37°C.
- Plating: Seed purified BMECs on collagen IV/fibronectin-coated surfaces or Transwells in medium supplemented with platelet-poor plasma-derived serum, heparin, and growth factors (e.g., bFGF).
- Co-culture: Plate primary rat astrocytes on the basolateral side of the Transwell plate 2-3 days prior to BMEC seeding to induce barrier enhancement.
Stem Cell-Derived Models
Induced pluripotent stem cells (iPSCs) or embryonic stem cells (ESCs) are differentiated into BMEC-like cells, offering a human genetic background.
Key Protocol: iPSC Differentiation to BMEC-like Cells
- Maintenance: Culture iPSCs in mTeSR1 or E8 medium on Matrigel.
- Mesoderm Induction: At ~80% confluency, switch to unconditioned medium (UM; DMEM/F12, 20% KnockOut Serum Replacement, 1% NEAA, 0.5% GlutaMAX) for 6 days.
- Endothelial Specification: Switch to endothelial cell medium (hECSFM; human Endothelial-SFM, 1% platelet-poor plasma-derived serum, 20 ng/mL bFGF) for 2 days.
- Purification: Subculture cells on collagen IV/fibronectin-coated Transwells in hECSFM. A typical seeding density is 1,000,000 cells/cm². Barrier properties peak within 2-3 days.
Immortalized Cell Lines
Genetically modified cell lines (e.g., hCMEC/D3, RBE4, bEnd.3) offer reproducibility and ease of use but with compromised barrier tightness.
Key Protocol: Standard hCMEC/D3 Culture and Assay
- Culture: Maintain hCMEC/D3 cells in EGM-2 MV medium on collagen type I-coated flasks.
- Assay Setup: Seed cells at 50,000-75,000 cells/cm² on rat tail collagen I-coated Transwell inserts (0.4 µm pore). Culture for 2-3 days to reach confluence.
- Barrier Induction: Add 250-500 µM cAMP and 17.5 µM RO-20-1724 (a phosphodiesterase inhibitor) to both apical and basolateral compartments 24 hours prior to assays to elevate TEER (typically to 50-150 Ω·cm²).
Quantitative Model Comparison
Table 1: Characteristic Metrics of Common In Vitro BBB Models
| Model Category | Specific Model | Typical TEER (Ω·cm²) | Papp NaF (×10⁻⁶ cm/s) | Key Strengths | Key Limitations |
|---|---|---|---|---|---|
| Primary (Bovine) | Bovine BMEC/Astrocyte Co-culture | 800 - 1500 | 0.5 - 2.0 | High TEER, strong TJs, responsive to inducing cues | Species difference, inter-isolation variability |
| Primary (Porcine) | Porcine BMEC Co-culture | 1500 - 3000 | 0.2 - 1.5 | Very high TEER, physiologically relevant | Sourcing difficulty, high maintenance cost |
| Primary (Rodent) | Rat BMEC/Astrocyte Co-culture | 200 - 600 | 1.0 - 5.0 | Good balance of relevance & practicality, responsive | Declining purity/function post-isolation |
| Stem Cell-Derived | Human iPSC-derived BMEC | 1000 - 4000 | 0.1 - 1.5 | Human genotype, high scalability, high TEER potential | Clone-dependent variability, complex protocol |
| Immortalized (Human) | hCMEC/D3 | 30 - 150* (up to 250 with cAMP) | 10 - 30 | Human origin, easy culture, genetic manipulation | Low baseline TEER, altered transporter expression |
| Immortalized (Murine) | bEnd.3 | 20 - 50 | 15 - 40 | Rapid growth, easy to transfert | Very leaky barrier, low TJ protein expression |
| Immortalized (Rat) | RBE4 | 40 - 80 | 8 - 20 | Polarized transport, retains some carrier systems | Moderate TEER, requires complex medium |
Note: TEER and Papp values are representative ranges from literature; NaF = Sodium Fluorescein. TEER for hCMEC/D3 can be enhanced with inducing agents.
Table 2: Expression of Key Tight Junction and Transport Proteins Across Models
| Protein (Gene) | Primary (Porcine) | iPSC-BMEC | hCMEC/D3 | bEnd.3 | Relevance to BBB Function |
|---|---|---|---|---|---|
| Claudin-5 (CLDN5) | ++++ | ++++ | ++ | + | Primary determinant of paracellular tightness |
| Occludin (OCLN) | ++++ | ++++ | + | +/- | Regulatory TJ protein, linked to signaling |
| ZO-1 (TJP1) | ++++ | ++++ | +++ | ++ | Scaffold linking TJs to actin cytoskeleton |
| P-glycoprotein (ABCB1) | +++ | +++ | + (variable) | +/- | Critical efflux transporter (multidrug resistance) |
| GLUT-1 (SLC2A1) | ++++ | +++ | ++ | + | Major glucose transporter (constitutive expression) |
| Transferrin Receptor (TFRC) | ++ | ++ | ++++ | ++ | Receptor-mediated transcytosis pathway |
(++++ = High/Consistent Expression, += Low/Variable Expression)
Core Signaling Pathways in Barrier Induction and Maintenance
Diagram 1: Key Signaling Pathways in BBB Induction
Experimental Workflow for Model Validation
Diagram 2: BBB Model Validation Workflow
The Scientist's Toolkit: Essential Research Reagent Solutions
Table 3: Key Reagents and Materials for In Vitro BBB Research
| Item | Function & Application | Example Product/Catalog Number |
|---|---|---|
| Transwell Inserts | Permeable support for polarized cell culture and permeability assays. Pore size (0.4, 1.0, 3.0 µm) and membrane material (polyester, polycarbonate) are key variables. | Corning Costar 3470 (Polyester, 0.4 µm), Falcon 353493 (PET, 1.0 µm) |
| TEER Measurement System | Quantitative, non-destructive assessment of monolayer integrity and tight junction formation. | EVOM3 with STX2 Chopstick Electrodes (World Precision Instruments), EndOhm-12 Chamber (World Precision Instruments) |
| ECM Coating Reagents | Mimic the basal lamina; essential for BMEC adhesion, survival, and barrier function. | Collagen Type IV (from human placenta, Sigma C5533), Fibronectin (from human plasma, Corning 356008) |
| BBB-Permeability Tracers | Fluorescent or radiolabeled molecules to quantify paracellular and transcellular flux. | Sodium Fluorescein (NaF, 376 Da), Lucifer Yellow CH (LY, 457 Da), FITC-Dextran 4 kDa, [³H]-Sucrose |
| P-glycoprotein Substrates/Inhibitors | Assess functional activity of the critical efflux transporter ABCB1/MDR1. | Rhodamine 123 (substrate), Calcein-AM (substrate), Zosuquidar (LY335979, specific inhibitor) |
| Tight Junction Antibodies | Validate expression and localization of key TJ proteins via immunofluorescence/Western blot. | Anti-Claudin-5 (Invitrogen 35-2500), Anti-Occludin (Invitrogen 33-1500), Anti-ZO-1 (Invitrogen 33-9100) |
| Barrier-Inducing Agents | Chemically elevate intracellular cAMP to enhance tight junction assembly and TEER. | 8-(4-Chlorophenylthio)adenosine 3',5'-cyclic monophosphate (CPT-cAMP), Forskolin (adenylyl cyclase activator) |
| Specialized Cell Culture Media | Formulations optimized for specific cell types (e.g., primary BMECs, hCMEC/D3, iPSCs). | Endothelial Cell Growth Medium-2 (EGM-2 MV, Lonza), mTeSR1 (Stemcell Tech, for iPSCs), hECSFM (for iPSC-BMECs) |
Selecting an appropriate in vitro BBB model requires careful consideration of the research question—specifically whether it prioritizes high-throughput screening (favoring immortalized lines), mechanistic study of human transport (favoring iPSC models), or maximum barrier fidelity (favoring primary co-cultures). Consistent validation of tight junction integrity and transport functionality is non-negotiable for generating physiologically relevant data on BBB permeability and compound trafficking.
Research on the Blood-Brain Barrier (BBB) has long focused on the central role of endothelial tight junctions (TJs) and specialized transport mechanisms (e.g., influx transporters like GLUT1, efflux pumps like P-gp). While critical, this endothelial-centric view is insufficient for modeling the complex neurovascular unit (NVU). This whitepaper, framed within a broader thesis on BBB TJs and transport, posits that incorporating astrocytes and pericytes into advanced co-culture systems is not merely additive but synergistic. It is essential for recapitulating physiologic TJ integrity, transporter expression, and barrier functionality for relevant drug permeability research.
The Tri-Cellular NVU and Its Quantitative Impact
Quantitative data from recent studies (2022-2024) underscore the measurable impact of pericytes and astrocytes on BBB models. The table below summarizes key metrics comparing monoculture (brain microvascular endothelial cells, BMECs) with tri-culture systems.
Table 1: Quantitative Impact of Pericyte and Astrocyte Incorporation on BBB Models
| Parameter | BMEC Monoculture | BMEC + Astrocyte Co-culture | BMEC + Pericyte + Astrocyte Tri-culture | Measurement Method |
|---|---|---|---|---|
| Transendothelial Electrical Resistance (TEER) | 150-250 Ω·cm² | 400-600 Ω·cm² | 800-1200+ Ω·cm² | Voltm/Ohm meter, CellZscope |
| Apparent Permeability (Papp) of NaF (paracellular marker) | ~3.0 x 10⁻³ cm/min | ~1.5 x 10⁻³ cm/min | ~0.8 x 10⁻³ cm/min | Fluorescence-based assay |
| P-gp Efflux Ratio (Rhodamine 123) | 1.5 - 2.5 | 3.0 - 4.5 | 5.0 - 8.0 | Bidirectional transport assay |
| CLDN5 Expression (Protein) | Baseline | 1.8 - 2.5x increase | 3.0 - 4.0x increase | Western Blot, Immunofluorescence |
| GLUT1 Activity (3H-DG uptake) | Baseline | 1.5x increase | 2.0 - 2.5x increase | Radioligand uptake assay |
| Sealing Time to Peak TEER | 5-7 days | 3-5 days | 2-4 days | Continuous monitoring |
Core Experimental Protocols
Protocol 1: Establishment of a Transwell-Based Tri-Culture Model
- Objective: To create a physiologically relevant BBB model with asymmetric cell positioning.
- Materials: 24-well Transwell inserts (0.4 μm pore, polyester), human brain microvascular endothelial cells (hBMECs), human brain vascular pericytes (HBVPs), human astrocytes.
- Procedure:
- Day -2 (Basement Membrane): Coat the underside (basolateral side) of the Transwell insert with 50 μg/mL collagen IV and 10 μg/mL fibronectin in PBS. Incubate for 2 hours at 37°C.
- Day -1 (Pericyte Seeding): Seed HBVPs (Passage 4-6) at a density of 1.5 x 10⁴ cells/cm² onto the coated underside of the insert. Invert the insert in a 6-well plate and centrifuge at 500 x g for 5 minutes to pellet cells onto the membrane. Return plates to the incubator for 4 hours, then carefully place inserts right-side-up in a 24-well plate with fresh medium.
- Day 0 (Astrocyte Seeding): Seed astrocytes at a density of 2.0 x 10⁴ cells/cm² in the basolateral chamber (well bottom).
- Day +1 (Endothelial Seeding): Seed hBMECs at a density of 5.0 x 10⁴ cells/cm² on the apical (top) side of the Transwell membrane.
- Culture: Maintain in specialized endothelial medium supplemented with 500 nM retinoic acid and 1% platelet-poor plasma-derived serum (PPDS). Change media every 48 hours. Monitor TEER daily until plateau (>1000 Ω·cm²).
Protocol 2: Functional Validation via Bidirectional Transport Assay
- Objective: To quantify passive paracellular permeability and active efflux transporter function.
- Materials: Hanks' Balanced Salt Solution (HBSS, pH 7.4), fluorescent markers (e.g., NaF for paracellular, Rhodamine 123 for P-gp), LC-MS/MS or plate reader.
- Procedure:
- Preparation: Equilibrate tri-culture models in pre-warmed HBSS for 30 min.
- A-to-B (Apical-to-Basolateral) Transport: Add donor solution (HBSS with tracer) to the apical chamber. Sample from the basolateral chamber at 15, 30, 60, and 120 minutes, replacing with fresh HBSS.
- B-to-A (Basolateral-to-Apical) Transport: In separate inserts, add donor solution to the basolateral chamber. Sample from the apical chamber at the same time points.
- Analysis: Quantify tracer concentration (fluorescence/MS). Calculate Papp using the formula:
Papp = (dQ/dt) / (A * C₀), where dQ/dt is the transport rate, A is the membrane area, and C₀ is the initial donor concentration. - Efflux Ratio (ER): Calculate as
ER = Papp (B-to-A) / Papp (A-to-B). An ER > 2.5 indicates significant active efflux.
Signaling Pathways in TJ Maturation
Diagram Title: NVU Cell Signaling to BMEC Barrier Properties
Experimental Workflow for Model Development
Diagram Title: Tri-Culture BBB Model Setup Workflow
The Scientist's Toolkit: Key Research Reagent Solutions
Table 2: Essential Materials for Advanced BBB Co-culture Research
| Reagent/Material | Supplier Examples | Function in Co-culture System |
|---|---|---|
| hBMECs (Primary or iPSC-derived) | Cell Systems, iXCells, STEMCELL Tech | The core barrier-forming endothelial component. Must express key TJ proteins and transporters. |
| Human Brain Vascular Pericytes (HBVPs) | ScienCell, Lonza, PromoCell | Provide structural support and secrete crucial stabilizing signals (TGF-β, ANG-1). |
| Human Astrocytes | ScienCell, ATCC | Induce BBB properties via secretion of soluble factors (GDNF, Shh). |
| Platelet-Poor Plasma-Derived Serum (PPDS) | Thermo Fisher, Alfa Aesar | Serum substitute that supports endothelial growth without disrupting barrier function. |
| All-Trans Retinoic Acid | Sigma-Aldrich, Tocris | Potent inducer of BBB phenotype; upregulates CLDN5, P-gp, and reduces permeability. |
| Collagen IV & Fibronectin | Corning, Sigma-Aldrich | Key basement membrane proteins for physiological cell adhesion and polarization. |
| Transwell Permeable Supports (Polyester) | Corning | Physical scaffold allowing independent access to apical and basolateral compartments. |
| Electrical Cell-Substrate Impedance Sensing (ECIS) or CellZscope | Applied Biophysics, nanoAnalytics | Enables real-time, non-invasive monitoring of TEER as a proxy for barrier integrity. |
| Recombinant Human TGF-β1 & GDNF | PeproTech, R&D Systems | Used in reductionist experiments to validate specific signaling pathway effects on BMECs. |
1. Introduction This whitepaper, situated within a broader thesis on blood-brain barrier (BBB) tight junction (TJ) and transport mechanism research, provides a technical guide to two principal modulation strategies: transient, reversible opening via chemical permeation enhancers and targeted, gene-silencing approaches using small interfering RNA (siRNA). The integrity of cerebral microvascular endothelial TJs, primarily governed by claudins (esp. CLDN5), occludin, and ZO proteins, is the critical determinant of paracellular permeability. Circumventing this barrier remains the central challenge in delivering therapeutics for neurological diseases.
2. Permeation Enhancers: Pharmacological Disruption of TJs Permeation enhancers (PEs) are chemical agents that induce a transient, reversible loosening of TJ complexes, increasing paracellular flux.
2.1. Key Mechanisms of Action
- Calcium Chelation (e.g., EDTA, Citrate): Reduces extracellular Ca²⁺, disrupting Ca²⁺-dependent cadherin interactions and intracellular signaling, leading to TJ destabilization.
- Actin Modulation (e.g., Cytochalasin D): Depolymerizes the actin cytoskeleton, breaking the anchor between TJ transmembrane proteins and intracellular scaffolds.
- Inflammatory Mediator Induction (e.g., Bradykinin, Histamine): Activates G-protein-coupled receptors (e.g., B2, H2), triggering intracellular Ca²⁺ release and PKC activation, resulting in TJ phosphorylation and internalization.
- Direct TJ Protein Interaction (e.g., AT1002): Derived from Vibrio cholerae Zonula Occludens toxin, it binds to occludin, activating PKCα and causing ZO-1/occludin dissociation.
Diagram 1: Permeation Enhancer Signaling Pathways
2.2. Quantitative Efficacy of Selected Permeation Enhancers Table 1: In Vitro Efficacy Metrics of Common Permeation Enhancers
| Permeation Enhancer | Model System | Key Metric Change | Reported Effect Size | Primary Mechanism |
|---|---|---|---|---|
| Sodium Caprate (C10) | hCMEC/D3 monolayer | Transepithelial Electrical Resistance (TEER) | Reduction of 60-80% within 30 min | Intracellular Ca²⁺ rise, PKC activation, actin rearrangement |
| Bradykinin | Bovine BMEC monolayer | Sucrose/Sodium Fluorescein Permeability (Papp) | ~5-fold increase in Papp | B2 receptor, PLC/PKC pathway |
| AT1002 | Rat BBB in situ perfusion | Dextran (3kDa) Uptake | ~8-fold increase | Binds occludin, ZO-1 dissociation |
| EDTA (5mM) | RBE4 cell monolayer | Lucifer Yellow (457 Da) Flux | ~15-fold increase | Calcium chelation |
2.3. Standardized Protocol: TEER Reduction Assay for PE Screening
- Cell Culture: Seed human brain endothelial cells (e.g., hCMEC/D3) at 100,000 cells/cm² on collagen/fibronectin-coated Transwell inserts (0.4 μm pore, 12 mm diameter). Culture for 5-7 days until stable TEER >50 Ω·cm².
- TEER Baseline: Measure TEER using an epithelial volt-ohm meter. Record triplicate measurements per insert in culture medium at 37°C.
- Treatment: Replace apical and basolateral medium with pre-warmed treatment medium containing the PE at the desired concentration (e.g., 1-10 mM sodium caprate). Control inserts receive vehicle only.
- Kinetic Monitoring: Measure TEER at 15, 30, 60, and 120 minutes post-treatment.
- Paracellular Flux Assay (Parallel Inserts): At the time of treatment, add a paracellular tracer (e.g., 100 μM FITC-dextran 4 kDa) to the apical compartment. At 120 minutes, collect 100 μL from the basolateral compartment.
- Quantification: Measure fluorescence (Ex/Em: 492/518 nm). Calculate apparent permeability (Papp) in cm/s: Papp = (dQ/dt) / (A * C₀), where dQ/dt is the flux rate, A is the membrane area, and C₀ is the initial apical tracer concentration.
- Recovery Assessment: Replace treatment medium with fresh culture medium. Monitor TEER recovery at 24 and 48 hours.
3. siRNA-Based Molecular Modulation of TJs siRNA offers a sequence-specific strategy to downregulate the expression of specific TJ proteins, enabling the study of their function and creating sustained but potentially reversible modulation.
3.1. Core Strategy & Delivery Challenges The objective is to silence genes encoding TJ structural components (e.g., CLDN5, OCLN) or regulatory kinases (e.g., PKC isoforms). The primary challenge is the efficient delivery of siRNA across the endothelial cell membrane and avoidance of degradation. This is achieved via nanocarriers.
3.2. Experimental Workflow for siRNA-Mediated TJ Knockdown Diagram 2: siRNA Knockdown Experiment Workflow
3.3. Quantitative Impact of TJ Protein Knockdown Table 2: Functional Outcomes of siRNA-Mediated TJ Protein Knockdown
| Target Gene | Delivery System | Model | Knockdown Efficiency (Protein) | Functional Outcome |
|---|---|---|---|---|
| CLDN5 | Cationic lipid nanoparticles | hCMEC/D3 monolayer | ~70-80% reduction | TEER decrease of ~65%; 4-6 fold increase in mannitol flux. |
| OCLN | Polymeric nanoparticles (PLGA) | Primary mouse BMECs | ~60% reduction | TEER decrease of ~50%; discontinuous junctional staining. |
| ZO-1 (TIP1) | Lentiviral shRNA | Rat BBB in vivo | ~50% reduction | Increased hippocampal delivery of systemically administered antibody. |
3.4. Detailed Protocol: Cationic Lipid-Mediated siRNA Transfection of BBB Monolayers
- siRNA Preparation: Resuspend siRNA targeting gene of interest (e.g., CLDN5) and non-targeting control (NTC) in nuclease-free buffer to 50 μM stock.
- Lipid Complex Formation: For one 24-well Transwell insert, dilute 5 pmol siRNA in 50 μL serum-free medium (Opti-MEM). In a separate tube, dilute 0.5 μL of a cationic lipid transfection reagent (e.g., Lipofectamine RNAiMAX) in 50 μL Opti-MEM. Incubate 5 min at RT. Combine diluted siRNA with diluted lipid, mix gently, and incubate for 20 min at RT to form complexes.
- Cell Treatment: Aspirate medium from both apical and basolateral compartments of the BBB monolayer (TEER >50 Ω·cm²). Add 100 μL of the siRNA-lipid complex mixture to the apical chamber. Add 600 μL of pre-warmed, serum-containing medium to the basolateral chamber.
- Incubation: Incubate cells at 37°C, 5% CO₂ for 4-6 hours.
- Medium Change: Replace the apical and basolateral media with fresh, complete endothelial cell medium.
- Analysis Timeline:
- 48-72 hours post-transfection: Assess knockdown by qRT-PCR (mRNA) and Western Blot (protein).
- 72-96 hours post-transfection: Perform functional assays (TEER, paracellular tracer flux, immunofluorescence for TJ protein continuity).
4. The Scientist's Toolkit: Key Research Reagent Solutions Table 3: Essential Materials for TJ Modulation Research
| Item | Function & Rationale |
|---|---|
| hCMEC/D3 Cell Line | Immortalized human cerebral microvascular endothelial cells; the standard in vitro BBB model expressing key TJ proteins and transporters. |
| Collagen IV & Fibronectin | Essential extracellular matrix proteins for coating culture surfaces to promote endothelial cell adhesion, spreading, and TJ formation. |
| Transwell Permeable Supports | Polyester or polycarbonate membrane inserts enabling the establishment of polarized cell monolayers and separate access to apical/basolateral compartments for TEER and flux measurements. |
| Epithelial Volt-Ohm Meter (e.g., EVOM2) | Instrument for accurate, non-destructive measurement of Transepithelial/Transendothelial Electrical Resistance (TEER) to monitor barrier integrity. |
| Paracellular Tracers (FITC-Dextran 4kDa, Na-Fluorescein) | Fluorescent, membrane-impermeable molecules used to quantify paracellular permeability. Molecular weight choice is critical. |
| Claudin-5, Occludin, ZO-1 Antibodies | Validated antibodies for detection of TJ proteins via Western Blot (WB) and Immunofluorescence (IF). Critical for knockdown validation. |
| Cationic Lipid Transfection Reagent (e.g., RNAiMAX) | Forms positively charged complexes with negatively charged siRNA, facilitating cellular uptake and endosomal release in endothelial cells. |
| Validated siRNA Sequences (CLDN5, OCLN) | Pre-designed, efficacy-tested siRNA pools/duplexes to ensure reproducible and specific knockdown of target TJ genes. |
| qRT-PCR Reagents (TaqMan probes) | For precise quantification of mRNA knockdown levels relative to housekeeping genes (e.g., GAPDH, HPRT1). |
Research into the blood-brain barrier (BBB) has historically focused on its formidable tight junction network, which severely restricts the paracellular diffusion of therapeutics. This article frames the exploration of Receptor-Mediated Transcytosis (RMT) and Adsorptive-Mediated Transcytosis (AMT) within the broader thesis that understanding and co-opting endogenous transcytosis pathways is the most viable strategy for achieving significant, targeted drug delivery across the BBB. While tight junctions define the physical barrier, transcytosis mechanisms represent the physiological "gates" that can be harnessed for CNS drug delivery.
Core Mechanisms: RMT vs. AMT
Receptor-Mediated Transcytosis (RMT) is a saturable, high-affinity process where ligands bind specifically to receptors concentrated on the luminal membrane of brain endothelial cells. The ligand-receptor complex is internalized via clathrin-coated pits, traffics through endosomal compartments, and is exocytosed at the abluminal side. Key characteristics include specificity, potential for competition, and generally lower transport capacity compared to AMT.
Adsorptive-Mediated Transcytosis (AMT) is a charge-driven, non-saturable (at physiological concentrations) process where cationic molecules (e.g., proteins, peptides, or nanocarriers) interact electrostatically with anionic microdomains (e.g., heparan sulfate proteoglycans) on the endothelial cell surface. This triggers bulk fluid-phase uptake, often via macropinocytosis, followed by vesicular transport and release. It offers higher transport capacity but lower specificity and potential for peripheral toxicity.
Table 1: Comparative Analysis of RMT and AMT Mechanisms
| Characteristic | Receptor-Mediated Transcytosis (RMT) | Adsorptive-Mediated Transcytosis (AMT) |
|---|---|---|
| Trigger | Specific ligand-receptor binding | Non-specific electrostatic interaction |
| Primary Receptors/Targets | Transferrin Receptor (TfR), Insulin Receptor, LDL Receptor, etc. | Anionic cell surface proteoglycans (e.g., heparan sulfate) |
| Affinity | High (nM range) | Low (µM-mM range) |
| Saturability | Yes | No (under typical dosing) |
| Transport Capacity | Lower (~ng/g brain tissue) | Higher (~µg/g brain tissue) |
| Specificity | High (targets specific cell populations) | Low (targets any anionic surface) |
| Key Limitation | Competition with endogenous ligands, receptor downregulation | Peripheral toxicity, lack of CNS specificity |
| Typical Cargo | Recombinant proteins, monoclonal antibodies, ligand-conjugated NPs | Cationic peptides (e.g., TAT), cationic polymers, cationic liposomes |
Key Experimental Protocols
Protocol:In VitroTranscytosis Assay Using a BBB Model
Objective: To quantify the apparent permeability (Papp) of a candidate RMT/AMT drug conjugate across a cellular BBB model.
- Model Setup: Use a transwell system with human brain microvascular endothelial cells (hBMECs) cultured on a collagen-coated polyester membrane (pore size 0.4 µm, area 1.12 cm²). Confirm monolayer integrity via TEER measurement (>150 Ω·cm²) and sodium fluorescein permeability.
- Test Article Preparation: Prepare solutions of the fluorescently-labeled (e.g., DyLight 680) candidate molecule (conjugate) and an appropriate control (e.g., free ligand, isotype antibody) in transport buffer (HBSS with 25mM HEPES, pH 7.4).
- Assay Execution: Replace the apical (donor) compartment medium with 0.5 mL of test article (typical concentration: 1-10 µg/mL). Add 1.5 mL of fresh buffer to the basolateral (acceptor) compartment. Incubate at 37°C with gentle orbital shaking.
- Sampling: At defined time points (e.g., 30, 60, 90, 120 min), collect 100 µL from the basolateral compartment and replace with fresh buffer.
- Quantification: Measure fluorescence in samples using a plate reader. Calculate Papp (cm/s) using the formula:
Papp = (dQ/dt) / (A * C0), where dQ/dt is the steady-state flux rate (mol/s), A is the membrane area (cm²), and C0 is the initial donor concentration (mol/cm³). - Inhibition/Competition: For RMT specificity tests, co-incubate with a 10-100x molar excess of unlabeled ligand. For AMT, pre-treat cells with heparin sulfate (10-100 µg/mL) to block anionic sites.
Protocol:In VivoBrain Uptake Measurement (Brain-to-Plasma Ratio, Kp)
Objective: To determine the brain pharmacokinetics and uptake efficiency of a candidate molecule post-systemic administration.
- Dosing: Administer a bolus intravenous injection of the test article (radiolabeled, e.g., ¹²⁵I, or fluorescently labeled) to rodents (e.g., mice). Use a minimum of n=5 animals per group and time point.
- Terminal Sampling: At predetermined time points (e.g., 5, 15, 30, 60, 120 min), collect blood via cardiac puncture into heparinized tubes under anesthesia. Immediately perfuse the animal transcardially with 20 mL of ice-cold PBS to clear the cerebral vasculature.
- Tissue Processing: Harvest the whole brain (or specific regions). Weigh the brain accurately. Centrifuge blood to obtain plasma.
- Quantification:
- For radiolabels: Measure radioactivity in homogenized brain and plasma using a gamma counter.
- For fluorescent labels: Quantify dye concentration in homogenates using a validated extraction method and plate reader/LC-MS.
- Data Analysis: Calculate the brain-to-plasma ratio
Kp (mL/g) = (Total brain concentration) / (Plasma concentration). The brain uptake index (BUI%) can be calculated relative to a co-injected vascular reference (e.g., [¹⁴C]-sucrose).
Visualization of Pathways and Workflows
Title: Receptor-Mediated Transcytosis (RMT) Pathway
Title: Drug Delivery Candidate Development Workflow
The Scientist's Toolkit: Key Research Reagent Solutions
Table 2: Essential Research Reagents and Materials for RMT/AMT Studies
| Reagent/Material | Supplier Examples | Primary Function in Research |
|---|---|---|
| Human Brain Microvascular Endothelial Cells (hBMECs) | Cell Systems, ScienCell, Thermo Fisher | Gold-standard primary cells for building physiologically relevant in vitro BBB models. |
| Transwell Permeable Supports | Corning, Greiner Bio-One | Polyester or polycarbonate membrane inserts for culturing endothelial cell monolayers and performing transcytosis assays. |
| Transferrin Receptor (TfR) Monoclonal Antibody (e.g., OX26) | Bio-Rad, R&D Systems, Abcam | A classic anti-rodent TfR antibody used for RMT targeting in preclinical models. |
| Cationic Cell-Penetrating Peptides (CPPs) | Bachem, AnaSpec, Genscript | TAT, penetratin, or SynB vectors used to induce AMT or to functionalize nanocarriers. |
| Heparin, Heparan Sulfate | Sigma-Aldrich, Iduron | Used as competitive inhibitors to confirm charge-based AMT mechanisms in both in vitro and in vivo experiments. |
| DyLight or Alexa Fluor NHS Esters | Thermo Fisher, Vector Laboratories | High-quantum-yield fluorescent dyes for covalent labeling of proteins/peptides to track transcytosis visually and quantitatively. |
| ³H-Sucrose or ¹⁴C-Inulin | American Radiolabeled Chemicals | Radiolabeled vascular space markers used in in vivo brain uptake studies to correct for blood contamination in brain tissue. |
| TEER (Transepithelial Electrical Resistance) Meter | World Precision Instruments, Millipore | Instrument to non-invasively measure the integrity and tight junction formation of BBB cell monolayers in real-time. |
| Lipofectamine 3000 or similar | Thermo Fisher | Transfection reagent for modulating receptor expression (knockdown/overexpression) in endothelial cells to study pathway specificity. |
The blood-brain barrier (BBB), characterized by tightly sealed endothelial cells connected via complexes like claudins, occludins, and ZO proteins, represents the paramount challenge for CNS drug delivery. Research into modulating BBB tight junctions and harnessing endogenous transport mechanisms (e.g., carrier-mediated transport, receptor-mediated transcytosis) is critical. This whitepaper details three synergistic, non-invasive technologies—Focused Ultrasound (FUS), Nanoparticle Carriers, and Cell-Penetrating Peptides (CPPs)—that offer precise, transient, and targeted strategies for circumventing the BBB, thereby advancing therapeutic intervention for neurological disorders.
Technology Deep Dive & Quantitative Data
Focused Ultrasound (FUS) with Microbubbles
FUS, when coupled with intravascular microbubble contrast agents, induces localized, reversible BBB opening via stable inertial cavitation. This mechanically disrupts tight junctions and stimulates transcellular vesicular transport.
Table 1: Quantitative Parameters for FUS-Induced BBB Opening
| Parameter | Typical Range | Impact & Notes |
|---|---|---|
| Frequency | 0.25 - 1.5 MHz | Lower frequencies increase focal zone but require more power. |
| Peak Negative Pressure | 0.3 - 0.8 MPa | Pressure threshold for safe, reversible opening is ~0.45 MPa in mice. |
| Microbubble Diameter | 1 - 2 μm | Must match clinical ultrasound contrast agents (e.g., Definity). |
| Microbubble Dose | 1e7 - 1e8 bubbles/kg | Optimized for capillary density and sonicated volume. |
| Sonication Duration | 20 - 120 ms per burst | Pulsed waveforms (e.g., 10 Hz PRF, 10 ms bursts) minimize heating. |
| BBB Closure Time | 4 - 24 hours | Depends on pressure; tight junctions typically reseal within 6h. |
| Increase in Penetration (Model Drug) | 2 - 10 fold (e.g., Doxorubicin) | Measured by tissue concentration vs. control. |
Nanoparticle Carriers
Engineered nanoparticles (NPs) protect payloads and exploit both passive (after FUS) and active targeting mechanisms for enhanced brain delivery.
Table 2: Key Characteristics of Nanoparticle Systems for BBB Crossing
| Nanoparticle Type | Typical Size (nm) | Surface Modification | Primary Transport Mechanism | Payload Increase (vs. free drug) |
|---|---|---|---|---|
| Poly(lactic-co-glycolic acid) (PLGA) | 80-180 | PEG, Tf/TfR mAb | Receptor-Mediated Transcytosis (RMT) | 3-5x (with targeting) |
| Liposomes | 70-120 | PEG, GLUT1 ligand | RMT / Adsorptive-Mediated Transcytosis | 4-6x |
| Gold Nanoparticles | 15-40 | PEG, Anti-BACE1 | RMT / Passive diffusion post-FUS | N/A (often diagnostic) |
| Dendrimers (PAMAM) | 5-10 | PEG, Angiopep-2 | Adsorptive-Mediated Transcytosis | 2-4x |
| Solid Lipid Nanoparticles (SLNs) | 100-200 | Poloxamer 188 | Inhibition of Efflux Pumps (P-gp) | 2-3x |
Cell-Penetrating Peptides (CPPs)
CPPs are short cationic/amphipathic peptides (typically 5-30 amino acids) that facilitate cellular uptake and can shuttle cargo across the BBB, often via adsorptive-mediated transcytosis.
Table 3: Efficacy Metrics of Prominent CPPs for BBB Translocation
| CPP Name | Sequence (Common) | Conjugation Method | Apparent Permeability (Papp) *10^-6 cm/s) | Primary Mechanism |
|---|---|---|---|---|
| TAT (HIV-1) | GRKKRRQRRRPQ | Covalent (chem/genic) | ~8.5 | Electrostatic interaction, direct transduction |
| Penetratin | RQIKIWFQNRRMKWKK | Covalent | ~7.2 | Lipid raft-dependent endocytosis |
| SynB1 | RGGRLSYSRRRFSTSTGR | Covalent or complex | ~9.1 | Macropinocytosis |
| Angiopep-2 | TFFYGGSRGKRNNFKTEEY | Covalent (to NP) | ~12.0 (when targeted) | LRP1 Receptor-mediated transcytosis |
Experimental Protocols
Protocol: FUS-Mediated BBB Opening in a Rodent Model
Objective: To transiently and locally open the BBB for subsequent drug or nanoparticle delivery. Materials: MRI-guided FUS system (e.g., RK-100, FUS Instruments), preclinical MRI scanner, Definity microbubbles, sterotaxic frame, Evans Blue dye or MRI contrast agent (e.g., Gd-DTPA). Procedure:
- Animal Preparation: Anesthetize mouse/rat and secure in sterotaxic frame. Maintain body temperature.
- Microbubble Administration: Intravenously inject a bolus of Definity microbubbles (diluted in saline, 1e7 bubbles/kg) via tail vein.
- Targeting: Use T2-weighted MRI to identify precise brain target (e.g., hippocampus). Coregister with FUS transducer coordinates.
- Sonication: Immediately post-injection, initiate sonication at target using pre-calibrated parameters (e.g., 0.5 MHz, 0.55 MPa, 10 ms bursts, 1 Hz pulse repetition frequency for 60s).
- Verification of Opening: 5 minutes post-sonication, inject Evans Blue dye (2% in saline, 4 ml/kg) or Gd-DTPA. For Evans Blue, sacrifice animal after 1h, perfuse with PBS, extract brain, and image/quantify dye extravasation. For Gd-DTPA, perform T1-weighted MRI to quantify signal enhancement.
- Tissue Analysis: Process brain for histology (H&E, claudin-5 IHC) to confirm reversible TJ disruption and absence of hemorrhage.
Protocol: Evaluating Nanoparticle Brain Delivery with CPP Coating
Objective: To compare brain accumulation of PLGA nanoparticles with and without CPP (e.g., TAT) surface functionalization. Materials: PLGA, PEG-b-PLGA, maleimide-PEG-PLGA, TAT peptide (Cys-modified), Cy5.5 dye, dialysis tubing, dynamic light scattering (DLS), confocal microscope. Procedure:
- NP Fabrication: Prepare Cy5.5-loaded PLGA NPs using emulsion-solvent evaporation. For TAT-NPs, incorporate maleimide-PEG-PLGA into polymer mix.
- CPP Conjugation: React thiol-containing TAT peptide with maleimide groups on purified NPs in PBS (pH 7.4) for 2h at RT. Purify via centrifugation.
- Characterization: Measure size, PDI, and zeta potential via DLS. Confirm conjugation efficiency via fluorescence assay or HPLC.
- In Vivo Administration: Inject mice (n=5/group) intravenously with either plain NPs or TAT-NPs (equivalent Cy5.5 dose).
- Quantification: At 2h and 24h post-injection, perfuse animals, harvest brains and major organs. Homogenize and measure Cy5.5 fluorescence using a plate reader. Calculate % injected dose per gram (%ID/g) of tissue.
- Imaging: Fix brains, section, and image using confocal microscopy to visualize NP distribution relative to blood vessels (CD31 stain).
Visualization: Diagrams & Pathways
Diagram 1 Title: Signaling Pathways Activated by FUS for BBB Opening
Diagram 2 Title: Integrated Experimental Workflow for FUS+NP-CPP Delivery
The Scientist's Toolkit: Key Research Reagent Solutions
Table 4: Essential Materials for BBB Modulation Experiments
| Item | Example Product / Specification | Function in Research |
|---|---|---|
| Preclinical FUS System | RK-50 or VisualSonics Vevo FUS | Integrated with imaging for precise, image-guided BBB sonication. |
| Clinical-Grade Microbubbles | Definity (Perflutren Lipid Microsphere) | Ultrasound contrast agent; cavitation nuclei for FUS-mediated BBB disruption. |
| BBB Integrity Marker | Evans Blue Dye (2% solution) or Gd-DTPA (Magnevist) | Visual and quantitative assessment of BBB permeability. |
| TJ Protein Antibody | Anti-Claudin-5 (Invitrogen 35-2500) | Immunohistochemistry to visualize tight junction morphology pre/post treatment. |
| PLGA for NP Formulation | RESOMER RG 503H (50:50, 24-38 kDa) | Biodegradable polymer core for nanoparticle fabrication. |
| Heterobifunctional PEG Linker | MAL-PEG-NHS (3.4 kDa, Creative PEGWorks) | Conjugates thiol-containing CPPs to amine-containing nanoparticles. |
| Model CPP | TAT (Cys-modified, >95% pure, AnaSpec) | Positive control for peptide-mediated transduction and BBB translocation studies. |
| In Vivo Imaging Agent | Cy5.5 NHS Ester (Lumiprobe) | Near-infrared fluorophore for conjugating to nanoparticles for in vivo tracking. |
| LRP1 Receptor Ligand | Recombinant Angiopep-2 (Tocris) | For targeting nanoparticles to the LRP1-mediated transcytosis pathway. |
| Transwell Assay System | Corning HTS Transwell-96, 0.4 μm pore | In vitro model of the BBB using bEnd.3 or hCMEC/D3 cell monolayers. |
Navigating Experimental Hurdles: Reproducibility, Leakiness, and Functional Assay Pitfalls
Within blood-brain barrier (BBB) tight junction and transport mechanisms research, transepithelial/transendothelial electrical resistance (TEER) is the gold-standard, non-invasive metric for quantifying barrier integrity. Accurate TEER measurement is paramount for studies investigating tight junction modulation, drug permeability, and disease modeling. However, several common artifacts can compromise data integrity, leading to erroneous conclusions. This technical guide details the critical artifacts arising from electrode calibration, temperature fluctuations, and media composition, framed within the context of BBB research.
Electrode Calibration Artifacts
The electrode-solution interface is a primary source of measurement error. Uncalibrated or poorly maintained electrodes introduce significant resistance in series with the cellular monolayer, inflating TEER values.
Experimental Protocol: Electrode Calibration and Validation
- Equipment: Voltohmmeter (e.g., EVOM2, CellZScope), chopstick or cup-style Ag/AgCl electrodes.
- Solution Preparation: Use a standardized saline solution (e.g., 0.9% NaCl or DPBS) at the experimental temperature.
- Blank Measurement: Immerse electrode tips in the solution at a fixed distance matching experimental geometry. Record the resistance (R_blank). Reproducible measurements (typically < 100 Ω) indicate stable electrodes.
- Calibration: If using a meter with calibration, follow manufacturer protocol using the specific solution. Null the background resistance.
- Validation: Measure the resistance of a cell-free insert under experimental conditions. The value should be stable and nearly equivalent to R_blank.
Table 1: Impact of Electrode State on Measured Resistance
| Electrode Condition | Background Resistance (Ω) | Apparent TEER (Ω·cm²) | Corrected TEER (Ω·cm²) | Artifact Description |
|---|---|---|---|---|
| New, Properly Calibrated | 20 ± 5 | 150 ± 10 | 130 ± 10 | Baseline. |
| Contaminated (Protein) | 85 ± 15 | 215 ± 15 | 130 ± 10 | Coating increases interfacial resistance. |
| Chloride Layer Depleted | 150 ± 50 | 280 ± 50 | 130 ± 10 | Unstable, drifting readings. |
| Misaligned Tips | Variable (High) | Highly Variable | Incalculable | Asymmetric current flow. |
Temperature-Induced Artifacts
Ionic conductivity of media is highly temperature-dependent. TEER measurements are not typically temperature-compensated, leading to systematic errors.
Experimental Protocol: Controlling for Temperature Effects
- Environmental Control: Conduct all TEER measurements in a temperature-controlled environment (e.g., incubator, heated chamber).
- Equilibration: Prior to measurement, allow plates and measurement apparatus to equilibrate to the target temperature (e.g., 37°C) for at least 30 minutes.
- Calibration at Temperature: Perform electrode calibration in solution pre-warmed to the experimental temperature.
- Consistency: Standardize the duration plates are outside the incubator for measurement (e.g., < 5 minutes per plate).
Table 2: Effect of Temperature on Measured TEER in BBB Models
| Temperature (°C) | Media Conductivity (Relative to 37°C) | Apparent TEER (Relative Change) | Physiological Relevance |
|---|---|---|---|
| 25 | ~65% | +35% | Room temp measurement artifact. |
| 37 | 100% | Baseline | Physiologically relevant. |
| 40 | ~110% | -9% | Hyperthermia/fever model. |
Media Composition Effects
Media ionic strength, bicarbonate buffering, and serum components directly impact conductivity and can induce cellular physiological responses.
Experimental Protocol: Standardizing Media for TEER
- Pre-measurement Protocol: Replace growth medium with a standardized, serum-free, buffered physiological salt solution (e.g., HEPES-buffered HBSS) 30-60 minutes pre-measurement.
- pH Stabilization: Use a non-CO₂-dependent buffer (e.g., HEPES) if measuring outside a CO₂ incubator to prevent alkalinization.
- Control Formulation: For drug studies, ensure the vehicle control contains identical media components as the treatment.
- Documentation: Precisely record the exact media composition during measurement for all experiments.
Table 3: Common Media Components and Their Impact on TEER Measurement
| Component | Typical Concentration | Effect on Conductivity/Apparent TEER | Notes for BBB Research |
|---|---|---|---|
| NaCl | 120-150 mM | Baseline conductor. | Varies osmolarity. |
| Serum (FBS) | 0-10% | Can increase or decrease true TEER via signaling. | Source of variability; starve before assay. |
| HEPES Buffer | 10-20 mM | Minimal direct effect. | Essential for stable pH outside incubator. |
| NaHCO₃ | 25 mM | Alters conductivity. Requires CO₂. | Use only in incubator. |
| Drug Vehicles (DMSO) | <0.5% | Can alter monolayer integrity at high [ ]. | Use matched vehicle controls. |
The Scientist's Toolkit: Key Reagents for Robust TEER in BBB Studies
| Item | Function & Rationale |
|---|---|
| HEPES-Buffered HBSS | Standardized, serum-free measurement solution. Provides stable pH and ionic strength outside a CO₂ environment. |
| Ag/AgCl Electrodes | Reversible, non-polarizing electrodes. Minimize junction potential and drift during measurement. |
| 0.9% NaCl Calibration Solution | For validating and nulling electrode background resistance in a consistent solution. |
| Cell Culture Inserts (e.g., PET, 0.4 µm) | Provide a porous membrane support for forming a polarized BBB endothelial monolayer. |
| Voltohmmeter with AC | Applies a low, alternating current to prevent electrode polarization and cell membrane charging. |
| Temperature-Controlled Chamber | Maintains physiological 37°C during measurements to prevent conductivity artifacts. |
Experimental Workflow for Mitigating TEER Artifacts in BBB Studies
Title: TEER Measurement Workflow with Artifact Mitigation
Integrated Impact of Artifacts on BBB Tight Junction Research
Title: How TEER Artifacts Compromise BBB Research Outcomes
In BBB research, where TEER serves as a critical functional readout for tight junction integrity, rigorous control of measurement artifacts is non-negotiable. Systematic errors from uncalibrated electrodes, temperature shifts, and variable media composition can obscure true biological effects, leading to incorrect conclusions about transport mechanisms, drug effects, or disease pathology. Adherence to standardized protocols for electrode maintenance, environmental control, and media formulation, as outlined in this guide, is essential for generating reliable, reproducible TEER data that robustly supports research on the blood-brain barrier.
Within the broader thesis on the Blood-Brain Barrier (BBB), the integrity of tight junctions (TJs) is paramount for proper neurovascular function and transport regulation. In vitro modeling of this structure is fraught with "leakiness"—inconsistent and inadequate TJ formation leading to high, non-physiological paracellular permeability. This guide details core protocols designed to ensure consistent, high-quality TJ networks in primary and induced pluripotent stem cell (iPSC)-derived brain endothelial cell (BEC) models, critical for valid mechanistic and translational research.
Core Quantitative Data: Permeability and Resistance Benchmarks
The efficacy of any protocol is measured by key quantitative endpoints. The following tables summarize target values for common BBB models under optimal conditions.
Table 1: Target Transendothelial Electrical Resistance (TEER) Values Across Models
| Cell Model | TEER (Ω×cm²) | Measurement Method | Key Citation (Recent) |
|---|---|---|---|
| Primary Bovine BMECs | 800 - 1200 | EVOM2 / Chopstick | Siddharthan et al., 2022 |
| Primary Rat BMECs | 300 - 600 | CellZscope / Endohm | Stone et al., 2023 |
| iPSC-derived BECs (Co-culture) | 1500 - 5000 | CellZscope | Vatine et al., 2023 |
| hCMEC/D3 (Standard) | 30 - 100 | EVOM2 | Weksler et al., 2022 |
Table 2: Target Apparent Permeability (Papp) of Integrity Markers
| Tracer Molecule | MW (Da) | Target Papp (cm/s) | Acceptable Range |
|---|---|---|---|
| Sodium Fluorescein (NaF) | 376 | ≤ 2.0 × 10⁻⁶ | 1.0 - 3.0 × 10⁻⁶ |
| Lucifer Yellow (LY) | 457 | ≤ 1.5 × 10⁻⁶ | 0.5 - 2.0 × 10⁻⁶ |
| FITC-Dextran (4kDa) | 4000 | ≤ 0.5 × 10⁻⁶ | 0.1 - 1.0 × 10⁻⁶ |
| FITC-Dextran (10kDa) | 10000 | ≤ 0.1 × 10⁻⁶ | 0.01 - 0.5 × 10⁻⁶ |
Detailed Experimental Protocols
Protocol A: iPSC-Derived BEC Differentiation and Seeding for High TEER
Objective: Generate a confluent monolayer of iPSC-BECs with consistent, high TJ expression. Materials: iPSC line, Defined media (STEMdiff, E6), Human Endothelial-SFM, Retinoic Acid (RA), CHIR99021, Rock inhibitor (Y-27632), Collagen IV/ Fibronectin-coated transwell inserts.
Methodology:
- Maintenance: Culture iPSCs in feeder-free conditions. Passage with gentle dissociation reagent.
- Mesoderm Induction (Days 0-2): Seed single-cell iPSCs at 15,000 cells/cm² in E6 medium supplemented with 6 µM CHIR99021. Change medium daily.
- Endothelial Specification (Days 2-6): Switch to Human Endothelial-SFM supplemented with 100 ng/mL bFGF and 50 ng/mL VEGF. Change medium every other day.
- CD34+ Cell Isolation (Day 6): Dissociate cells with Accutase. Islect CD34+ progenitor cells using magnetic-activated cell sorting (MACS).
- BBB Maturation (Days 6-8): Seed isolated CD34+ cells at 150,000 cells/cm² on coated transwell filters in Endothelial-SFM with 20 ng/mL bFGF, 50 ng/mL VEGF, and 1 µM RA. Include 10 µM Y-27632 for the first 24h.
- Maintenance (Day 8+): Change to Endothelial-SFM with 1 µM RA only. Culture for 2-4 days until TEER plateaus. Monitor TEER daily.
Key for Success: Use fresh RA aliquots, avoid over-confluency at seeding, and ensure uniform coating.
Protocol B: Co-culture Induction for TJ Stabilization
Objective: Utilize astrocyte-conditioned medium (ACM) or direct contact with pericytes to enhance and maintain TJ integrity.
Methodology for ACM Preparation:
- Culture human astrocytes to 80% confluency in T75 flasks.
- Wash cells and replace medium with fresh, serum-free Endothelial-SFM.
- Condition medium for 24 hours.
- Collect ACM, centrifuge (2000g, 10 min), filter sterilize (0.22 µm), and store at -80°C.
- Application: Replace 50% of the BEC basolateral medium with ACM every 24 hours during the maturation phase (Protocol A, Step 6).
Methodology for Direct Contact Co-culture:
- Seed primary human brain pericytes on the underside of a collagen-coated transwell filter (pore size 0.4 µm) at 20,000 cells/filter.
- Allow pericytes to adhere for 4-6 hours.
- Invert the insert and place in a 24-well plate with medium to keep the pericytes hydrated.
- The following day, seed BECs on the apical (top) side of the same filter following Protocol A, Step 5.
- Culture with the pericyte layer in physical contact with the basolateral side of the membrane.
Signaling Pathways Governing TJ Assembly
The Scientist's Toolkit: Key Research Reagent Solutions
Table 3: Essential Materials for Managing TJ Leakiness
| Item / Reagent | Supplier Examples | Function in Protocol |
|---|---|---|
| Retinoic Acid (RA) | Sigma-Aldrich, Tocris | Critical nuclear hormone receptor agonist that upregulates TJ protein expression and enhances barrier properties. |
| CHIR99021 | Tocris, Selleckchem | Potent, selective GSK-3 inhibitor that activates Wnt/β-catenin signaling, driving endothelial specification. |
| ROCK Inhibitor (Y-27632) | STEMCELL Tech, Abcam | Improves survival and attachment of seeded primary or iPSC-derived endothelial cells. |
| Collagen IV & Fibronectin | Corning, Sigma-Aldrich | ECM coating components that provide essential adhesive cues for BMEC polarization and TJ assembly. |
| Astrocyte-Conditioned Medium (ACM) | ScienCell, Self-prepared | Contains soluble factors (e.g., Ang-1, GDNF) that stabilize the BBB phenotype and support high TEER. |
| TEER Measurement System | World Precision Inst. (EVOM2), nanoAnalytics (CellZscope) | Gold-standard, non-destructive quantitative assessment of monolayer integrity and TJ functionality. |
| Fluorescent Tracers (NaF, LY, FITC-Dextran) | Thermo Fisher, Sigma-Aldrich | Used in permeability assays to quantitatively measure paracellular "leak." |
| Anti-CLDN5 / OCLN Antibodies | Invitrogen, Abcam | Essential for immunocytochemistry or Western blot validation of TJ protein localization and expression. |
| Human Endothelial-SFM | Thermo Fisher | Serum-free, defined medium optimized for growth of primary and iPSC-derived endothelial cells. |
Within the broader thesis on Blood-Brain Barrier (BBB) tight junction (TJ) integrity and orchestrated transport mechanisms, a fundamental technical challenge is the unambiguous discrimination of solute pathways. Accurately attributing measured flux to either paracellular (between cells, governed by TJs) or transcellular (through cells, via passive diffusion or carrier-mediated transport) routes is critical for evaluating drug candidates and modeling disease states. This guide details the experimental paradigm for validating specific transport routes.
Conceptual Framework and Quantitative Markers
The differentiation hinges on measuring flux under controlled conditions and using specific pharmacological or molecular probes. Key quantitative indices are used.
Table 1: Core Quantitative Indices for Pathway Analysis
| Index | Formula | Interpretation | Paracellular Indicator | Transcellular Indicator |
|---|---|---|---|---|
| Apparent Permeability (Papp) | Papp = (dQ/dt) / (A * C0) | Measures overall flux rate. | Non-specific; increases if TJs are disrupted. | Non-specific; increases with lipophilicity or active transport. |
| Permeability Ratio (Pmanitol / Psucrose) | Papp (Mannitol, 182 Da) / Papp (Sucrose, 342 Da) | Normalizes for monolayer integrity. | ~1.0-1.5 suggests intact, size-selective paracellular pore. | Not directly applicable. |
| Efflux Ratio (ER) | Papp (B-A) / Papp (A-B) | For polarized transport systems (e.g., P-gp). | ER ~1 (symmetric flux). | ER >> 1 indicates active efflux (transcellular). ER << 1 indicates active influx. |
| Activation Energy (Ea) | Arrhenius plot of Papp vs. 1/T | Mechanistic insight into transport. | Low Ea (< 5 kcal/mol) suggests aqueous pore diffusion. | High Ea (> 10 kcal/mol) suggests membrane-limited diffusion or carrier-mediated process. |
Core Experimental Protocols
Protocol A: Pharmacological Inhibition and Modulation
- Objective: To dissect transcellular active transport from passive diffusion and paracellular leak.
- Methodology:
- Culture BBB models (e.g., hCMEC/D3 monolayers, induced pluripotent stem cell-derived BMECs) on Transwell filters until mature TJs form (TEER > 150 Ω·cm²).
- Baseline Transport: Measure Papp of probe compound in both apical-to-basolateral (A-B) and basolateral-to-apical (B-A) directions in standard buffer (e.g., HBSS/HEPES).
- Inhibition: Repeat transport assay in the presence of specific inhibitors:
- For Active Efflux: 10-20 µM Ko143 (BCRP inhibitor), 2-10 µM Elacridar or 50-100 µM Verapamil (P-gp inhibitors).
- For Active Influx: Excess unlabeled substrate for transporters like LAT1 or GLUT1.
- For Paracellular Modulation: 1-4 mM Ca²⁺ chelator (EGTA) to disrupt Ca²⁺-dependent TJs, or hyperosmolar mannitol (e.g., 0.5 M) to force TJ opening.
- Analysis: Calculate ER with/without inhibitor. A significant decrease in ER confirms involvement of that specific efflux transporter. Increased flux with EGTA confirms a paracellular component.
Protocol B: Activation Energy Determination
- Objective: To differentiate passive transcellular diffusion from paracellular diffusion.
- Methodology:
- Set up temperature-controlled incubation chambers at a minimum of four temperatures (e.g., 4°C, 15°C, 25°C, 37°C). 4°C arrests most active processes and fluid-phase endocytosis.
- Pre-equilibrate buffers and cell monolayers at each target temperature for 30-60 min.
- Perform transport assays (A-B) for lipophilic (e.g., propranolol) and hydrophilic (e.g., mannitol) probes at each temperature.
- Plot ln(Papp) against 1/T (in Kelvin). Calculate Ea from the slope (-Ea/R).
Protocol C: siRNA/CRISPR-Cas9 Knockdown of Specific Transporters
- Objective: To conclusively validate the role of a specific transporter in transcellular flux.
- Methodology:
- Design sgRNAs (for Cas9) or siRNAs targeting human transporters (e.g., MDR1 (P-gp), BCRP, SLC7A5 (LAT1)).
- Transfert BBB model cells using optimized methods (e.g., nucleofection).
- After 48-72 hours, validate knockdown via qPCR and/or western blot.
- Perform bidirectional transport assays with the putative substrate. Loss of polarized transport (ER moving towards 1) confirms the targeted transporter's specific role.
The Scientist's Toolkit: Key Research Reagent Solutions
Table 2: Essential Reagents for Transport Pathway Differentiation
| Reagent / Material | Function & Application |
|---|---|
| hCMEC/D3 Cell Line | A well-characterized immortalized human brain endothelial cell line for modeling BBB properties. |
| Transwell Permeable Supports (polycarbonate, 0.4 µm pore, 12-well) | Standardized platform for growing permeable cell monolayers and conducting flux assays. |
| Millicell ERS-2 Voltohmmeter | For monitoring Transepithelial/Transendothelial Electrical Resistance (TEER) as a real-time, non-destructive measure of TJ integrity. |
| Fluorescent/Radiolabeled Paracellular Probes (e.g., [14C]-Sucrose, [3H]-Mannitol, NaF, FITC-Dextrans) | Inert, hydrophilic markers used to quantify baseline paracellular permeability and size selectivity. |
| Specific Pharmacological Inhibitors (Ko143, Elacridar, Verapamil, Rifampicin) | Chemical tools to block specific ATP-binding cassette (ABC) efflux transporters (P-gp, BCRP). |
| EGTA (Ethylene glycol-bis(β-aminoethyl ether)-N,N,N',N'-tetraacetic acid) | Calcium chelator used to experimentally and reversibly open calcium-dependent tight junctions, validating paracellular route contribution. |
| LC-MS/MS (Liquid Chromatography Tandem Mass Spectrometry) | Gold-standard analytical method for quantifying unlabeled probe and drug concentrations in transport samples with high sensitivity and specificity. |
Visualization of Experimental and Conceptual Workflows
Title: Decision Logic for Differentiating Transport Pathways
Title: Schematic of Paracellular vs. Transcellular Transport Routes
The blood-brain barrier (BBB), characterized by its complex tight junction network and selective transport mechanisms, remains a formidable challenge for therapeutic delivery. Research into enhancing drug penetration increasingly focuses on exploiting endogenous receptor-mediated transcytosis (RMT) pathways. This technical guide addresses the critical experimental parameters—ligand density, incubation conditions, and endosomal fate—that dictate the success and accuracy of in vitro transcytosis assays. These assays are fundamental to validating novel BBB-shuttles and understanding transport kinetics within the broader thesis of modulating tight junction integrity and paracellular vs. transcellular transport.
Table 1: Impact of Ligand Density on Apparent Permeability (Papp)
| Ligand (Target Receptor) | Substrate (e.g., Nanoparticle) | Ligand Density (molecules/µm²) | Apparent Permeability (Papp) x10⁻⁶ cm/s | Key Finding |
|---|---|---|---|---|
| Anti-Transferrin Receptor (TfR) mAb | IgG | ~40 | 2.5 ± 0.3 | Optimal transcytosis |
| Anti-Transferrin Receptor (TfR) mAb | IgG | ~120 | 1.1 ± 0.2 | High density induces lysosomal trapping |
| RVG peptide (nAChR) | Liposome | ~500 | 8.7 ± 1.5 | Peak permeability |
| RVG peptide (nAChR) | Liposome | ~2000 | 3.2 ± 0.8 | Aggregation & reduced transport |
| Angiopep-2 (LRP1) | Protein | N/A (solution) | 25.4 ± 4.1 | Benchmark for peptide shuttles |
Table 2: Incubation Condition Variables and Outcomes
| Parameter | Typical Range Tested | Optimal for RMT | Effect on Lysosomal Degradation |
|---|---|---|---|
| Temperature | 4°C, 37°C | 37°C | 4°C blocks all endocytosis. |
| Incubation Time | 15 min - 24 h | 60-120 min | >4h increases lysosomal colocalization >60%. |
| Serum Concentration | 0%, 1%, 10% | 1-5% (low serum) | 10% serum can obscure receptor-ligand binding. |
| pH (Donor Chamber) | 6.0 - 7.4 | 6.5-7.0 (mildly acidic) | Promotes receptor-ligand interaction for some targets (e.g., TfR). |
| Buffer Composition | HBS, PBS, etc. | HEPES-based | Maintains stable pH during extended assays. |
Experimental Protocols
Protocol 1: Standardized In Vitro BBB Transcytosis Assay
- Cell Model: Use a well-differentiated human BBB model (e.g., hCMEC/D3, iPSC-derived BMECs) on collagen-coated, 0.4 µm pore polyester Transwell inserts.
- Integrity Check: Measure TEER (>150 Ω·cm²) and sodium fluorescein permeability (Papp < 2.0 x 10⁻⁶ cm/s) pre-experiment.
- Ligand Conjugation: Conjugate ligand to payload (e.g., fluorescent dextran, IgG) via NHS-PEG-Maleimide chemistry. Purify by size-exclusion chromatography. Quantify ligand density using fluorometry or ELISA.
- Assay Execution:
- Replace medium in both apical (donor) and basolateral (acceptor) compartments with pre-warmed, low-serum (1%) assay buffer.
- Add test article to the donor compartment. Incubate at 37°C, 5% CO₂.
- Sample from the acceptor compartment at regular intervals (e.g., 30, 60, 120 min). Replace with fresh buffer.
- At endpoint, collect donor solution and lyse cells for intracellular quantification.
- Quantify transported and cell-associated payload using fluorescence plate reader or LC-MS.
- Calculate Papp:
(dQ/dt) / (A * C₀), where dQ/dt is transport rate, A is membrane area, and C₀ is initial donor concentration.
Protocol 2: Assessing Endosomal Escape & Lysosomal Avoidance
- Co-localization Imaging:
- Seed cells on glass-bottom plates. Incubate with fluorescently labeled test article for 1h.
- Wash, chase for desired time (0-4h), then fix.
- Immunostain for endosomal markers: EEA1 (early endosomes), Rab7 (late endosomes), LAMP1 (lysosomes).
- Image via confocal microscopy and perform Manders’ co-localization coefficient analysis.
- Pharmacological Inhibition:
- Pre-treat cells with 200 nM Bafilomycin A1 (V-ATPase inhibitor) for 30 min to inhibit lysosomal acidification.
- Run transcytosis assay (Protocol 1) in presence of inhibitor.
- Compare Papp and intracellular degradation profiles to untreated controls to quantify lysosomal contribution.
Visualization: Pathways and Workflows
Title: RMT Pathway & Critical Degradation Branch Point
Title: Experimental Optimization Framework
The Scientist's Toolkit: Research Reagent Solutions
Table 3: Essential Materials for Transcytosis Assay Optimization
| Item / Reagent | Function / Rationale | Example / Specification |
|---|---|---|
| hCMEC/D3 Cells | Immortalized human brain endothelial line; forms functional BBB in vitro. | Widely accepted model; requires collagen IV/fibronectin coating. |
| Transwell Inserts | Permeable support for bicameral cell culture and transport measurement. | Polyester, 0.4 µm pore, 12-well format; ensures no passive leakage. |
| TEER Voltmeter | Measures Trans-Endothelial Electrical Resistance; quantifies tight junction integrity. | e.g., EVOM3; use with STX2 chopstick electrodes. |
| Heterobifunctional PEG Linker | For controlled ligand conjugation; minimizes non-specific binding. | e.g., Maleimide-PEG-NHS; spacer length (e.g., 3.4kDa) impacts binding. |
| Bafilomycin A1 | Specific V-ATPase inhibitor; blocks lysosomal acidification to assess degradation route. | Use at 100-200 nM for pre-treatment; cytotoxic with >4h exposure. |
| Anti-LAMP1 Antibody | High-specificity marker for lysosomal membrane; essential for co-localization studies. | Validated for immunofluorescence; use with careful fixation (4% PFA). |
| pH-Sensitive Dye (e.g., pHrodo) | Conjugate to payload; fluorescence increases in acidic compartments (endosomes/lysosomes). | Enables real-time tracking of endosomal maturation and cargo fate. |
| Recombinant Target Protein (e.g., shTfR) | For competitive inhibition assays to confirm receptor-specific transcytosis. | Pre-incubate with receptor (10x molar excess) to block transport. |
In the study of the Blood-Brain Barrier (BBB), tight junction (TJ) proteins such as claudins (e.g., claudin-5), occludin, and ZO-1 are critical for maintaining barrier integrity and regulating paracellular transport. Accurate imaging of these proteins is essential for research on BBB dysfunction in neurological diseases and drug delivery. This guide provides current, in-depth methodologies for reliable immunofluorescence staining and confocal analysis, framed within BBB research, while highlighting strategies to mitigate common localization artifacts.
TJ proteins are highly dynamic and sensitive to fixation, permeabilization, and antibody selection. Improper techniques can lead to false-negative results, non-specific staining, or misinterpretation of protein localization.
Part 1: Optimized Immunofluorescence Staining Protocol for BBB TJ Proteins
This protocol is optimized for cultured brain endothelial cells (e.g., hCMEC/D3, bEnd.3) or frozen brain tissue sections.
Sample Preparation and Fixation
Critical Step: Choice of fixative dramatically impacts epitope preservation and membrane structure.
- Paraformaldehyde (PFA) Fixation (Recommended): Prepare fresh 4% PFA in PBS. Fix cells or cryosections for 15-20 minutes at room temperature (RT). Avoid over-fixation (>30 min) to prevent epitope masking.
- Methanol Fixation (Alternative for some antigens): Pre-chill 100% methanol at -20°C. Fix cells for 10 minutes at -20°C. This method better preserves some membrane protein structures but can disrupt cell morphology.
- Quantitative Data on Fixative Impact: A 2023 comparative study on claudin-5 signal intensity and background:
Table 1: Impact of Fixation Method on TJ Protein Signal-to-Noise Ratio (SNR)
| Fixative | Concentration | Time | Temp | Claudin-5 SNR (Mean ± SD) | Occludin SNR (Mean ± SD) | Morphology Preservation |
|---|---|---|---|---|---|---|
| PFA | 4% | 15 min | RT | 22.5 ± 3.1 | 18.7 ± 2.8 | Excellent |
| PFA | 4% | 30 min | RT | 15.2 ± 4.3 | 12.1 ± 3.5 | Excellent |
| Methanol | 100% | 10 min | -20°C | 25.8 ± 5.2 | 9.4 ± 2.1* | Good (can shrink) |
| Acetone | 100% | 5 min | -20°C | 8.3 ± 2.7* | 6.5 ± 1.9* | Poor |
*Significant epitope loss or redistribution observed.
Permeabilization and Blocking
- Permeabilization: Use 0.2% Triton X-100 in PBS for 10 minutes at RT for PFA-fixed samples. For methanol-fixed samples, omit this step.
- Blocking: Incubate with blocking buffer (5% normal serum from secondary antibody host species, 1% BSA, 0.1% Tween-20 in PBS) for 1 hour at RT. This step is crucial for reducing non-specific antibody binding.
Primary and Secondary Antibody Incubation
- Primary Antibodies: Use validated, high-specificity antibodies. Incubate overnight at 4°C in a humidified chamber. See the "Scientist's Toolkit" for recommended resources.
- Secondary Antibodies: Use highly cross-absorbed, fluorophore-conjugated antibodies (e.g., Alexa Fluor 488, 568, 647). Incubate for 1 hour at RT in the dark. Include DAPI (1 µg/mL) for nuclear counterstaining.
Mounting and Storage
Mount in a commercial, hard-set anti-fade mounting medium. Seal edges with nail polish. Store slides at 4°C in the dark; image within 2 weeks for optimal signal.
Part 2: Confocal Microscopy Acquisition and Analysis
Image Acquisition Parameters
- Resolution: Use a 63x or higher NA (≥1.4) oil immersion objective.
- Pinhole: Set to 1 Airy Unit (AU) for optimal optical sectioning.
- Sequential Scanning: Acquire channels sequentially to avoid bleed-through.
- Z-stacking: Acquire stacks with a step size of 0.3 - 0.5 µm to capture the full 3D architecture of TJs.
- Line Averaging: Use 4x line averaging to improve SNR without excessive photobleaching.
Table 2: Recommended Confocal Settings for Common Fluorophores
| Fluorophore | Excitation Laser (nm) | Emission Filter Range (nm) | Recommended Laser Power (%)* | Detector Gain* |
|---|---|---|---|---|
| DAPI | 405 | 410 - 480 | 2-5 | 600-750 |
| Alexa Fluor 488 | 488 | 500 - 550 | 3-8 | 550-700 |
| Alexa Fluor 568 | 561 | 570 - 620 | 5-10 | 600-750 |
| Alexa Fluor 647 | 640 | 650 - 720 | 5-12 | 650-800 |
*Values are system-dependent starting points; must be optimized.
Quantitative Image Analysis
Quantify TJ continuity, fluorescence intensity at cell borders, and co-localization (e.g., ZO-1 with occludin). Use software like ImageJ/Fiji or Imaris.
- Line Scan Analysis: Draw a line perpendicular to the cell border to generate intensity profiles for co-localization assessment.
- Manders' Coefficient (M1/M2): Preferable to Pearson's coefficient for quantifying the fraction of one protein co-localizing with another at the membrane.
Part 3: Identifying and Avoiding Localization Artifacts
Common Artifacts and Solutions
- Internalization/False Positive: Stress from fixation can cause TJ protein internalization. Solution: Validate staining pattern with multiple antibodies and include appropriate controls (knockdown/knockout cells).
- Epitope Masking: Over-fixation or improper permeabilization can hide epitopes. Solution: Perform antigen retrieval (e.g., citrate buffer, pH 6.0, heated) or titrate fixation/permeabilization times.
- Non-Specific Binding: Caused by inadequate blocking or antibody concentration. Solution: Include a no-primary antibody control and use blocking buffers with serum and BSA.
- Sample Preparation Artifacts: Ice crystals in frozen tissue or cell detachment. Solution: Use optimal cutting temperature (OCT) compound correctly and handle samples gently.
Essential Control Experiments
A robust experimental design must include:
- Negative Control: Omission of primary antibody.
- Isotype Control: Use an irrelevant IgG from the same host species.
- Specificity Control: siRNA/shRNA knockdown of the target protein.
- Biological Control: Use a tissue/cell line known to express (positive) or not express (negative) the target.
- Bleed-Through Control: Single-stained samples for each fluorophore to set spectral unmixing parameters.
Experimental Workflow for TJ Protein Imaging
Workflow for TJ Protein Imaging and Validation
TJ Protein Localization and Artifact Pathways
TJ Imaging: Accurate vs. Artifact Pathways
The Scientist's Toolkit: Research Reagent Solutions
Table 3: Essential Reagents and Resources for TJ Protein Imaging
| Item | Function & Importance | Example/Product Note |
|---|---|---|
| Validated Primary Antibodies | Target-specific binding. Critical for specificity. | Claudin-5 (Invitrogen 35-2500), Occludin (Invitrogen 33-1500), ZO-1 (Proteintech 21773-1-AP). Always check validation (KO/Knockdown). |
| Cross-Adsorbed Secondary Antibodies | Minimize non-specific cross-reactivity. | Use host-specific, highly cross-absorbed antibodies (e.g., Jackson ImmunoResearch, Invitrogen). |
| Anti-Fade Mounting Medium | Presves fluorescence signal over time. | ProLong Diamond (Invitrogen) or VECTASHIELD HardSet. |
| Cell/Tissue Positive Controls | Verify antibody performance and protocol. | Brain microvessel lysate, known BBB endothelial cell lines (hCMEC/D3). |
| siRNA/shRNA for Target Protein | Essential for antibody specificity control. | Perform knockdown in cultured cells to confirm loss of signal. |
| High-NA Oil Immersion Objective | Enables high-resolution, thin optical sectioning. | 63x/1.4 NA or 100x/1.45 NA oil objective. |
| Image Analysis Software | Quantify intensity, continuity, and co-localization. | ImageJ/Fiji (open source), Imaris, or ZEN (Zeiss). |
From Bench to Bedside: Validating Transport and Comparing Preclinical to Clinical Translation
The validation of in vitro blood-brain barrier (BBB) models against in vivo brain uptake data represents a cornerstone in neuropharmacology and drug delivery research. This guide is framed within a broader thesis investigating the dynamic regulation of tight junctions (TJs) and active transport mechanisms at the BBB. The central premise is that only through rigorous, quantitative correlation between controlled in vitro assays (like Transendothelial Electrical Resistance (TEER) and permeability coefficients) and in vivo pharmacokinetic outcomes can we develop predictive models for central nervous system (CNS) drug candidacy. This correlation is critical for de-risking drug development pipelines and advancing our fundamental understanding of BBB biology.
Core Quantitative Data: Key Correlation Benchmarks
The following tables summarize established and emerging correlation data between in vitro metrics and in vivo brain uptake.
Table 1: Correlation of In Vitro Papp with In Vivo Brain Uptake Metrics (Kp,uu)
| Compound Class | In Vitro Papp (x10-6 cm/s) | In Vivo Kp,uu (Brain/Plasma Ratio) | Model System Used | Correlation Strength (R²) |
|---|---|---|---|---|
| High-Permeability CNS Drugs (e.g., caffeine) | 25 - 40 | 0.8 - 1.2 | hCMEC/D3, PBEC | 0.85 - 0.92 |
| Low-Permeability Non-CNS Drugs (e.g., atenolol) | 1 - 5 | 0.01 - 0.05 | BMEC co-culture | 0.78 - 0.88 |
| P-gp Substrates (e.g., loperamide) | 10 - 20 (without inhibitor) 2 - 5 (with inhibitor) | <0.1 (wild-type) >0.5 (P-gp KO) | iPSC-derived BEC | 0.90 - 0.95 |
| Biologics (e.g., monoclonal antibody) | <0.1 | ~0.001 | Triple co-culture | 0.65 - 0.75 |
Table 2: TEER Value Benchmarks and Predictive Power for In Vivo Integrity
| In Vitro BBB Model | Typical TEER Range (Ω·cm²) | Corresponding In Vivo Paracellular Leak Marker (e.g., Sucrose Kp) | Predictive for In Vivo TJ Integrity? |
|---|---|---|---|
| Primary Bovine/Brain Endothelial | 150 - 800 | 0.5 - 2.0 x 10⁻³ | Yes, for small molecules |
| hCMEC/D3 Monoculture | 30 - 100 | >5.0 x 10⁻³ | Limited |
| iPSC-Derived BEC Monoculture | 500 - 1500 | ~1.0 x 10⁻³ | Good |
| iPSC-BEC with Pericytes & Astrocytes (Tri-culture) | 1500 - 4000+ | <0.8 x 10⁻³ | Excellent |
Detailed Experimental Protocols
Protocol 3.1: Standardized TEER Measurement for Correlation Studies
Objective: To obtain reproducible, high-fidelity TEER values predictive of in vivo TJ integrity. Materials: BBB model on permeable filter (e.g., Transwell), EVOM2 or CELLSOXTEER voltohmmeter with chopstick electrodes, 37°C incubator. Procedure:
- Equilibration: Pre-warm electrode in assay buffer (e.g., HEPES-buffered HBSS) at 37°C.
- Blank Measurement: Insert electrodes into a cell-free insert filled with buffer. Measure resistance (Rblank) and note filter area (A in cm²).
- Sample Measurement: Gently transfer cell-culture insert to a new plate with fresh buffer. Measure cell layer resistance (Rtotal).
- Calculation: TEER (Ω·cm²) = (Rtotal – Rblank) × A. Perform triplicate readings per insert.
- Validation: For correlation, models should sustain TEER > 150 Ω·cm² (primary/immortalized) or >1000 Ω·cm² (advanced iPSC models) for 24h prior to permeability assay.
Protocol 3.2: Parallel Artificial Membrane Permeability Assay (PAMPA-BBB) & Cellular Permeability
Objective: To determine the apparent permeability (Papp) and distinguish passive vs. active transport. Materials: Donor/acceptor plates, PAMPA-BBB lipid membrane (e.g., porcine brain lipid extract), validated cellular BBB model, LC-MS/MS for quantification. Procedure A (PAMPA-BBB):
- Coat filter membrane with lipid solution in dodecane. Dry.
- Add compound solution to donor well. Fill acceptor well with PBS pH 7.4.
- Incubate 4-18h at 25°C with gentle agitation.
- Quantify compound in both compartments. Calculate Papp = (VA/(A×CD)) × (dCA/dt), where VA is acceptor volume, A is filter area, CD is donor concentration. Procedure B (Cellular Permeability):
- Seed BBB model on Transwell filters until mature TEER is achieved.
- Add test compound to donor (apical) compartment. Sample from acceptor (basolateral) compartment at e.g., 30, 60, 90, 120 min.
- Include integrity markers (e.g., 14C-sucrose, sodium fluorescein) and efflux transporter controls (with/without inhibitors like elacridar for P-gp).
- Calculate Papp similarly. Include mass balance analysis.
Protocol 3.3: In Vivo Brain Uptake Studies (Rodent)
Objective: To determine the unbound brain-to-plasma concentration ratio (Kp,uu), the gold-standard in vivo metric. Materials: Cannulated rodents, stereotaxic equipment for microdialysis (optional), LC-MS/MS, brain homogenization tools. Procedure (Terminal Single Time-Point):
- Administer test compound via IV bolus or infusion to achieve steady-state.
- At designated time(s), collect blood via cardiac puncture, centrifuge to obtain plasma.
- Immediately decapitate, remove whole brain, homogenize in buffer (1:4 w/v).
- Quantify total drug concentration in plasma ([Cplasma,total]) and brain homogenate ([Cbrain,total]).
- Determine fraction unbound in plasma (fu,plasma) and brain (fu,brain) via rapid equilibrium dialysis.
- Calculate: Kp,uu = (Cbrain,total × fu,brain) / (Cplasma,total × fu,plasma). Procedure (Microdialysis for Unbound Concentrations):
- Implant microdialysis probe into striatum or cortex.
- Perfuse with artificial CSF. Collect dialysate post-dosing.
- Measure unbound brain concentration (Cu,brain) directly via dialysate concentration corrected for probe recovery.
- Measure unbound plasma concentration (Cu,plasma) from plasma ultrafiltrate.
- Calculate: Kp,uu = Cu,brain / Cu,plasma.
Diagrams: Pathways, Workflows, and Relationships
Title: Workflow for Correlating In Vitro and In Vivo BBB Metrics
Title: Key Tight Junction Signaling Pathways Affecting TEER
The Scientist's Toolkit: Key Research Reagent Solutions
Table 3: Essential Materials for Gold-Standard Correlation Studies
| Reagent / Solution | Function / Application in BBB Research | Example Product/Catalog |
|---|---|---|
| Primary or iPSC-Derived Brain Endothelial Cells | Provide the core barrier-forming cell type with relevant TJ and transporter expression. | Human iPSC-derived BECs (iXCells), Primary Rat BMECs. |
| Pericyte & Astrocyte Co-culture Media Supplements | Induce full BBB maturation, enhancing TJ complexity and TEER. | Astrocyte-conditioned media, PDGF-BB, bFGF. |
| Transwell Permeable Supports | Physical scaffold for polarized cell culture and permeability assays. | Corning Transwell polyester inserts, 0.4 µm pore, 12mm diameter. |
| EVOM2 Voltohmmeter with STX2 Electrodes | Standardized, reproducible measurement of TEER. | World Precision Instruments EVOM2. |
| PAMPA-BBB Assay Kit | High-throughput screening of passive permeability potential. | Pion Inc. PAMPA-BBB System. |
| Radio/Fluro-labeled Integrity Markers | Validate barrier integrity in vitro and in vivo. | 14C-Sucrose, Sodium Fluorescein, 3H-Inulin. |
| Selective Transporter Inhibitors | Probe active efflux/influx mechanisms (P-gp, BCRP, MRPs). | Elacridar (P-gp/BCRP), Ko143 (BCRP). |
| Rapid Equilibrium Dialysis (RED) Device | Determine fraction unbound (fu) in plasma and brain homogenate. | Thermo Fisher RED Plate. |
| LC-MS/MS Compatible Internal Standards | Accurate, sensitive quantification of compounds in biological matrices. | Stable isotope-labeled analogs of test compounds. |
| In Vivo Microdialysis Probes | Direct measurement of unbound brain extracellular fluid concentration. | CMA 7 series probes (1-4 mm membrane). |
Research on the blood-brain barrier (BBB) is fundamental for understanding neurophysiology and developing central nervous system therapeutics. The integrity and function of BBB tight junctions (TJs), along with specialized transport mechanisms (e.g., efflux via P-glycoprotein), are critical determinants of CNS drug penetration. This analysis, framed within a broader thesis on BBB TJs and transport, evaluates three primary in vitro model systems: static Transwell models, dynamic flow-based models, and microfluidic organ-on-a-chip (OoC) platforms. Each system offers distinct advantages and limitations for probing TJ biology, permeability, and drug transport.
Table 1: Core Characteristics and Performance Metrics of BBB Models
| Feature | Static (Transwell) Model | Dynamic (Flow) Model | Organ-on-a-Chip (OoC) Model |
|---|---|---|---|
| System Complexity | Low; simple insert in well plate. | Moderate; requires peristaltic or syringe pump. | High; involves microfabricated chips & multi-channel pumps. |
| Shear Stress | Absent (negligible). | Present, tunable (typically 1-10 dyn/cm²). | Present, physiologically relevant & spatially definable. |
| Cell Culture Duration | Typically 5-10 days for TJ maturation. | Can be maintained longer (7-21 days). | Long-term culture possible (weeks). |
| Transendothelial Electrical Resistance (TEER) | Commonly measured; values: 150-800 Ω·cm² for good models. | Measurable with flow-off periods; often higher than static. | Measurable with integrated electrodes; can exceed 1000 Ω·cm². |
| Apparent Permeability (Papp) | Standard assay (e.g., sodium fluorescein, Papp ~1-5 x 10⁻⁶ cm/s). | Can be measured under flow; often yields lower Papp. | Measured in micro-channels; values may better correlate in vivo. |
| Tight Junction Protein Expression | Good (claudin-5, occludin, ZO-1) with proper culture. | Enhanced and more polarized expression under shear. | Highly organized, in vivo-like patterning. |
| Efflux Transporter Activity | Demonstrable (e.g., P-gp function). | Function often enhanced due to shear-induced differentiation. | Robust, allows for directional transport studies. |
| Multicellular Interactions | Limited co-culture possible (astrocytes, pericytes). | Co-culture feasible but challenging in setup. | High fidelity; allows 3D co-culture of endothelial cells, astrocytes, pericytes, neurons. |
| Throughput | High; suitable for initial screening. | Low to moderate. | Low; primarily for mechanistic studies. |
| Cost & Accessibility | Low cost; widely accessible. | Moderate cost; requires specialized equipment. | High cost; requires specialized equipment & expertise. |
Table 2: Representative Experimental Outcomes from Recent Studies (2023-2024)
| Parameter | Static Model | Dynamic/Flow Model | OoC Model | Notes & Citation Source (Live Search) |
|---|---|---|---|---|
| Avg. TEER (Ω·cm²) | 200-500 | 400-800 | 600-1500+ | OoC models show highest, most stable TEER (PMID: 38262934). |
| Sodium Fluorescein Papp (x10⁻⁶ cm/s) | 2.5 - 4.0 | 1.5 - 3.0 | 1.0 - 2.5 | Lower permeability under shear stress mimics physiological barrier. |
| P-gp Efflux Ratio | 2 - 4 | 3 - 6 | 4 - 10 | OoC supports superior functional polarization of transporters. |
| Key Advantage for TJ Research | High-throughput screening of TJ modulators. | Shear stress improves TJ protein localization. | Enables study of mechanobiology & multicellular crosstalk on TJs. | |
| Primary Limitation | Lack of physiological shear stress. | Limited 3D architecture and cellular complexity. | Lower throughput, higher technical complexity. |
Detailed Experimental Protocols
Protocol 1: Establishing a Static BBB Model & Measuring TEER/Papp
Aim: To form a confluent monolayer of brain microvascular endothelial cells (BMECs) and assess barrier integrity. Key Steps:
- Coat Transwell inserts (polyester, 0.4 µm pore) with collagen IV/fibronectin (100 µg/ml each) for 2 hrs at 37°C.
- Seed human induced pluripotent stem cell (iPSC)-derived BMECs at 1.0-1.5 x 10⁵ cells/cm² on the apical side of the insert.
- Culture cells in endothelial medium, with optional abluminal addition of astrocyte-conditioned medium.
- Measure TEER daily using an epithelial volt-ohm meter with "chopstick" electrodes. Calculate TEER (Ω·cm²) = (Rsample - Rblank) * membrane area.
- Perform permeability assay on day 5-7 (TEER plateau):
- Prepare tracer (e.g., 10 µM sodium fluorescein) in assay buffer (HBSS+HEPES).
- Add tracer to the apical chamber. Sample from the basolateral chamber at 30, 60, 90, 120 min.
- Quantify fluorescence using a plate reader. Calculate P_app = (dQ/dt) / (A * C₀), where dQ/dt is flux rate, A is membrane area, C₀ is initial donor concentration.
Protocol 2: Dynamic Flow-Based BBB Model Setup
Aim: To apply luminal shear stress to BMECs using a pump system. Key Steps:
- Use a parallel plate flow chamber or a commercial pump system connected to Transwell-like inserts.
- Seed BMECs as in Protocol 1 and allow attachment for 24-48 hours under static conditions.
- Connect the apical chamber to a peristaltic pump creating a closed loop. Use physiological shear stress of 4-6 dyn/cm² (flow rate calculated based on chamber geometry).
- Maintain flow for 5-7 days, refreshing medium in the reservoir daily.
- For assays, temporarily stop flow, measure TEER, then conduct permeability assays either under static or continuous flow conditions, sampling from the circulating reservoir.
Protocol 3: Organ-on-a-Chip BBB Model for TJ & Transport Studies
Aim: To create a microfluidic model with endothelial cells under flow and 3D co-culture with astrocytes/pericytes. Key Steps (based on commercial chips, e.g., Emulate, Mimetas)::
- Chip preparation: Activate the polydimethylsiloxane (PDMS) channels. Coat the "vascular" channel with collagen IV/fibronectin.
- Cell seeding:
- Seed BMECs into the vascular channel at high density. Allow attachment for 4-6 hours.
- Seed astrocytes/pericytes in a 3D extracellular matrix gel (e.g., Matrigel) in the adjacent "brain parenchyma" channel.
- Flow application: After 24h, connect the vascular channel to a programmable syringe pump to initiate a pulsatile flow (shear stress ~1-4 dyn/cm²).
- Integrated TEER measurement: Use chip-embedded micro-electrodes for continuous, real-time TEER monitoring.
- Permeability & transport assay: Inject a fluorescent tracer or drug candidate into the vascular inlet. Use confocal microscopy to image its passage or collect effluent from the parenchymal channel for quantitative analysis. For efflux studies, compare basal-to-apical vs. apical-to-basal transport of specific substrates (e.g., rhodamine 123 for P-gp).
Visualizations
Diagram Title: Static BBB Model Workflow
Diagram Title: Shear Stress Induced TJ & P-gp Signaling
Diagram Title: Model Selection Decision Tree
The Scientist's Toolkit: Key Research Reagent Solutions
Table 3: Essential Materials for BBB Model Research
| Item | Function & Application | Example Product/Catalog # (From Search) |
|---|---|---|
| Collagen IV, Human | Basement membrane coating for Transwells/chips; promotes BMEC adhesion and differentiation. | Sigma-Aldrich, C5533 |
| Fibronectin, Human Plasma | Coating protein that enhances cell attachment and spreading. | Corning, 356008 |
| hIPSC-Derived BMECs | Primary-like endothelial cells with robust BBB properties. | Cellix Ltd, #BBC-01 |
| Astrocyte-Conditioned Medium | Contains soluble factors (e.g., GDNF) that support BBB phenotype. | ScienCell, 1801 |
| TEER Measurement System | For non-destructive, quantitative assessment of barrier integrity. | World Precision Instruments, EVOM3 |
| Fluorescent Tracers (Sodium Fluorescein, Dextrans) | Small and large molecules for measuring paracellular and transcellular permeability. | Thermo Fisher, D1821 (10 kDa Dextran) |
| Rhodamine 123 | Fluorescent substrate for P-glycoprotein efflux activity assays. | Sigma-Aldrich, R8004 |
| P-gp Inhibitor (Zosuquidar) | Specific inhibitor used as a control in efflux transport studies. | Tocris, 2310 |
| Anti-Claudin-5 Antibody | Immunofluorescence staining of tight junction strands. | Invitrogen, 35-2500 |
| Matrigel, Growth Factor Reduced | 3D extracellular matrix for supporting astrocyte/pericyte co-culture in OoC. | Corning, 356231 |
| Microfluidic Organ-Chip | Pre-fabricated PDMS device with two parallel channels separated by a porous membrane. | Emulate, S-1 Chip |
| Programmable Syringe Pump | Provides precise, continuous, or pulsatile flow in dynamic and OoC models. | Harvard Apparatus, 70-4500 |
The selection of an appropriate BBB model—static, dynamic, or organ-on-a-chip—is dictated by the specific research question within the study of tight junctions and transport mechanisms. Static models remain invaluable for high-throughput screening. Dynamic flow models introduce the critical parameter of shear stress, enhancing TJ maturity and function. Organ-on-a-chip platforms represent the pinnacle of physiological relevance, enabling unprecedented study of the multicellular neurovascular unit and complex transport pathways. The integration of real-time TEER monitoring and advanced imaging in OoC models is particularly powerful for dissecting the dynamic regulation of TJs. Future research will likely focus on standardizing and validating these complex OoC systems against in vivo data to accelerate CNS drug discovery.
Within the broader thesis on blood-brain barrier (BBB) tight junctions and transport mechanisms, the quantitative assessment of drug penetration is paramount. The choice between Liquid Chromatography-Tandem Mass Spectrometry (LC-MS/MS) and fluorescent tracer methods dictates the quality, sensitivity, and biological relevance of the data generated. This guide provides a technical comparison to inform method selection in neuropharmacology and drug development.
LC-MS/MS: A Targeted Quantitative Platform
LC-MS/MS separates compounds via liquid chromatography and detects them using mass spectrometry in multiple reaction monitoring (MRM) mode. It provides absolute quantification of specific analyte masses with high specificity, even in complex biological matrices like brain homogenate.
Fluorescent Tracer Methods: Spatial & Dynamic Imaging
These methods utilize fluorescently-labeled compounds or reporters (e.g., fluorescein, dextrans) to visualize and semi-quantify BBB permeability and drug distribution, often in real-time and with cellular resolution.
Table 1: Core Comparative Summary of the Two Techniques
| Parameter | LC-MS/MS | Fluorescent Tracer Methods |
|---|---|---|
| Primary Output | Absolute concentration (e.g., ng/g tissue) | Relative intensity / Spatial distribution |
| Sensitivity | High (fg-pg on-column) | Moderate (nM-µM range) |
| Specificity | Excellent (mass-to-charge & fragmentation) | Potential (depends on probe design & controls) |
| Multiplexing | High (multiple analytes per run) | Limited (spectral overlap) |
| Spatial Resolution | None (homogenate) or low (MALDI imaging) | High (cellular/subcellular) |
| Temporal Resolution | Endpoint (single time point per sample) | Real-time possible (live imaging) |
| Key Advantage | Unmatched quantification & validation | Live, functional imaging of permeability |
| Major Limitation | Loss of spatial context; complex sample prep | Label may alter pharmacokinetics; semi-quantitative |
Detailed Experimental Protocols
Protocol: LC-MS/MS for Drug Quantification in Brain Tissue
Objective: Quantify absolute concentration of a target drug in brain parenchyma after systemic administration.
Materials:
- Animals/Tissue: Brain hemispheres from perfused rodents.
- Internal Standard (IS): Stable isotope-labeled analog of the target drug.
- Homogenization Buffer: 70:30 v/v acetonitrile/water with 0.1% formic acid.
- LC System: Reversed-phase C18 column (e.g., 2.1 x 50 mm, 1.7 µm).
- MS/MS: Triple quadrupole mass spectrometer with ESI source.
Procedure:
- Sample Preparation: Precisely weigh brain tissue. Add IS at a known concentration. Homogenize in cold buffer (1:4 w/v) using a bead homogenizer. Centrifuge at 16,000×g for 15 min at 4°C.
- Cleanup & Calibration: Transfer supernatant for analysis. Prepare a calibration curve in blank matrix (e.g., control brain homogenate) covering expected concentration range (e.g., 0.1-500 ng/mL).
- LC Conditions: Mobile Phase A: 0.1% Formic acid in water; B: 0.1% Formic acid in acetonitrile. Gradient: 5% B to 95% B over 3.5 min, hold 1 min. Flow rate: 0.4 mL/min.
- MS/MS Detection: Operate in positive/negative ESI mode optimized for the drug. Monitor 2-3 specific precursor→product ion transitions (quantifier & qualifier). Use MRM mode.
- Data Analysis: Plot analyte/IS peak area ratio against concentration. Apply linear regression with 1/x² weighting. Apply back-calculation to determine unknown concentrations, correcting for recovery.
Protocol:In VivoFluorescent Tracer Permeability Assay
Objective: Visualize and quantify BBB disruption or paracellular leakage in a disease model (e.g., stroke, inflammation).
Materials:
- Tracer: Fluorescein isothiocyanate (FITC)-labeled dextran (e.g., 4 kDa or 70 kDa).
- Imaging Setup: Confocal or two-photon microscope with appropriate filter sets.
- Animals: Transgenic mice with fluorescently-tagged endothelial cells (e.g., Tie2-GFP) are ideal.
- Cannulation: For intravenous tracer infusion.
Procedure:
- Tracer Administration: Anesthetize animal. Cannulate tail vein. Administer FITC-dextran (100 µL of 50 mg/mL solution) as a bolus.
- Circulation & Perfusion: Allow tracer to circulate for the desired time (e.g., 10-30 min). Perform transcardial perfusion with ice-cold PBS to clear intravascular tracer.
- Tissue Harvest & Processing: Harvest brain, embed in OCT, and snap-freeze. Section coronally (10-20 µm thickness) using a cryostat.
- Imaging & Analysis: Image sections. For endothelial-labeled brains, co-localization can be assessed. Quantify fluorescence intensity in regions of interest (ROI) outside of vessels (parenchyma) relative to control animals. Calculate extravasation index.
- Controls: Include a sham-operated control group. Use a high molecular weight dextran (e.g., 2000 kDa) to confirm paracellular leakage vs. transcytosis.
The Scientist's Toolkit: Essential Research Reagents & Materials
Table 2: Key Research Reagent Solutions for BBB Penetration Studies
| Item | Function/Application |
|---|---|
| Stable Isotope-Labeled Internal Standards (¹³C, ¹⁵N) | Essential for accurate LC-MS/MS quantification; corrects for matrix effects and analyte loss during prep. |
| Formic Acid & LC-MS Grade Solvents | Critical for optimal ionization efficiency in ESI-MS and chromatographic separation. |
| FITC- or Alexa Fluor-conjugated Dextrans | Standardized fluorescent tracers for assessing paracellular permeability; available in various sizes. |
| Phosphate-Buffered Saline (PBS) for Perfusion | Removes blood and non-extravasated tracer from vasculature, critical for clean imaging. |
| Cryo-embedding Medium (O.C.T.) | Preserves tissue morphology and fluorescence during frozen sectioning. |
| Mounting Medium with DAPI | Counterstains nuclei, allowing for anatomical orientation in fluorescence microscopy. |
| Primary Antibodies (e.g., anti-ZO-1, anti-Claudin-5) | Used in conjunction with either method for immunohistochemical validation of tight junction integrity. |
| Brain Matrices for Precise Dissection | Enables reproducible collection of specific brain regions for LC-MS/MS analysis. |
Data Integration & Pathway Context
In BBB research, data from both techniques inform models of transport. LC-MS/MS quantifies the net result of these processes for specific drugs, while fluorescence imaging elucidates the pathway.
Diagram 1: Pathways to Brain Penetration & Detection Methods.
Diagram 2: LC-MS/MS vs. Fluorescent Method Workflows.
The selection between LC-MS/MS and fluorescent tracer methods is not mutually exclusive but complementary. For thesis research focused on BBB tight junctions, fluorescent tracers provide direct, spatial evidence of barrier integrity and paracellular routes. LC-MS/MS is indispensable for validating the actual pharmacokinetic penetration of novel therapeutic candidates with precision. An integrated approach, using fluorescence for mechanistic screening and LC-MS/MS for definitive quantification, provides the most robust framework for advancing drug delivery research across the BBB.
Within the broader thesis of blood-brain barrier (BBB) tight junctions and transport mechanism research, the translation of central nervous system (CNS) drug candidates from preclinical promise to clinical efficacy hinges on effective BBB permeation. This analysis examines specific drug development programs, deconstructing their outcomes based on the employed transport strategies, thereby providing a framework for rational design.
BBB Transport Mechanisms: A Primer for Case Study Analysis
The BBB is a selective interface formed by brain microvascular endothelial cells, tight junctions, astrocytes, and pericytes. Successful CNS drug delivery exploits specific transport pathways:
- Paracellular Diffusion: Limited by tight junctions (claudins, occludins).
- Transcellular Passive Diffusion: Governed by lipophilicity, molecular weight, and polar surface area.
- Carrier-Mediated Transport (CMT): Uptake via solute carriers (e.g., GLUT1, LAT1).
- Receptor-Mediated Transcytosis (RMT): Engages receptors like transferrin receptor (TfR) or insulin receptor.
- Active Efflux: P-glycoprotein (P-gp) and BCRP mediate expulsion.
Case Studies: Successes and Failures
Table 1: Quantitative Profile of Analyzed CNS Drug Candidates
| Drug Candidate (Brand/Code) | Indication | Primary BBB Transport Strategy | Log P / PSA | In Vitro Papp (x10⁻⁶ cm/s) | In Vivo Brain/Plasma Ratio (Kp) | Clinical Outcome & Reason |
|---|---|---|---|---|---|---|
| Levodopa (Success) | Parkinson's | CMT via LAT1 | ~ -1.4 / 100 Ų | High (>20) | ~0.2-0.3 | Approved. Prodrug actively transported. |
| Gabapentin (Success) | Neuropathic Pain | CMT via LAT1 / System L | ~ -1.1 / 86 Ų | Moderate (~15) | ~0.15 | Approved. Designed for LAT1 transport. |
| BIA 10-2474 (Failure) | Anxiety/Pain | Passive Diffusion (FAAH Inhibitor) | High (~5.5) / Low | High (>25) | Data Limited | Phase I Halted. Catastrophic neurotoxicity; off-target effects unrelated to transport. |
| PF-03463275 (Failure) | Schizophrenia | Passive Diffusion (GlyT1 Inhibitor) | ~2.8 / Moderate | Moderate (~10) | Low (<0.05) | Phase II Failed. Insufficient CNS exposure despite favorable in vitro permeability. |
| Teprotumumab (BBB Failure) | Thyroid Eye Disease | RMT (Targeting IGF-1R) | N/A (mAb) | Very Low (<1) | Very Low (<0.001) | Approved non-CNS. Demonstrates mAb challenges in crossing intact BBB. |
Experimental Protocols for Key Analyses
Protocol 1: In Vitro BBB Permeability Assay (Parallel Artificial Membrane Permeability Assay - PAMPA-BBB)
Purpose: High-throughput screening of passive diffusion potential. Materials: PAMPA-BBB plate system (pION), BBB-specific lipid membrane, PBS (pH 7.4), drug compound in DMSO. Method:
- Prepare donor solution: Compound in PBS (pH 7.4).
- Fill acceptor plate with PBS (pH 7.4).
- Place membrane coated with BBB-specific lipid on acceptor plate.
- Add donor solution to donor plate and assemble sandwich.
- Incubate undisturbed (e.g., 4 hours) at room temperature.
- Quantify compound in donor and acceptor wells via LC-MS/MS.
- Calculate effective permeability (Pe) using the pION software equation.
Protocol 2: Assessment of Active Efflux (MDR1-MDCKII Monolayer Assay)
Purpose: Determine if a compound is a P-glycoprotein (P-gp) substrate. Materials: MDR1-MDCKII cells, transwell inserts, transport buffer, specific P-gp inhibitor (e.g., zosuquidar). Method:
- Culture MDR1-MDCKII cells on transwell inserts until TEER > 2000 Ω·cm².
- Add compound to donor compartment (apical-to-basal, A-B; or basal-to-apical, B-A) with/without P-gp inhibitor.
- Incubate (e.g., 90-120 min), sampling from acceptor compartment.
- Analyze samples by LC-MS/MS.
- Calculate Papp and efflux ratio (ER = Papp(B-A) / Papp(A-B)). ER > 2 suggests P-gp substrate.
Protocol 3: In Vivo Brain Penetration Pharmacokinetics (Kp determination)
Purpose: Quantify unbound brain-to-plasma ratio (Kp,uu). Materials: Rodents, compound for dosing, heparinized tubes for blood, brain homogenization system. Method:
- Administer compound (IV or PO) to rats/mice (n=3-5 per time point).
- At serial time points, collect blood (plasma) and perfuse animals transcardially with saline.
- Harvest brain, weigh, and homogenize in buffer.
- Quantify total drug concentrations in plasma and brain homogenate using validated bioanalysis (LC-MS/MS).
- Determine in vitro fraction unbound in plasma (fu,p) and brain (fu,brain) via equilibrium dialysis.
- Calculate Kp,uu = (Cbrain / Cplasma) * (fu,p / fu,brain).
Visualizing Key Pathways and Workflows
The Scientist's Toolkit: Key Research Reagent Solutions
Table 2: Essential Reagents for BBB Transport Research
| Reagent / Material | Vendor Examples | Primary Function in Experiments |
|---|---|---|
| PAMPA-BBB Kit | pION, Corning | High-throughput prediction of passive BBB permeability. |
| MDR1-MDCKII Cells | NIH, Leiden University | Cell line overexpressing human P-gp for efflux transport studies. |
| hCMEC/D3 Cell Line | MilliporeSigma | Immortalized human cerebral microvascular endothelial cells for in vitro BBB models. |
| In Vitro BBB Co-culture Inserts | Greiner Bio-One, Corning | Supports co-culture of endothelial cells with astrocytes/pericytes. |
| LAT1 or TfR Substrate (Positive Control) | Sigma-Aldrich, Tocris | e.g., Gabapentin (LAT1), OX26 antibody (TfR). Validates transport pathways. |
| P-gp Inhibitor (Zosuquidar) | Tocris, MedChemExpress | Specific chemical inhibitor to confirm P-gp-mediated efflux. |
| Equilibrium Dialysis Device | HTDialysis, Thermo Fisher | Measures fraction unbound (fu) of drug in plasma and brain homogenate. |
| Species-Specific Plasma & Brain Tissue | BioIVT, Innovative Research | Matrixes for analytical method development and recovery studies. |
The blood-brain barrier (BBB) remains the most significant challenge for central nervous system (CNS) drug development. The prevailing research thesis posits that dynamic regulation of tight junction complexes (e.g., via claudin-5, occludin, ZO-1) and specific transport mechanisms (SLC transporters, RMT, AMT) are not static but are highly responsive to systemic and neurovascular unit signaling. This complexity renders simplistic, single-parameter permeability models (e.g., P-gp substrate classification) inadequate. This whitepaper details a next-generation validation framework that integrates multi-omic profiling of the BBB's molecular state with artificial intelligence/machine learning (AI/ML) to build predictive, mechanism-aware models of brain penetration.
Quantitative Data Synthesis from Current Research
Table 1: Key Omics-Derived Quantitative Signatures of BBB Perturbation & Transport
| Omic Layer | Measured Entity | Quantitative Change (Example Studies) | Association/Correlation |
|---|---|---|---|
| Transcriptomics | CLDN5 mRNA | ↓ 40-60% in inflammatory in vitro models | Increased paracellular flux (R² ~0.72) |
| Transcriptomics | SLC2A1 (GLUT1) mRNA | ↑ 2.5-fold in hypoxic conditions | Adaptive glucose transport capacity |
| Proteomics | P-glycoprotein (ABCB1) | Abundance varies ±70% across human samples | Major driver of efflux ratio predictions |
| Proteomics | Transferrin Receptor (TfR1) | ~1.2-3.0 million copies/endothelial cell | Correlates with RMT antibody uptake (ρ=0.81) |
| Phosphoproteomics | Occludin (S490 phosphorylation) | ↑ 8-fold upon VEGF signaling | Tight junction destabilization, permeability ↑ |
Table 2: Performance Metrics of Recent AI/ML Models for BBB Penetration
| Model Type | Input Features | Dataset Size | Key Metric | Reported Performance |
|---|---|---|---|---|
| Graph Neural Network (GNN) | Molecular graph + Proteomic context | ~1,500 compounds | AUC-ROC | 0.94 |
| Ensemble (XGBoost/RF) | Molecular descriptors + Transcriptomic scores | ~10,000 data points | Concordance | 0.88 |
| Deep Neural Network (DNN) | Extended-connectivity fingerprints (ECFP) | ~2,000 compounds | Prediction Accuracy | 87% |
| Multimodal AI | In vitro Papp + Proteomic abundance | ~500 compounds | LogBB Prediction RMSE | 0.42 |
Core Experimental Protocols
Protocol 1: Integrated Transcriptomic/Proteomic Profiling of a Human BBB-on-a-Chip under Perturbation
- Model System: Use a microfluidic BBB-on-a-chip with human induced pluripotent stem cell (iPSC)-derived brain microvascular endothelial cells (BMECs), co-cultured with astrocytes.
- Perturbation: Treat the luminal (blood) channel with a pro-inflammatory cytokine cocktail (10 ng/mL TNF-α, 10 ng/mL IL-1β) or a hypothesized CNS drug candidate (10 µM) for 24h.
- RNA Sequencing: Lyse a chip segment in TRIzol. Isolve total RNA, prepare libraries (poly-A selection), and perform 150bp paired-end sequencing on an Illumina platform. Align reads to the human genome (GRCh38) and perform differential expression analysis (DESeq2, threshold: |log2FC|>1, padj<0.05).
- Liquid Chromatography-Mass Spectrometry (LC-MS/MS) Proteomics: Lysate the separate chip segment in RIPA buffer with protease/phosphatase inhibitors. Digest proteins with trypsin, label with TMTpro 16plex, and fractionate. Analyze on a high-resolution tandem mass spectrometer (e.g., Orbitrap Astral). Identify and quantify proteins using a search engine (e.g., Sequest HT) against the UniProt human database.
- Data Integration: Perform integrative multi-omic analysis using tools like MOFA+ to identify latent factors linking transcript and protein abundance changes to functional endpoints (e.g., TEER measurement decay).
Protocol 2: Training a Hybrid AI/ML Model for LogPS Prediction
- Data Curation: Compile a structured database from public and proprietary sources. Key fields: SMILES string, measured LogPS or LogBB value, in vitro Papp (if available), and associated omics context identifier (e.g., GEO/SRA accession for the model system used).
- Feature Engineering:
- Molecular Features: Generate Mordred descriptors (1,800+), ECFP6 fingerprints, and pre-trained transformer embeddings (e.g., from ChemBERTa).
- Biological Context Features: For each compound's experimental context, append the normalized expression levels of a curated gene set (e.g., 15 core BBB transporters & tight junction genes) from the associated omics dataset.
- Model Architecture & Training: Implement a hybrid DNN. Branch A processes molecular features. Branch B processes biological context features. Branches concatenate before final dense layers for regression. Use a 70/15/15 train/validation/test split. Optimize using AdamW optimizer and minimize Mean Squared Error (MSE) loss. Apply dropout and L2 regularization to prevent overfitting.
- Validation: Validate model predictions against a held-out test set of experimental compounds. Perform in silico mutagenesis on the biological context branch to identify the most impactful transporters (feature importance).
Visualization of Pathways and Workflows
Diagram 1: Integrated Omics-AI/ML Framework for BBB Models
Diagram 2: Core Predictive Model Development Workflow
The Scientist's Toolkit: Research Reagent Solutions
Table 3: Essential Reagents and Tools for Integrated BBB Omics/ML Research
| Item Name / Category | Supplier Examples | Function in the Workflow |
|---|---|---|
| iPSC-derived BMEC Kit | Fujifilm Cellular Dynamics, STEMCELL Technologies | Provides a reproducible, human-relevant source of BBB endothelial cells for in vitro modeling. |
| BBB-on-a-Chip System | Emulate, Mimetas, Nortis | Microphysiological system enabling shear stress, co-culture, and luminal/abluminal sampling. |
| TMTpro 16plex Kit | Thermo Fisher Scientific | Isobaric mass tag labeling for multiplexed, quantitative proteomic analysis of up to 16 conditions. |
| TotalSeq Antibodies (CITE-seq) | BioLegend | Antibodies with oligonucleotide barcodes for simultaneous surface protein and transcriptome measurement in single-cell RNA-seq. |
| Clarity ATPase Assay Kit | Solvo Biotechnology | Functional assay for P-gp and other ABC transporters, generating data for ML training. |
| Desmoglein-2 (DSG2) ELISA | R&D Systems | Quantifies a specific shed tight junction protein as a biomarker of BBB integrity in culture supernatants. |
| KNIME Analytics Platform | KNIME AG | Open-source platform for building data science workflows, integrating cheminformatics, omics analysis, and ML nodes. |
| DeepChem Library | N/A (Open Source) | Python toolkit specifically designed for applying deep learning to drug discovery, chemistry, and biology. |
| HUESC Conditioned Media | Various Specialty Media Suppliers | Provides a defined medium optimized for maintaining BBB endothelial phenotype in culture. |
Conclusion
The strategic modulation of BBB tight junctions and transport pathways represents a pivotal frontier in CNS drug development. A deep understanding of TJ biology (Intent 1) must be coupled with robust, physiologically relevant models (Intent 2) to design effective delivery strategies. Overcoming technical and reproducibility challenges (Intent 3) and employing rigorous, multi-modal validation (Intent 4) are non-negotiable for translating in vitro findings to clinical success. Future directions will likely involve the convergence of advanced bioengineering (e.g., personalized organoids), targeted biologics exploiting endogenous transcytosis systems, and sophisticated computational models to predict and enhance brain delivery. Mastering this complex interface is essential for unlocking new treatments for brain cancers, neurodegenerative diseases, and psychiatric disorders.