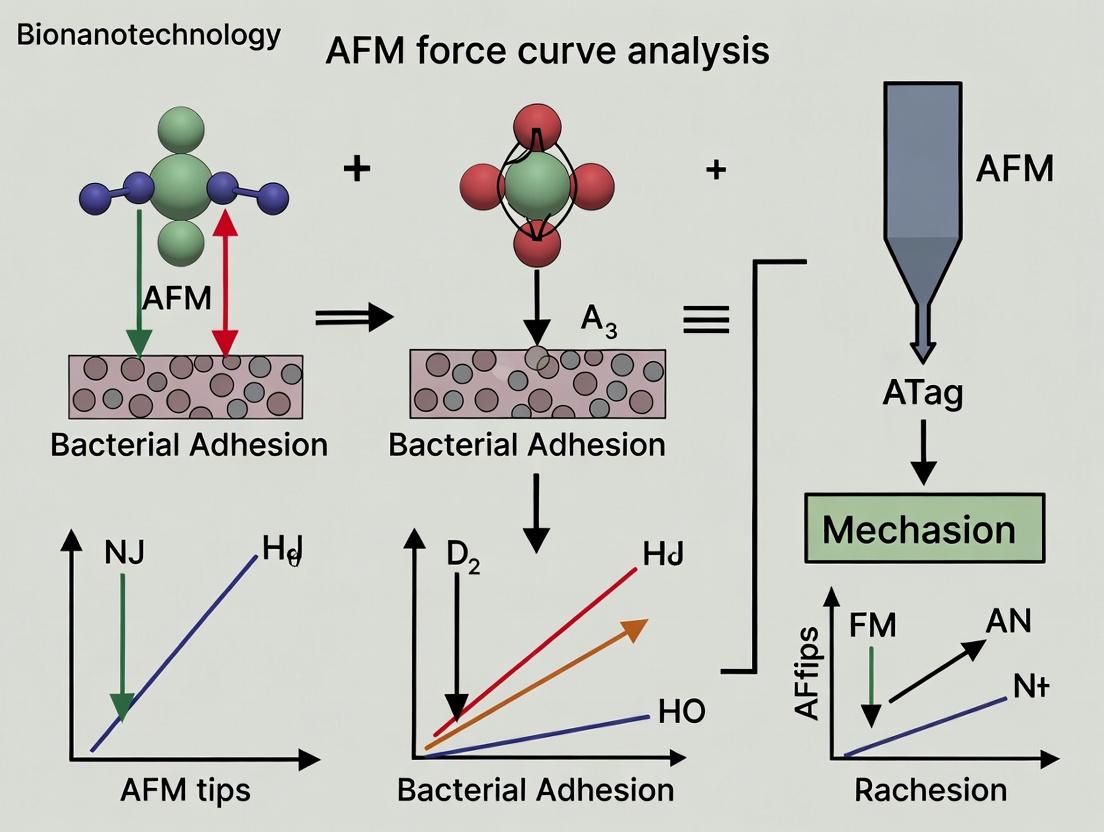
Unlocking Bacterial Adhesion: A Comprehensive Guide to AFM Force Curve Analysis
This article provides a detailed technical guide on using Atomic Force Microscopy (AFM) force spectroscopy to quantitatively analyze bacterial adhesion.
Unlocking Bacterial Adhesion: A Comprehensive Guide to AFM Force Curve Analysis
Abstract
This article provides a detailed technical guide on using Atomic Force Microscopy (AFM) force spectroscopy to quantitatively analyze bacterial adhesion. It covers fundamental principles of AFM and bacterial surface interactions, step-by-step methodologies for live-cell and substrate experiments, solutions to common experimental challenges, and validation techniques to ensure data reliability. Aimed at researchers and drug development professionals, it synthesizes current best practices to enable precise measurement of adhesion forces, critical for understanding biofilm formation, antimicrobial surface design, and developing anti-fouling strategies.
Understanding the Basics: The Science Behind AFM Force Curves and Bacterial Surfaces
Atomic Force Microscopy (AFM) Force Spectroscopy is a pivotal technique in biophysical research, enabling the quantitative measurement of interaction forces at the nanoscale. Within the context of bacterial adhesion research, this method is indispensable for probing the fundamental forces governing bacterial attachment to surfaces, a critical step in biofilm formation, infection, and antimicrobial surface design. By converting cantilever deflection into force-distance curves, researchers can dissect the contributions of specific adhesins (e.g., fimbriae), surface polymers, and receptor-ligand pairs to overall adhesion strength, informing drug and material development.
Fundamental Principles: From Deflection to Force
The core measurement is the cantilever's vertical deflection (d), detected via a laser beam reflected onto a photodetector. The force (F) is calculated using Hooke's Law: F = -k * d where k is the cantilever's spring constant. As the piezoelectric scanner extends and retracts the sample, the deflection vs. scanner position (D-Z) data is recorded and converted into a Force-Distance (F-D) curve.
Key Parameters in Bacterial Adhesion F-D Curves:
- Contact Region: Indicates bacterial cell deformation upon contact.
- Adhesion Pull-off Force: The minimum force during retraction, quantifying the strength of adhesion.
- Adhesion Work/Energy: The area under the retraction curve's adhesion peak.
- Rupture Length: The distance at which adhesion breaks, indicating tether elasticity.
Quantitative Data in Bacterial Adhesion Studies
Table 1: Representative AFM Force Spectroscopy Data for Bacterial Adhesion
| Bacterial Strain / System | Measured Adhesion Force (pN) | Spring Constant (N/m) | Key Adhesion Molecule | Reference Context |
|---|---|---|---|---|
| Staphylococcus aureus on fibronectin | 50 - 200 | 0.01 - 0.06 | Fibronectin-binding proteins (FnBPs) | Single-molecule interaction range |
| Escherichia coli (Type 1 fimbriae) on mannose | 50 - 150 | 0.02 - 0.1 | FimH lectin | Specific ligand-receptor binding |
| Pseudomonas aeruginosa on hydrophobic surface | 300 - 800 | 0.05 - 0.2 | Surface-associated EPS | Non-specific, hydrophobic interactions |
| Lactobacillus on intestinal epithelium | 100 - 400 | 0.01 - 0.05 | Mucus-binding proteins | Probiotic adhesion studies |
Table 2: Common AFM Probe Types for Bacterial Research
| Probe Type | Tip Functionalization | Typical Use Case | Advantages |
|---|---|---|---|
| Silicon Nitride (Si₃N₄) | Colloidal particle (bacterial cell) | Single-cell probe | Measures whole-cell adhesion; well-defined contact area |
| Sharp Silicon Tip | Covalent linker (protein, ligand) | Single-molecule force spectroscopy (SMFS) | High spatial resolution; maps specific receptors |
| Tipless Cantilever | Glued single bacterium | Cell-surface interaction | Direct measurement with native bacterial orientation |
Experimental Protocols
Protocol 1: Preparing a Single-Bacterium Probe
Objective: Attach a single, live bacterium to a tipless cantilever to function as a force probe.
- Cantilever Preparation: Clean a tipless cantilever (e.g., NP-O10, Bruker) in UV-ozone for 15 minutes.
- Polymeric Adhesive Coating: Apply a thin layer of a non-toxic, viscous adhesive (e.g., 0.1% polyethyleneimine (PEI) in PBS or a commercial Cell-Tak solution) to the cantilever end using a micro-manipulator.
- Bacterial Attachment: Under optical microscope guidance, gently touch the coated cantilever to a single bacterium selected from a washed, dense culture on an agarose pad. Visually confirm single-cell attachment.
- Curing & Transfer: Allow the adhesive to cure for 5-10 minutes in a humid chamber. Transfer the functionalized probe to the AFM liquid cell containing the desired measurement buffer (e.g., PBS, growth medium).
Protocol 2: Acquiring Force-Distance Curves on a Bacterial Lawn
Objective: Measure adhesion forces between a functionalized probe and a lawn of surface-grown bacteria.
- Sample Preparation: Grow the target bacterial strain on a suitable substrate (e.g., poly-L-lysine coated glass slide, filter membrane) to form a confluent monolayer. Rinse gently with measurement buffer.
- AFM Setup: Mount the sample in the fluid cell. Engage the functionalized probe (from Protocol 1 or a ligand-coated probe) in contact mode under low setpoint.
- Parameter Setting: Set force curve parameters: extend/retract speed: 0.5 - 1 µm/s; trigger threshold (deflection): 0.5 - 1 V; sampling points: 1024 - 4096; number of curves per location: ≥100.
- Mapping: Acquire grids of force curves (e.g., 16x16) across multiple, random locations on the bacterial lawn to account for heterogeneity.
- Control: Always perform control experiments with a bare probe or in the presence of a competitive inhibitor (e.g., free mannose for FimH studies).
Data Analysis Workflow
Diagram Title: AFM Force Curve Analysis Workflow for Bacterial Adhesion
The Scientist's Toolkit: Research Reagent Solutions
Table 3: Essential Materials for AFM Bacterial Adhesion Studies
| Item / Reagent | Function & Role in Experiment | Key Considerations |
|---|---|---|
| Tipless Cantilevers (e.g., NP-O10, MLCT-O10) | Base for creating a single-cell probe. Low spring constant suitable for soft biological samples. | Spring constant must be calibrated (thermal tune). Material should be inert in liquid. |
| Polyethyleneimine (PEI) or Cell-Tak | Polycationic glue for attaching negatively charged bacterial cells to the cantilever. | Concentration must be optimized to be strong yet non-toxic to the cell. |
| PBS Buffer (1x, pH 7.4) | Standard physiological medium for force measurements. Maintains ionicity and osmolarity. | Always filter (0.22 µm) to remove particulates that can contaminate the tip. |
| Competitive Inhibitors (e.g., D-mannose, antibodies) | Used in control experiments to block specific interactions and confirm bond identity. | Must be soluble and pure. Pre-incubation times should be standardized. |
| Calibration Gratings (e.g., TGXYZ1, PG) | For verifying scanner movement and tip geometry. Essential for accurate distance measurement. | Use before and after a series of biological experiments. |
| Software for Analysis (e.g., SPIP, AtomicJ, custom Igor/Matlab scripts) | Processes raw deflection data, extracts adhesion parameters, and performs statistical analysis. | Must allow batch processing for high-throughput data sets common in adhesion studies. |
This Application Note details protocols for investigating key bacterial surface components—extracellular polymeric substances (EPS), pili, and lipopolysaccharides (LPS)—within a thesis framework utilizing Atomic Force Microscopy (AFM) force curve analysis. These components are primary determinants of bacterial adhesion, a critical process in biofilm formation, host colonization, and antimicrobial resistance. Quantitative nanomechanical mapping via AFM provides direct, single-cell, and single-molecule insights into the adhesive roles of these structures, informing targeted therapeutic strategies.
Research Reagent Solutions Toolkit
| Item Name | Function in Experiment |
|---|---|
| AFM Cantilevers (MLCT-BIO) | Silicon nitride tips with specified spring constants for force spectroscopy in liquid. |
| Poly-L-lysine Coated Substrata | Provides a stable, positively charged surface for transient bacterial immobilization for AFM. |
| Lipopolysaccharide (LPS) Isolation Kit (e.g., TRIzol-based) | For extracting and purifying LPS from Gram-negative bacterial membranes for functionalization. |
| Type IV Pili Mutant Bacterial Strains | Isogenic mutants lacking specific pili for comparative adhesion force measurements. |
| EPS-Specific Enzymes (e.g., Dispersin B, Proteinase K) | Enzymatically degrades specific EPS components to dissect their contribution to adhesion. |
| Phosphate Buffered Saline (PBS), 1X, pH 7.4 | Physiological buffer for maintaining bacterial viability during AFM measurements. |
| Functionalized Beads (e.g., carboxylate, mannose) | Covalently attached to cantilevers to probe specific ligand-receptor interactions (e.g., lectin-EPS). |
| Force Calibration Specimen (e.g., clean glass) | Used for calibrating the AFM photodetector sensitivity prior to bacterial experiments. |
Table 1: Representative Adhesion Forces Measured by AFM for Key Surface Components.
| Surface Component | Target Surface | Mean Adhesion Force (pN) | Interaction Distance (nm) | Key Molecular Partner |
|---|---|---|---|---|
| EPS (Polysaccharides) | Hydrophobic substrate | 250 - 1000 | 50 - 200 | Surface proteins / abiotic surfaces |
| Type I Pili | Mannosylated surface | 50 - 200 | 20 - 30 | FimH / host glycoproteins |
| Type IV Pili | Abiotic surface / cells | 50 - 150 | 500 - 2000 | PilY1 / surface receptors |
| Lipopolysaccharide (LPS) | Cationic surface / LBPs | 50 - 400 | 5 - 40 | Cations / LPS-binding proteins |
Experimental Protocols
Protocol 4.1: AFM Tip Functionalization for Specific Component Probing
Objective: To functionalize AFM cantilevers with ligands or substrates to probe specific bacterial surface component interactions.
Materials: MLCT-BIO cantilevers, 2% v/v (3-Aminopropyl)triethoxysilane (APTES) in toluene, 0.5% v/v glutaraldehyde in PBS, target ligand (e.g., mannose for FimH), 1M ethanolamine hydrochloride (pH 8.5), PBS buffer.
Procedure:
- Cantilever Cleaning: Plasma clean cantilevers for 5 minutes.
- Aminosilanzation: Immerse tips in APTES solution for 2 hours, rinse with toluene and ethanol, dry under N₂.
- Cross-linker Activation: Incubate tips in glutaraldehyde solution for 30 minutes. Rinse with PBS.
- Ligand Coupling: Incubate cantilevers in 1 mg/mL ligand solution for 1 hour.
- Quenching: Deactivate remaining aldehyde groups with ethanolamine for 10 minutes.
- Final Rinse & Storage: Rinse with PBS and store in PBS at 4°C until use (within 48 hours).
Protocol 4.2: Single-Bacterium Probe Preparation for Whole-Cell Adhesion Mapping
Objective: To immobilize a single living bacterium onto an AFM cantilever for force spectroscopy against defined substrates.
Materials: Bacterial culture (late log phase), poly-L-lysine coated glass slide, CellTak adhesive, AFM cantilevers (tipless, reflective side coated), PBS buffer, fluorescence microscope.
Procedure:
- Bacterial Fixation: Apply 2 µL of concentrated bacterial suspension to a poly-L-lysine slide for 10 minutes. Gently rinse with PBS to remove non-adherent cells.
- Cantilever Preparation: Apply a minute droplet (~0.5 µL) of CellTak to the apex of a tipless cantilever.
- Single-Cell Attachment: Carefully position the cantilever over a single, isolated bacterium using the AFM optical microscope. Gently lower until contact is made and retract. Hold for 30 seconds to ensure adhesion.
- Validation: Validate single-cell attachment using light or fluorescence microscopy.
- Measurement: Immediately use the prepared probe for force-curve acquisition in the desired buffer.
Protocol 4.3: Enzymatic Dissection of EPS Contribution to Adhesion
Objective: To quantify the specific contribution of EPS polysaccharides or proteins to overall adhesion force.
Materials: Bacterial culture, AFM with single-bacterium probe, Dispersin B (for PNAG polysaccharides), Proteinase K (for proteins), substrate of interest (e.g., epithelial cells, medical-grade polymer).
Procedure:
- Baseline Measurement: Using a single-bacterium probe, acquire ≥500 force-distance curves on the target substrate at multiple locations.
- Enzymatic Treatment: Incubate the substrate-bound bacteria (or the probe bacterium) with the specific enzyme (e.g., 100 µg/mL Dispersin B in PBS) for 30 minutes at 37°C.
- Post-Treatment Measurement: Without dislodging the sample, repeat force-curve acquisition (≥500 curves) under identical conditions.
- Data Analysis: Compare the adhesion force histograms and adhesion event frequencies before and after treatment using statistical tests (e.g., Mann-Whitney U test). A significant reduction pinpoints the component's role.
Visualization of Experimental and Analytical Workflows
Title: AFM Bacterial Adhesion Research Workflow
Title: Surface Components & Their AFM-Measured Adhesive Roles
Within the broader thesis of Atomic Force Microscopy (AFM) force curve analysis for bacterial adhesion research, the precise interpretation of the force-distance curve is foundational. This analysis is critical for quantifying pathogen-surface interactions, evaluating antibiofilm coatings, and screening antimicrobial agents. Defining the discrete mechanical events during probe approach, adhesion, and retraction transforms raw data into quantitative parameters that describe adhesion strength, elasticity, and interaction work, directly informing drug and material development.
Key Events in a Force-Distance Curve
A standard force curve records the cantilever deflection (force) as a function of the piezoelectric scanner’s vertical position (Z-piezo displacement). The cycle comprises two phases: Approach and Retraction, each with characteristic events.
Table 1: Quantitative Parameters Extracted from Force Curve Events
| Phase | Event | Measured Parameter | Physical/Biological Significance | Typical Range (Bacterial Adhesion) |
|---|---|---|---|---|
| Approach | Non-contact | Baseline Deflection | System thermal noise, drift. | ± 5-20 pN |
| Contact Point | Slope (k) | Sample stiffness (elastic modulus). | 0.01 - 1 N/m (for cells) | |
| Retraction | Adhesion Plateau | Adhesion Work (W) | Total energy of interaction. | 10 - 1000 kBT |
| Jump-out Events | Rupture Length (L) | Length of stretched polymers (e.g., pili, EPS). | 50 - 1000 nm | |
| Final Detachment | Adhesion Force (Fadh) | Maximum unbinding force; ligand-receptor bond strength. | 50 pN - 10 nN |
Detailed Experimental Protocols
Protocol 1: Measuring Bacterial Adhesion on Coated Surfaces
- Objective: Quantify the adhesion force of Staphylococcus aureus on a novel hydrophilic polymer coating.
- Materials: See "Scientist's Toolkit" below.
- Procedure:
- Probe Functionalization: Immerse a tipless, gold-coated AFM cantilever (k ≈ 0.1 N/m) in 1 mM 11-mercaptoundecanoic acid (MUDA) ethanol solution for 16 hrs. Rinse with ethanol and PBS.
- Bacterial Probe Preparation: Activate carboxyl groups on the cantilever with EDC/NHS chemistry for 15 min. Immediately attach a single, glutaraldehyde-fixed S. aureus cell (from log-phase culture) using a micromanipulator under optical microscope. Incubate for 30 min. Quench with 1M ethanolamine-HCl.
- Sample Preparation: Spin-coat the test polymer onto a clean glass slide. Sterilize under UV for 30 min.
- AFM Measurement: Mount the sample and bacterial probe in the AFM fluid cell with PBS buffer (pH 7.4). Approach the surface at 500 nm/s. At each of 100 random points, record a force curve with a trigger force of 1 nN and a pause of 0.5s at maximum load.
- Data Analysis: Use dedicated software (e.g., JPKSPM, Asylum, or custom Igor Pro scripts) to automatically detect the baseline, contact point, and adhesion events. Batch-process to extract Fadh and rupture length for all curves. Plot histograms and calculate mean ± SD.
Protocol 2: Single-Molecule Force Spectroscopy (SMFS) of Bacterial Adhesins
- Objective: Measure the specific unbinding force between a P. aeruginosa pilus protein (PilA) and its receptor.
- Procedure:
- Ligand Immobilization: Coat a glass substrate with a PEG-biotin linker. Incubate with NeutrAvidin (0.1 mg/mL, 10 min), followed by biotinylated receptor protein (10 µg/mL, 30 min).
- Tip Functionalization: Cantilevers (k ≈ 0.02 N/m) are incubated with PEG-benzaldehyde linkers, then reacted with an amine-terminated PilA peptide via Schiff base formation.
- Specificity Control: Force mapping is performed in buffer, then repeated with a solution containing 1 mM soluble receptor as a competitive inhibitor.
- SMFS Acquisition: Use a very low trigger force (~50 pN) and high retraction speed (1000 nm/s) to maximize single-bond events. Collect >1000 curves per condition.
- Analysis: Identify specific binding events by their disappearance in the inhibition control. Use Worm-Like Chain (WLC) model fits to the retraction curves to confirm polymer stretching. Construct force histograms to determine the characteristic unbinding force.
The Scientist's Toolkit: Key Research Reagent Solutions
Table 2: Essential Materials for AFM Bacterial Adhesion Studies
| Item | Function/Description | Example Product/Chemical |
|---|---|---|
| Functionalized Cantilevers | Probes with specific chemistry for cell attachment or ligand coupling. | MLCT-O10 (Bruker, for cell probes), CSC38/tipless (MicroMasch, for functionalization). |
| Crosslinker Chemistry | Covalently links biomolecules to AFM tips or substrates. | EDC (1-ethyl-3-(3-dimethylaminopropyl)carbodiimide) / NHS (N-hydroxysuccinimide). |
| PEG Spacers | Flexible molecular tethers for SMFS; reduce non-specific adhesion. | Heterobifunctional PEG (e.g., NHS-PEG-Acetal). |
| Bio-Reactive Surfaces | Substrates for controlled ligand or coating immobilization. | NeutrAvidin-coated slides, gold-coated coverslips for thiol chemistry. |
| Fixative Agent | Gently stabilizes bacterial cells on the cantilever without destroying surface proteins. | 0.5-1% Glutaraldehyde in PBS (short incubation). |
| Blocking Agents | Reduce non-specific binding in SMFS experiments. | Bovine Serum Albumin (BSA, 1% w/v), casein, ethanolamine. |
| Calibration Kit | Essential for converting cantilever deflection (V) to force (nN). | Calibrated cantilevers with known spring constant, or colloidal probe for direct method. |
Within the framework of a doctoral thesis on Atomic Force Microscopy (AFM) force curve analysis of bacterial adhesion, understanding the fundamental models governing cell-surface interactions is paramount. AFM provides direct, nanoscale force measurements that allow researchers to deconvolute the complex interplay of forces described by classical theories and differentiate between specific (e.g., ligand-receptor) and non-specific (e.g., electrostatic, van der Waals) interactions. This application note synthesizes current models and provides protocols for their experimental investigation via AFM.
Core Theoretical Models
DLVO Theory
The Derjaguin-Landau-Verwey-Overbeek (DLVO) theory describes the non-specific interaction between two surfaces in a liquid medium as the sum of van der Waals (vdW) attraction and electrostatic double-layer (EDL) repulsion/attraction.
Key Equations:
- Total Interaction Energy (UDLVO): UDLVO(d) = UvdW(d) + UEDL(d)
- van der Waals (vdW) Energy for a sphere (bacterium) of radius R near a flat surface: UvdW(d) = - (AH * R) / (6d), where AH is the Hamaker constant and d is the separation distance.
- Electrostatic Double Layer (EDL) Energy under constant potential approximation: UEDL(d) ≈ πε0εrR(2ψ1ψ2 ln[(1+exp(-κd))/(1-exp(-κd))] + (ψ12+ψ22) ln[1-exp(-2κd)]), where ψ is surface potential, κ-1 is the Debye length (screening length).
Table 1: Typical Parameter Ranges for Bacterial Adhesion in Aqueous Media
| Parameter | Symbol | Typical Range for Bacteria | Notes |
|---|---|---|---|
| Hamaker Constant | AH | 0.1 - 10 × 10-21 J | Depends on cell surface composition, medium. |
| Surface Potential | ψ | -5 to -50 mV | Measured via zeta potential; highly pH/ionic strength dependent. |
| Debye Length | κ-1 | 0.3 - 30 nm | Decreases with increasing ionic strength (I). For 1:1 electrolyte: κ-1 (nm) ≈ 0.304 / √I (M). |
| Interaction Distance | d | 0 - 100 nm | Primary minimum (strong adhesion) often < 1 nm; secondary minimum (weak adhesion) at 5-15 nm. |
Specific vs. Non-Specific Interactions
Non-specific interactions are governed by DLVO forces (vdW, EDL) and additional non-DLVO forces such as hydrophobic interactions, hydration forces, and steric interactions due to surface polymers. Specific interactions involve lock-and-key molecular recognition, e.g., between a bacterial adhesin (ligand) and a host surface receptor (e.g., lectin-carbohydrate, protein-protein binding). These are characterized by high affinity, saturability, and selectivity.
Table 2: Distinguishing Features in AFM Force Spectroscopy
| Feature | Non-Specific (DLVO-type) | Specific (Ligand-Receptor) |
|---|---|---|
| Force-Distance Profile | Monotonic or smoothly decaying; often long-range. | Characteristic "unbinding" event with a nonlinear rupture peak. |
| Adhesion Probability | Broadly distributed, varies with medium conditions. | Increases with contact time/force; can be blocked by free ligands. |
| Adhesion Force Magnitude | Continuously varies with distance/conditions. | Quantized, corresponding to single or multiple bond ruptures. |
| Dependence on Ionic Strength | Strong: Adhesion increases at high I (screening). | Weak or indirect (via conformation changes). |
Experimental Protocols
Protocol 1: Probing Non-Specific (DLVO) Interactions via AFM
Objective: To measure the effect of ionic strength on non-specific adhesion forces between a bacterial probe and an abiotic substrate. Materials: See Scientist's Toolkit below. Method:
- Bacterial Probe Preparation: Immobilize a live bacterium or a cell-sized polystryrene bead onto a tipless AFM cantilever using a bio-compatible epoxy or polyethyleneimine (PEI). Calibrate the cantilever sensitivity and spring constant.
- Substrate Preparation: Use a clean, flat model surface (e.g., mica, glass, or tissue-culture treated polystyrene).
- Buffer System Preparation: Prepare a series of phosphate-buffered saline (PBS) or KCl solutions with varying ionic strengths (e.g., 1 mM, 10 mM, 150 mM, 500 mM). Adjust pH to 7.4.
- AFM Force Volume/Curve Acquisition:
- Mount the probe and substrate in the fluid cell.
- For each buffer condition, acquire a minimum of 1000 force-distance curves over a 5x5 μm grid.
- Set approach/retract velocity between 0.5-1 μm/s, trigger force ~250-500 pN.
- Allow 5-10 minutes for equilibration after buffer exchange.
- Data Analysis:
- Use analysis software (e.g., JPKSPM, Asylum, or custom Igor Pro/Matlab scripts) to extract adhesion force (Fadh) and work of adhesion from retraction curves.
- Plot the distribution of Fadh vs. ionic strength.
- Fit the decay of the non-contact portion of the approach curve to derive the Debye length (κ-1).
Protocol 2: Detecting Specific Ligand-Receptor Interactions
Objective: To identify and quantify specific adhesin-receptor bonds using functionalized AFM tips. Materials: See Scientist's Toolkit below. Method:
- Functionalized Probe Preparation:
- Use a sharp, gold-coated cantilever.
- Clean in ethanol/UV-ozone.
- Immerse in a solution of thiolated polyethylene glycol (PEG) linker (e.g., HS-PEG-COOH) to form a self-assembled monolayer.
- Activate terminal carboxyl groups with EDC/NHS chemistry.
- Incubate with purified target receptor protein (e.g., fibronectin, mannose) or the full bacterial adhesin protein. Block with ethanolamine.
- Substrate Preparation: Prepare a complementary surface (e.g., bacterial cell lawn immobilized on poly-L-lysine-coated dish, or a monolayer of the complementary ligand).
- Single-Molecule Force Spectroscopy (SMFS):
- Perform measurements in a physiologically relevant, but ligand-inert buffer (e.g., PBS with 1% BSA).
- Acquire thousands of force curves at fixed positions with varying contact times (1-1000 ms).
- Include control experiments with free ligand in solution (blocking) or using a non-functionalized/mismatched ligand tip.
- Data Analysis:
- Identify specific unbinding events by their characteristic nonlinear force "peak."
- Construct force histograms; peaks at multiples of a unitary force indicate single and multiple bond ruptures.
- Plot adhesion probability vs. contact time to assess binding kinetics.
- Analyze rupture force vs. loading rate (by varying retraction speed) to probe the energy landscape of the bond (Bell-Evans model).
Visualization of Concepts and Workflows
Title: DLVO Energy Composition
Title: AFM Adhesion Data Analysis Workflow
The Scientist's Toolkit: Research Reagent Solutions
Table 3: Essential Materials for AFM-based Bacterial Adhesion Studies
| Item | Function/Description | Example/Brand |
|---|---|---|
| Tipless AFM Cantilevers | Base for creating bacterial or functionalized probes. High flexibility for force sensing. | Bruker MLCT-O10 (for bead/bacteria attachment), NP-O10. |
| Bio-Compatible Epoxy | For firmly attaching live bacteria or beads to tipless cantilevers. | EPON 1004F, Poly-L-lysine-PEG-silane. |
| PEG Crosslinkers | Flexible spacer to link ligands to tips, allowing natural bond dynamics and reducing non-specific adhesion. | HS-(PEG)n-COOH (n=6-24), Maleimide-PEG-NHS. |
| Chemical Coupling Reagents | Activate carboxyl groups for covalent attachment of proteins/ligands to AFM tips. | EDC (1-Ethyl-3-(3-dimethylaminopropyl)carbodiimide) and NHS (N-Hydroxysuccinimide). |
| Model Substrates | Provide atomically flat, well-characterized surfaces for controlled interaction studies. | Muscovite Mica (V1 grade), Gold-coated slides (for thiol chemistry), Silanized glass. |
| Buffer Salts & Modulators | Control ionic strength, pH, and screening length to manipulate DLVO forces. | KCl, PBS, HEPES, Ca2+/Mg2+ salts. |
| Recombinant Adhesins/Receptors | Purified proteins for functionalizing tips/substrates to study specific interactions. | Commercial sources (e.g., R&D Systems) or lab-purified from bacterial cultures. |
| Blocking Agents | Reduce non-specific adsorption on probes and substrates. | Bovine Serum Albumin (BSA, 1-2%), casein, purified milk proteins. |
Within a thesis on AFM force curve analysis of bacterial adhesion, the selection of an appropriate bacterial model and its precise cultivation is the foundational step that determines data relevance and reproducibility. This document provides application notes and protocols to guide researchers in making informed choices and executing standardized preparations for robust AFM-based adhesion studies.
Key Considerations for Model Selection
Bacterial Strain Characteristics
The choice of strain must align with the research hypothesis—whether studying generic adhesion mechanisms, host-pathogen interactions, or biofilm formation in industrial settings.
Growth Conditions
Growth phase and medium composition critically influence the expression of surface adhesins, capsule production, and overall cell surface physicochemistry, directly impacting adhesion forces measured by AFM.
Application Notes: Quantitative Comparison of Common Model Systems
The following table summarizes key parameters for frequently studied bacteria in adhesion research, based on current literature.
Table 1: Model Bacterial Strains for AFM Adhesion Studies
| Species & Common Strain | Relevance to Adhesion Research | Typical Growth Medium | Key Surface Factors Influencing Adhesion | Optimal Harvesting Phase for AFM (OD600) |
|---|---|---|---|---|
| Pseudomonas aeruginosa PAO1 | Study of chronic infections, biofilm formation, and antimicrobial resistance. | Lysogeny Broth (LB) or Tryptic Soy Broth (TSB) | Pili, flagella, alginate capsule, LPS. | Late exponential (0.8 - 1.0) |
| Staphylococcus aureus (e.g., RN4220, Newman) | Medical device-related infections, Gram-positive adhesion dynamics. | Tryptic Soy Broth (TSB) | Cell wall teichoic acids, surface proteins (e.g., SasG), polysaccharide capsule. | Mid-exponential (0.6 - 0.8) |
| Escherichia coli (e.g., K-12, UTI89) | Generic model for Gram-negative adhesion, urinary tract infections. | Lysogeny Broth (LB) | Type 1 fimbriae, curli, outer membrane proteins. | Early stationary (1.0 - 1.2) |
| Lactobacillus rhamnosus GG | Probiotic function, adhesion to intestinal epithelium. | de Man, Rogosa and Sharpe (MRS) broth | Surface-layer proteins, exopolysaccharides. | Late exponential (0.8 - 1.0) |
| Bacillus subtilis 168 | Model for spore formation, biofilm architecture on abiotic surfaces. | Lysogeny Broth (LB) | TasA amyloid fibers, hydrophobins. | Early biofilm (24h growth on plate) |
Detailed Protocols
Protocol 1: Standardized Culture for AFM Sample Preparation
Aim: To produce reproducible, metabolically consistent bacterial lawns for AFM adhesion force mapping.
Materials:
- Frozen glycerol stock of target bacterial strain.
- Appropriate sterile growth medium (see Table 1).
- 37°C shaking incubator (or temperature appropriate for strain).
- Spectrophotometer.
- Centrifuge.
- Phosphate Buffered Saline (PBS), pH 7.4.
- Poly-L-lysine coated glass slides or agarose-coated Petri dishes.
Procedure:
- Inoculation: Using aseptic technique, streak from glycerol stock onto a fresh agar plate. Incubate overnight.
- Starter Culture: Pick a single colony and inoculate 5-10 mL of broth. Incubate with shaking (200 rpm) for ~6 hours or until turbid.
- Dilution & Main Culture: Dilute the starter culture 1:100 into fresh, pre-warmed broth in a baffled flask (culture volume ≤ 20% of flask volume). This ensures proper aeration.
- Growth Monitoring: Monitor optical density at 600 nm (OD600) every 30-60 minutes.
- Harvesting: Harvest cells at the target OD600 specified in Table 1 by centrifugation (5,000 x g, 10 min, 4°C).
- Washing: Gently resuspend the pellet in 10 mL of sterile PBS. Centrifuge again. Repeat wash step twice to remove residual medium and secreted metabolites.
- Final Resuspension: Resuspend the final pellet in PBS or the desired measurement buffer to an OD600 of ~0.5. This provides an ideal cell density for surface immobilization.
- Surface Immobilization: For AFM, immobilize cells on a substrate.
- Method A (Poly-L-lysine): Deposit 20 µL of cell suspension onto a PLL-coated slide for 15 minutes. Gently rinse with buffer to remove loosely attached cells.
- Method B (Agarose): Mix cell suspension with warm, low-melting-point agarose (final conc. 0.5-1.0%) and cast in a Petri dish. This entrapment method is suitable for softer cells or fluid-cell imaging.
Critical Notes: Always prepare fresh cultures for AFM experiments. The growth phase is critical; cells in the death phase exhibit altered surface properties and auto-aggregation.
Protocol 2: AFM Probe Functionalization for Specific Ligand-Binding Studies
Aim: To covalently attach specific biomolecules (e.g., proteins, carbohydrates) to AFM cantilevers for single-molecule or single-cell force spectroscopy.
Materials:
- Silicon nitride AFM cantilevers (e.g., MLCT-Bio-DC from Bruker).
- Ethanol (absolute).
- (3-Aminopropyl)triethoxysilane (APTES).
- Toluene (anhydrous).
- Phosphate Buffered Saline (PBS), pH 7.4.
- Polyethylene glycol (PEG) crosslinker (e.g., NHS-PEG-NHS from Nanoscience Solutions).
- N,N-Dimethylformamide (DMF), anhydrous.
- Target ligand (e.g., fibronectin, collagen, mannose).
- Ethanolamine hydrochloride (1M, pH 8.5).
Procedure:
- Cantilever Cleaning: Sonicate cantilevers in ethanol for 10 minutes. Dry under a stream of clean nitrogen or argon.
- Aminosilanzation: Expose cantilevers to vapor-phase APTES in a vacuum desiccator for 2 hours. This creates a surface amine (-NH2) layer.
- Crosslinker Attachment: Prepare a 1-10 mM solution of NHS-PEG-NHS crosslinker in anhydrous DMF. Incubate the amino-functionalized cantilevers in this solution for 2 hours at room temperature. The NHS esters react with surface amines.
- Ligand Coupling: Wash cantilevers briefly in DMF, then in PBS. Immediately incubate in a 10-100 µg/mL solution of the target ligand in PBS for 1 hour. The free NHS end of the PEG spacer reacts with primary amines on the ligand.
- Quenching: To deactivate any remaining reactive esters, incubate cantilevers in 1M ethanolamine (pH 8.5) for 10 minutes.
- Rinsing & Storage: Rinse thoroughly with PBS. The functionalized probes can be used immediately or stored in PBS at 4°C for up to 24 hours.
Visualizing Experimental Workflow and Key Pathways
Title: Workflow for AFM Bacterial Adhesion Experiment
Title: Adhesin Expression Pathway Impact on AFM
The Scientist's Toolkit: Essential Research Reagents & Materials
Table 2: Key Reagent Solutions for AFM Bacterial Adhesion Studies
| Item | Function in Experiment | Key Consideration |
|---|---|---|
| Silicon Nitride AFM Probes (MLCT-Bio) | The sensor for force measurement. Tip geometry and spring constant must be calibrated. | Choose spherical tips (for whole-cell adhesion) or sharp tips (for single-molecule). |
| Poly-L-Lysine Solution (0.01% w/v) | Positively charged coating for electrostatic immobilization of bacterial cells on glass/mica. | Coating time must be optimized to avoid multi-layer formation that affects cell height. |
| Low-Melting-Point Agarose (1-2%) | For gentle entrapment of cells, preserving viability and native surface structure during fluid-cell AFM. | Concentration determines gel stiffness, which must allow tip penetration to the cell surface. |
| PBS or Measurement Buffer (e.g., RPMI-1640) | Liquid environment for AFM experiments. Maintains physiological pH and ion concentration. | Buffer must be filtered (0.22 µm) to remove particulates that contaminate the AFM tip. |
| NHS-PEG-NHS Crosslinker | Heterobifunctional spacer for covalent, oriented ligand attachment to AFM tips. | PEG length (e.g., 6 nm, 20 nm) determines ligand accessibility and reduces non-specific adhesion. |
| Ethanolamine (1M, pH 8.5) | Quenching agent to block unreacted NHS esters after probe functionalization. | Prevents non-specific binding of biomolecules during subsequent force measurements. |
| Live/Dead BacLight Bacterial Viability Kit | To confirm cell viability before and after AFM experiments. | Ensures measured forces reflect properties of living cells, not artifacts from dead cells. |
| Glutaraldehyde (2% v/v) | Fixative for control experiments requiring rigid, non-viable cells. | Alters surface mechanics but can be useful for isolating specific chemical interactions. |
Step-by-Step Protocols: From Probe Functionalization to Data Acquisition
Within the context of atomic force microscopy (AFM) force curve analysis for bacterial adhesion research, the selection and functionalization of the AFM probe is the critical experimental variable determining data specificity and biological relevance. This protocol details optimized methodologies for preparing probes to interrogate interactions with live bacteria, secreted biopolymers, and engineered coated surfaces, enabling quantitative measurements of adhesion forces.
Probe Selection Guide
The base probe determines mechanical properties and initial surface chemistry.
Table 1: AFM Probe Selection for Different Targets
| Target System | Recommended Cantilever Type | Typical Spring Constant (k) | Tip Geometry | Rationale |
|---|---|---|---|---|
| Live Bacteria (single cell) | Silicon Nitride (Si₃N₄), tipless | 0.01 - 0.06 N/m | Colloidal probe (2-5 µm sphere) | Low force constant minimizes cell damage; sphere mimics natural contact geometry. |
| Bacterial Surface Proteins (e.g., adhesins) | Silicon (Si), contact mode | 0.1 - 0.6 N/m | Sharp tip (R ≈ 20 nm) | Higher resolution for molecular mapping; stiffer lever for protein unfolding. |
| Biopolymer Matrices (e.g., EPS, biofilms) | Silicon, soft triangular | 0.15 - 0.4 N/m | Sharp or four-sided pyramid | Balanced stiffness for penetrating soft matrix without full substrate contact. |
| Coated Surfaces (e.g., antimicrobial coatings) | Silicon, high frequency | 0.7 - 4 N/m | Sharp tip (R < 10 nm) | High stiffness and resolution for measuring nanoscale coating properties and adhesion. |
Probe Functionalization Protocols
Protocol 2.1: Covalent Functionalization with Silane-PEG-NHS Linkers (For Biomolecule Tethering)
This method is ideal for attaching specific proteins (e.g., ligands, antibodies) or single bacteria to a probe.
Materials:
- Tipless or colloidal AFM cantilever (Si or Si₃N₄).
- (3-Aminopropyl)triethoxysilane (APTES).
- Heterobifunctional Polyethylene glycol (PEG) linker (e.g., NHS-PEG-SCM, 5-8 kDa).
- Target biomolecule (e.g., fibronectin, concanavalin A, purified adhesin).
- Anhydrous toluene, phosphate-buffered saline (PBS, pH 7.4).
Procedure:
- Probe Cleaning: Plasma clean probe for 2-5 minutes to generate hydroxyl groups.
- Aminosilanzation: Vapor-phase or liquid-phase deposition of APTES. For liquid, immerse probe in 2% APTES in anhydrous toluene for 2 hours. Rinse with toluene and ethanol, then cure at 110°C for 10 min.
- PEG Linker Attachment: Incubate amino-functionalized probe in 1-5 mM NHS-PEG-SCM linker in chloroform for 1-2 hours. Wash thoroughly with chloroform and ethanol.
- Biomolecule Conjugation: Activate the NHS end of the PEG linker by immersing in PBS. Immediately incubate with 0.1-1 mg/mL of the target biomolecule in PBS for 30-60 minutes at room temperature or 4°C overnight.
- Quenching & Storage: Quench unreacted NHS esters with 1 M ethanolamine hydrochloride (pH 8.5) for 10 min. Rinse with PBS and use immediately or store at 4°C in PBS for short-term use.
Protocol 2.2: Direct Microbial Probe Preparation (Single-Cell Probe)
This protocol attaches a single live bacterium to a tipless, functionalized cantilever.
Materials:
- Tipless, V-shaped cantilever (k ≈ 0.02-0.1 N/m).
- Poly-L-lysine (PLL, 0.1% w/v) or Cell-Tak.
- UV-curable glue (optional, for some methods).
- Bacterial culture in mid-exponential growth phase.
Procedure:
- Cantilever Coating: Apply a thin layer of PLL or Cell-Tak to the end of the cantilever. Allow to air-dry for 5-10 minutes.
- Bacterial Immobilization: Place a 10 µL droplet of washed bacterial suspension on a glass slide. Using a micromanipulator under an optical microscope, gently touch the coated cantilever end to a single, well-isolated cell. Hold for 30-60 seconds to allow adhesion.
- Fixation (Optional): For stronger attachment, a minute amount of UV glue can be applied near the cell-cantilever contact point prior to picking up the cell.
- Validation: Rinse carefully in appropriate buffer and immediately image the probe under light microscopy to confirm single-cell attachment and orientation.
Protocol 2.3: Functionalization for Hydrophobic/Electrostatic Interactions
For measuring non-specific interactions with coated surfaces or biopolymers.
Materials:
- Appropriate AFM probe (see Table 1).
- Alkanethiols (for gold-coated probes) or silanes with desired terminal groups (CH₃, COOH, NH₂).
- Ethanol, ultrapure water.
Procedure:
- Gold Coating: If using thiol chemistry, first apply a 5 nm Cr adhesion layer followed by a 30 nm Au layer to the probe via sputter/evaporation.
- Self-Assembled Monolayer (SAM) Formation: Immerse gold-coated probe in 1 mM solution of the desired alkanethiol (e.g., 1-octadecanethiol for hydrophobic CH₃, or 11-mercaptoundecanoic acid for COOH) in ethanol for 12-24 hours.
- Silane Treatment for Si/Si₃N₄: For methyl groups, immerse in 1% trichloro(1H,1H,2H,2H-perfluorooctyl)silane in hexane for 30 min. For charged groups, use appropriate silane (e.g., APTES for NH₂+).
- Rinsing: Rinse thoroughly with solvent (ethanol/hexane) followed by water to remove unbound molecules.
The Scientist's Toolkit: Research Reagent Solutions
Table 2: Essential Materials for Probe Functionalization
| Item | Function & Application |
|---|---|
| Si₃N₄ Tipless Cantilevers | Base for single-cell and colloidal probe attachment. Biocompatible and low spring constant. |
| Silicon Nitride Colloidal Probes (5 µm SiO₂ spheres) | Pre-fabricated probes for consistent, reproducible contact geometry on soft samples. |
| Heterobifunctional PEG Linkers (NHS-PEG-maleimide/SCM) | Flexible tether for biomolecule coupling. Reduces non-specific adhesion and allows free movement. |
| (3-Aminopropyl)triethoxysilane (APTES) | Provides reactive primary amine (-NH₂) groups on silicon-based surfaces for further conjugation. |
| Cell-Tak | Commercial adhesive protein mixture derived from mussels. Excellent for immobilizing live cells. |
| 1-Octadecanethiol | Forms hydrophobic self-assembled monolayer (SAM) on gold-coated probes to mimic inert or hydrophobic surfaces. |
| 11-Mercaptoundecanoic Acid | Forms negatively charged carboxyl-terminated SAM on gold for electrostatic interaction studies. |
| UV-Curable Adhesive | Fast-curing glue for securing bacteria or particles under optical control. |
| Plasma Cleaner | Essential for activating probe surfaces, removing contaminants, and generating hydroxyl groups for silanization. |
Data Acquisition & Analysis Considerations
- Force Curve Volume: Acquire ≥ 1000 force curves per sample condition to ensure statistical power.
- Approach/Retract Speed: Typically 500-1000 nm/s for single cells (to avoid hydrodynamic drag); 100-500 nm/s for single molecules.
- Buffer Control: Always perform control measurements in relevant buffer using a non-functionalized or differently functionalized probe.
- Adhesion Force Analysis: Use dedicated software (e.g., JPKSPM, AtomicJ, custom Igor Pro/Matlab scripts) to batch-process curves, detect adhesion events, and compile force histograms.
Visualization of Experimental Workflows
Title: AFM Probe Preparation Workflow for Bacterial Adhesion Studies
Title: Biomolecule Covalent Attachment via PEG Linker
The accurate quantification of bacterial adhesion forces via Atomic Force Microscopy (AFM) force curve analysis is a cornerstone of modern microbiological research. The broader thesis investigates the nanomechanical interactions governing bacterial adhesion to abiotic surfaces and host tissues, with implications for biofilm formation, infection, and antimicrobial surface design. The single most critical variable in obtaining reliable, biologically relevant force data is the initial sample preparation: the immobilization of live, viable bacteria onto a substrate in a manner that preserves their native surface architecture, physiology, and adhesive properties. This document outlines current, optimized protocols for bacterial immobilization, ensuring viability for subsequent AFM analysis.
Key Immobilization Techniques: Principles & Viability Assessment
The choice of immobilization technique is dictated by bacterial species (Gram-positive vs. Gram-negative), surface structure (e.g., presence of capsule, pili), and the specific research question. The overarching principle is to achieve firm attachment without chemically or physically altering the cell envelope.
Table 1: Comparison of Live Bacterial Immobilization Techniques for AFM
| Technique | Mechanism of Adhesion | Optimal For | Viability Preservation (%)* | Key Advantage | Key Limitation |
|---|---|---|---|---|---|
| Physical Trapping (Porous Membranes) | Entrapment in pores (0.2-0.6 µm) | Non-adherent cells, planktonic state analysis | >95% | Minimal chemical interaction, allows nutrient exchange. | Risk of cell damage during trapping, limited to flat cells or small cocci. |
| Poly-L-Lysine (PLL) Coating | Electrostatic interaction between cationic polymer and anionic cell surface. | Most Gram-positive and Gram-negative bacteria. | 85-95% | Simple, rapid, and widely applicable. | Can alter surface charge, potential for sub-membrane leakage. |
| Gelatin or Agarose Coating | Hydrophobic & hydrophilic entrapment in a thin hydrogel layer. | Delicate, motile, or capsule-forming bacteria. | 90-98% | Excellent viability, maintains hydration, mimics soft substrates. | Can increase background noise in AFM; thickness must be controlled. |
| Covalent Linkage (e.g., APTES-GA) | Silane (APTES) functionalization followed by glutaraldehyde (GA) cross-linking. | Extremely firm attachment required for repeated force mapping. | 70-85% | Very strong, irreversible attachment. | GA is cytotoxic; can cross-link and rigidify surface proteins. |
| Bio-specific Immobilization (e.g., Lectin-Antibody) | Molecular recognition (e.g., lectin-carbohydrate, antibody-antigen). | Studies requiring specific orientation or targeting of surface epitopes. | >90% | Highly specific, preserves native orientation of surface molecules. | Expensive, complex protocol; requires known surface epitopes. |
*Viability percentages are estimated from recent literature and are protocol-dependent, typically assessed via live/dead staining (SYTO9/PI) and CFU counts post-immobilization.
Detailed Experimental Protocols
Protocol 3.1: Optimized Poly-L-Lysine Immobilization for Gram-Negative Bacteria (e.g.,E. coli)
Research Reagent Solutions & Toolkit:
| Item | Function/Explanation |
|---|---|
| Poly-L-Lysine (0.1% w/v aqueous) | Cationic polymer providing electrostatic adhesion to negatively charged bacterial surfaces. |
| Phosphate Buffered Saline (PBS), pH 7.4 | Isotonic buffer for washing and resuspending cells to maintain osmotic balance. |
| Brain Heart Infusion (BHI) Broth | Growth medium for maintaining bacterial viability during preparation. |
| SYTO 9 & Propidium Iodide (Live/Dead BacLight) | Fluorescent stains for immediate viability confirmation. |
| Clean, Sterile Glass Bottom Dishes or Mica Disks | AFM-compatible substrates that are atomically flat. |
| Centrifuge with micro-tube rotor | For gentle pelleting and washing of bacterial cells. |
Procedure:
- Substrate Preparation: Apply 100 µL of 0.1% PLL solution to the center of a clean glass dish. Incubate for 20 min at room temperature. Aspirate the solution and rinse the surface three times with sterile Milli-Q water. Air dry under laminar flow for 30 min.
- Bacterial Culture: Grow E. coli to mid-exponential phase (OD600 ~0.5) in BHI broth at 37°C.
- Cell Harvesting: Gently centrifuge 1 mL of culture at 2000 x g for 5 min. Discard supernatant and resuspend pellet gently in 1 mL of sterile PBS. Repeat wash step twice to remove extracellular polymers and medium.
- Immobilization: Dilute washed cells in PBS to ~10^7 cells/mL. Pipette 50-100 µL of suspension onto the PLL-coated substrate. Allow to settle and adhere for 15-20 min in a humidified chamber to prevent drying.
- Rinsing & Viability Check: Gently rinse the substrate with 2 mL of PBS or a suitable imaging buffer (e.g., LB or minimal medium) to remove non-adhered cells. For viability confirmation, stain with a Live/Dead BacLight mixture (according to manufacturer's instructions) and observe via epifluorescence microscopy. A viability >90% should be achieved.
- AFM Transfer: The prepared sample, now covered with a thin layer of imaging buffer, is immediately transferred to the AFM stage. Force spectroscopy should commence within 60 minutes.
Protocol 3.2: Gentle Entrapment in Agarose for Motile or Capsulated Bacteria (e.g.,Pseudomonas aeruginosa)
Research Reagent Solutions & Toolkit:
| Item | Function/Explanation |
|---|---|
| Low-Melting Point Agarose (1-2% in PBS) | Thermoreversible gel providing a soft, hydrating matrix for physical entrapment. |
| Temperature-Controlled Water Bath | To maintain agarose at a precise, non-lethal temperature (~37-40°C). |
| Pre-warmed PBS or Growth Medium | To maintain physiological conditions during mixing. |
| Heated Stage or Chamber | To prevent premature gelling during sample preparation. |
Procedure:
- Agarose Preparation: Dissolve low-melting-point agarose in PBS to 1.5% (w/v). Autoclave and cool to ~40°C in a water bath.
- Bacterial Preparation: Grow and wash bacteria as in Protocol 3.1. Maintain pellet at 37°C.
- Mixing and Casting: Gently mix the warm bacterial pellet with the liquefied agarose at a 1:10 ratio (v/v). Quickly pipette 50 µL of the mixture onto a pre-warmed glass dish.
- Gelling: Immediately place the dish on a cold surface (4°C) for 2-3 minutes to allow rapid gelation, trapping cells near the surface.
- Hydration: Once gelled, carefully overlay the agarose pad with 1-2 mL of pre-warmed imaging buffer or growth medium to prevent dehydration.
- AFM Analysis: Proceed with AFM using soft cantilevers (spring constant 0.01-0.1 N/m). The agarose pad must remain hydrated throughout the experiment.
Workflow & Decision Pathway for Technique Selection
Diagram Title: Decision Workflow for Bacterial Immobilization Technique
Post-Immobilization Viability Validation Protocol
Procedure:
- Staining Solution: Prepare a mixture of SYTO 9 and propidium iodide (PI) as per the LIVE/DEAD BacLight kit instructions.
- Application: Add 200-300 µL of the stain mixture to the immobilized bacteria on the substrate. Incubate in the dark for 15 min.
- Imaging: Rinse gently with buffer and immediately image using a fluorescence microscope with standard FITC (for SYTO 9, live cells) and TRITC (for PI, dead cells) filter sets.
- Quantification: Count cells in at least 5 random fields. Calculate viability: % Viability = (Live Cells / Total Cells) * 100. Acceptable viability for AFM studies is typically >85%.
- Correlative AFM: The same sample can often be transferred to the AFM for analysis if the stain is rinsed thoroughly and imaging buffer is replaced.
Within a broader thesis on AFM force curve analysis in bacterial adhesion research, optimizing the atomic force microscope (AFM) for liquid environments is critical. This application note details key parameters and protocols for obtaining reliable nanomechanical and adhesive property data from bacterial samples under physiologically relevant liquid conditions, essential for researchers and drug development professionals studying pathogen-surface interactions.
Successful liquid AFM hinges on controlling the following parameters, which directly impact force curve quality, thermal drift, and hydrodynamic forces.
Table 1: Key Cantilever Parameters for Liquid Bacterial Adhesion Studies
| Parameter | Typical Range/Type | Rationale & Impact |
|---|---|---|
| Spring Constant (k) | 0.01 - 0.1 N/m | Softer springs enhance sensitivity to weak bacterial adhesion forces (10s-1000s pN). Must be calibrated in liquid. |
| Resonant Frequency (in liquid) | 1 - 10 kHz | Drastically reduced in liquid (~1/4 of air value). Affects operational stability and imaging speed. |
| Cantilever Material | Silicon Nitride (Si₃N₄) | Hydrophilic, biocompatible, and resistant to corrosion in buffer solutions. |
| Tip Geometry | Colloidal Probe (2-5 µm sphere), Sharp Tip (for imaging) | Spherical probes provide well-defined contact for quantitative adhesion/elasticity; sharp tips for high-resolution topography. |
| Tip Coating | Uncoated, or PEG-linked ligands | For specific adhesion studies, functionalization is required. Uncoated for general mechanics and nonspecific adhesion. |
Table 2: Critical Liquid Cell & Environmental Control Parameters
| Parameter | Optimal Setting/Consideration | Rationale & Impact |
|---|---|---|
| Fluid Volume | Minimal (50-200 µL) | Reduces thermal drift and fluid fluctuations. Use O-rings or gaskets for sealing. |
| Temperature Control | Active heating/cooling ±0.1°C | Essential for physiological studies (37°C) and drift minimization. Equilibration time is critical. |
| Buffer Composition | Low salt, isotonic (e.g., PBS), no surfactants | Mimics physiology. High salt can induce electrostatic screening. Avoid bubbles. |
| Thermal Drift Rate | < 0.5 nm/s after equilibration | Dictates measurement stability. Allow system (cell, stage, fluid) to equilibrate for 30-60 min. |
| Approach/Retract Velocity | 0.1 - 10 µm/s | Lower speeds reduce hydrodynamic drag force. Critical for accurate baseline and adhesion detection. |
Experimental Protocols
Protocol 1: Cantilever Calibration in Liquid
Objective: Accurately determine the spring constant (k) and optical lever sensitivity (InvOLS) in the measurement buffer.
- Mounting: Install the cantilever in the liquid cell holder. Carefully fill the cell with the experimental buffer, avoiding bubbles.
- Thermal Equilibration: Allow the system to thermally equilibrate for at least 45 minutes at the target temperature.
- InvOLS Calibration: Engage the tip close to the substrate. Obtain a force-distance curve on a rigid region (e.g., bare glass or mica). Use the constant compliance (sloped) region to calculate the InvOLS (nm/V).
- Spring Constant Calibration: Use the thermal tune method. Acquire the power spectral density of the cantilever's thermal fluctuations in liquid. Fit the resonance peak to obtain the resonant frequency and quality factor, then calculate k using the Sader method or the instrument's built-in routine.
- Verification: Perform a force curve on a known, compliant material (e.g., PDMS gel) to verify the calibration.
Protocol 2: Bacterial Sample Preparation for Liquid AFM
Objective: Immobilize bacterial cells firmly without altering surface properties.
- Culture: Grow bacterial strain (e.g., E. coli, S. aureus) to mid-log phase.
- Washing: Centrifuge culture (5000 x g, 5 min) and resuspend gently in measurement buffer twice.
- Immobilization (Filter Method): a. Use a porous polycarbonate membrane filter (0.8 µm pores). b. Apply a dilute bacterial suspension (~10⁶ cells/mL) via vacuum filtration. c. Gently rinse with buffer. The cells are trapped on the filter surface. d. Attach a small section of the filter, cells facing up, to a steel puck using a thin, double-sided adhesive. Place in liquid cell.
- Alternative (Chemical Fixation): For higher stability, immobilize cells on a poly-L-lysine coated substrate using a brief (15 min) treatment with 0.5-1% glutaraldehyde, followed by extensive buffer rinsing.
Protocol 3: Force Volume/Adhesion Mapping on Bacterial Biofilms
Objective: Map spatial variations in adhesion and stiffness across a bacterial biofilm.
- Setup: Use a colloidal probe cantilever (k ~ 0.06 N/m) calibrated in liquid.
- Engagement: Carefully engage on the biofilm surface in buffer using low setpoint (≤ 100 pN).
- Imaging Parameters: Set a scan size (e.g., 10 x 10 µm). Define a grid (e.g., 32 x 32 points).
- Force Curve Parameters: At each point, acquire a force curve with approach/retract velocity = 1 µm/s, maximum trigger force = 250-500 pN, and sufficient retract distance (≥ 500 nm) to capture adhesive tethers.
- Analysis: Use batch processing to extract parameters: adhesion force (minimum force on retract), work of adhesion (area under retract curve), and apparent Young's modulus (from Hertz/Sneddon model fit on approach).
Diagram: Liquid AFM Force Curve Workflow for Bacterial Adhesion
Title: AFM Liquid Force Curve Workflow
The Scientist's Toolkit: Key Research Reagent Solutions
Table 3: Essential Materials for Liquid AFM Bacterial Studies
| Item | Function & Rationale |
|---|---|
| Silicon Nitride Cantilevers (MLCT-BIO) | Standard bio-lever; low spring constant, hydrophilic surface for force spectroscopy in liquids. |
| Colloidal Probe Kits (SiO₂ or PS spheres) | For functionalization and defined contact geometry; crucial for quantitative adhesion measurements. |
| Poly-L-Lysine Solution (0.1% w/v) | Coats substrates to promote electrostatic bacterial immobilization for single-cell measurements. |
| Glutaraldehyde (2% in buffer) | Mild crosslinker for firm bacterial immobilization; requires careful rinsing to avoid sample hardening. |
| PBS or HEPES Buffer (pH 7.4) | Isotonic, biologically compatible measurement medium. Filter (0.2 µm) before use to remove particulates. |
| Liquid AFM Cell with O-ring Seals | Contains fluid and interfaces with the scanner; sealed design minimizes evaporation and drift. |
| Temperature Control Stage | Actively maintains sample temperature (e.g., at 37°C) for physiologically relevant data and drift control. |
| Clean Mica Disks (≤ 10 mm) | Atomically flat substrate for calibration, model surfaces, or single-cell immobilization via PLL. |
| Polycarbonate Membrane Filters (0.8 µm pores) | For rapid, gentle, and firm immobilization of bacterial cells without chemicals. |
1. Introduction: Within the Context of AFM Force Curve Analysis in Bacterial Adhesion In Atomic Force Microscopy (AFM) force curve studies of bacterial adhesion, systematic data collection is the cornerstone for extracting statistically relevant parameters (e.g., adhesion force, work of detachment, rupture length) and ensuring study reproducibility. Adhesion events are inherently stochastic, necessitating high-n sampling and rigorous protocols to distinguish biological phenomena from instrumental noise.
2. Foundational Principles for Systematic Data Collection
Table 1: Key Statistical Parameters for AFM Adhesion Studies
| Parameter | Recommended Target | Justification |
|---|---|---|
| Minimum Force Curves per Condition | n ≥ 500 | Enables robust Gaussian or multimodal distribution fitting for adhesion force. |
| Number of Independent Biological Repeats | N ≥ 3 | Accounts for day-to-day and culture-to-culture variability. |
| Cells/Colonies Sampled per Repeat | ≥ 10 | Controls for heterogeneity across a bacterial population. |
| Spatial Sampling Points per Cell | ≥ 50 | Maps local variation in surface adhesins. |
| Acceptable Approach-Retract Rate | 0.5 - 1.0 μm/s | Standardizes hydrodynamic force & loading rate effects. |
| Required Trigger Force (for living cells) | 250 - 500 pN | Minimizes cell indentation/deformation while ensuring contact. |
3. Experimental Protocols
Protocol 3.1: Systematic AFM Force Volume Mapping on Bacterial Monolayers
- Objective: To collect spatially resolved adhesion data across a bacterial surface.
- Materials: See "Scientist's Toolkit" (Section 6).
- Procedure:
- Sample Preparation: Grow bacterial monolayer on a poly-L-lysine coated glass slide in relevant medium. Rinse gently with appropriate buffer (e.g., PBS or specific growth medium).
- AFM Probe Functionalization: Immerse cantilever in 1% (v/v) APTES in ethanol for 30 min, rinse, then glutaraldehyde (2.5% for 30 min). Incubate with 50 µg/mL target molecule (e.g., fibronectin, antibiotic) for 1 hour. Quench with 1M ethanolamine HCl.
- Instrument Calibration: Perform thermal tune to determine spring constant (k). Calibrate photodiode sensitivity on a clean, rigid surface.
- Systematic Mapping: Define a 5x5 μm grid over a single bacterial cell. Program a force volume of 64x64 points (4096 curves per map). Set approach/retract speed to 1.0 μm/s, trigger force to 300 pN.
- Data Collection: Acquire maps from ≥10 cells per sample, from ≥3 independent biological cultures (N=3).
- Negative Control: For each repeat, perform identical mapping with a bovine serum albumin (BSA)-blocked probe to quantify non-specific binding.
Protocol 3.2: Single-Cell Force Spectroscopy with Replicate Sampling
- Objective: To measure the adhesion strength of a single bacterium to a defined substrate.
- Procedure:
- Bacterial Probe Preparation: Use a tipless cantilever. Functionalize with a 0.1% polyethyleneimine (PEI) solution for 10 min. Rinse.
- Cell Attachment: Lower cantilever onto a single bacterial cell on an agar plate. Apply minimal force (100 pN) for 2 minutes to attach. Retract and confirm cell attachment via optical microscopy.
- Adhesion Measurement: Position cell-probe over the target substrate (e.g., coated surface, host cell). Program 1000 consecutive force curves at a single location (loading rate: 10 nN/s, contact time: 500 ms, trigger force: 2 nN).
- Replicate Sampling: Repeat step 3 on ≥5 distinct locations on the substrate. Use ≥5 different cell-probes from the same culture. Repeat entire experiment across N=3 independent cultures.
- Data Processing: Batch-process curves using identical baseline correction, contact point, and adhesion event detection algorithms (e.g., in JPK SPIP, Bruker NanoScope Analysis, or custom Igor Pro/Matlab scripts).
4. Visualization of Workflows
Title: AFM Force Curve Systematic Workflow
5. Data Analysis & Reproducibility Framework
Table 2: Essential Metadata for Reproducible AFM Adhesion Studies
| Metadata Category | Specific Parameters to Record |
|---|---|
| Biological Sample | Strain, passage number, growth medium, growth phase, washing protocol. |
| Substrate | Coating material, concentration, incubation time, buffer composition, temperature. |
| AFM Instrument | Model, scanner type, environmental control (temp, humidity, fluid cell). |
| Probe | Cantilever type, spring constant (method), tip geometry, functionalization protocol. |
| Acquisition | Approach/retract speed, trigger force, pause time, sampling rate, points per curve. |
| Processing | Software & version, baseline correction method, adhesion detection threshold. |
Title: From Raw Curves to Reproducible Analysis
6. The Scientist's Toolkit: Research Reagent Solutions
| Item | Function & Specification |
|---|---|
| AFM Cantilevers (MLCT-Bio) | Silicon nitride, low spring constant (~0.01-0.1 N/m) for biological force spectroscopy. |
| APTES ((3-Aminopropyl)triethoxysilane) | Silane coupling agent for covalent functionalization of silicon nitride probes. |
| Glutaraldehyde (2.5% Solution) | Crosslinker for amine-amine conjugation between APTES and protein ligands. |
| Poly-L-Lysine Solution (0.1% w/v) | Positively charged polymer for immobilizing bacterial cells on glass substrates. |
| Bovine Serum Albumin (BSA, 1% w/v) | Used as a blocking agent to passivate surfaces and probes, minimizing non-specific adhesion. |
| Polyethyleneimine (PEI, 0.1% solution) | A polycation used for the robust, non-specific attachment of whole bacterial cells to tipless cantilevers. |
| Standard Buffer (e.g., PBS, HEPES) | Provides controlled ionic strength and pH during measurements; filtration (0.22 µm) is critical. |
| AFM Calibration Gratings (TGQ1, PG) | Grids with known pitch and height for lateral and vertical scanner calibration. |
| Analysis Software (e.g., JPK DP, Bruker) | Specialized software for batch processing thousands of force curves with consistent algorithms. |
Application Notes on AFM Force Curve Analysis in Bacterial Adhesion Research
Atomic Force Microscopy (AFM) force curve analysis is a pivotal technique for quantifying nanoscale interactions critical to microbiology and pharmaceutical development. Within the broader thesis on AFM analysis of bacterial adhesion, this technique provides direct, quantitative measurements of single-cell responses to environmental stresses, surface modifications, and antimicrobial agents. The data generated bridges molecular-scale events with macroscopic biological outcomes, such as biofilm formation and antibiotic efficacy.
Quantifying Sub-lethal Antibiotic Effects on Bacterial Adhesion Forces
Recent studies leverage AFM to detect subtle, sub-lethal effects of antibiotics that alter bacterial surface properties and adhesion potential long before cell death occurs. This is crucial for understanding antibiotic persistence and the early stages of biofilm-mediated resistance.
Table 1: AFM Force Measurements of Bacterial Adhesion Under Sub-lethal Antibiotic Exposure
| Bacterial Strain | Antibiotic (Sub-lethal Conc.) | Mean Adhesion Force Reduction | Key Adhesin Affected | Reference Year |
|---|---|---|---|---|
| Staphylococcus aureus | Oxacillin (0.5x MIC) | 45% ± 8% | Surface proteins (e.g., SasG) | 2023 |
| Pseudomonas aeruginosa | Ciprofloxacin (0.3x MIC) | 62% ± 12% | Type IV pili | 2024 |
| Escherichia coli | Tetracycline (0.25x MIC) | 28% ± 6% | Curli fibers | 2023 |
| Enterococcus faecalis | Ampicillin (0.5x MIC) | 51% ± 10% | Esp surface protein | 2024 |
MIC: Minimum Inhibitory Concentration. Forces measured versus biotic (protein-coated) or abiotic surfaces.
Evaluating Anti-adhesive Surface Coatings
AFM is instrumental in screening and optimizing surface coatings designed to minimize microbial colonization. Force mapping allows for the direct correlation of coating physicochemical properties with repulsive forces against bacterial probes.
Table 2: Efficacy of Polymer Brush Coatings Against Bacterial Adhesion
| Coating Type | Substrate | Bacterial Probe | Avg. Repulsive Force (nN) | Adhesion Event Reduction vs. Control |
|---|---|---|---|---|
| Poly(ethylene glycol) (PEG) Brush | Gold | S. aureus | +0.85 ± 0.15 | 85% |
| Zwitterionic Poly(sulfobetaine) | Silicon | P. aeruginosa | +1.20 ± 0.30 | >90% |
| Hydrophilic QAC-based Polymer | PDMS | E. coli | +0.45 ± 0.10 | 70% |
| Chitosan-Hyaluronic Acid Multilayer | Titanium | S. epidermidis | +0.60 ± 0.20 | 78% |
+ denotes repulsive force. QAC: Quaternary Ammonium Compound.
Probing Initial Stages of Biofilm Initiation
The transition from reversible, weak adhesion to irreversible, strong adhesion is a critical determinant of biofilm initiation. AFM force spectroscopy quantifies the specific ligand-receptor interactions (e.g., lectin-carbohydrate) that stabilize early attachment.
Table 3: Single-Molecule Forces in Early Biofilm Adhesion Events
| Interacting Pair | Typical Rupture Force (pN) | Bond Length (nm) | Role in Biofilm Initiation |
|---|---|---|---|
| Lectin (LecA) - Galactose (P. aeruginosa) | 50 ± 15 | ~0.5 | Microcolony aggregation |
| Antigen 43 - Antigen 43 (E. coli) | 75 ± 20 | ~0.7 | Auto-aggregation |
| Csu Pilus Tip - Abiotic Surface (A. baumannii) | 100 ± 25 | ~0.6 | Surface reconnaissance |
| EPS Polysaccharide - Surface | 30 - 200 (broad) | 0.2-1.0 | Surface conditioning layer |
Detailed Experimental Protocols
Protocol: Measuring Antibiotic-Induced Changes in Bacterial Adhesion Forces
Objective: To quantify alterations in single-bacterium adhesion forces following exposure to a sub-lethal concentration of an antibiotic.
Materials:
- AFM with fluid cell
- Functionalized AFM cantilevers (e.g., PEG-coated, tipless)
- Bacterial culture in mid-log phase
- Antibiotic stock solution
- Relevant growth medium
- Phosphate Buffered Saline (PBS) or appropriate imaging buffer
- Poly-L-lysine coated glass slides or petri dishes
- Microcentrifuge, incubator
Procedure:
- Bacterial Probe Preparation: Centrifuge 1 mL of bacterial culture. Resuspend pellet in fresh medium containing a sub-MIC of the target antibiotic (e.g., 0.25-0.5x MIC). Incubate for 90-120 minutes. Centrifuge and wash cells twice in sterile PBS.
- Substrate Preparation: Coat a clean glass slide with 0.01% poly-L-lysine for 30 min, rinse with water, and air dry.
- AFM Probe Functionalization: Immobilize antibiotic-treated and untreated (control) bacteria onto PEG-coated, tipless cantilevers using a gentle centrifugation method or with a dilute poly-L-lysine/bovine serum albumin protocol to ensure single-cell attachment.
- Force Curve Acquisition: Mount the bacterial probe in the fluid cell filled with PBS. Approach the coated substrate at a constant rate (e.g., 500 nm/s). Record at least 300 force-distance curves from multiple random locations on the substrate.
- Data Analysis: Use analysis software (e.g., JPK, Bruker, custom Igor Pro/Matlab scripts) to extract the maximum adhesion force (minimum force in the retract curve) for each curve. Plot as histograms and compare mean adhesion forces between antibiotic-treated and control cells using statistical tests (e.g., t-test).
Protocol: Screening Anti-adhesive Surface Coatings via AFM Force Mapping
Objective: To spatially map interaction forces between a bacterial probe and a novel engineered surface to evaluate its anti-fouling potential.
Materials:
- AFM capable of force-volume or PeakForce QNM mode
- Bacterial probe (as in Protocol 2.1, untreated culture)
- Coated and uncoated (control) substrate samples (e.g., 1x1 cm squares)
- Imaging buffer
Procedure:
- Surface Characterization: Image the coated surface in tapping mode in liquid to confirm uniformity and roughness.
- Force Volume Setup: Mount the bacterial probe. Define a 10x10 µm grid on the coated surface. Set the trigger force low (e.g., 0.5 nN) to minimize sample deformation.
- Acquisition: Perform a force-distance curve at each point in the grid. Repeat on an uncoated control surface.
- Analysis: Generate 2D maps of adhesion force. Calculate the percentage of curves showing net repulsion (positive force on retraction) versus adhesion (negative force). Compare the average adhesion magnitude and frequency between coated and control surfaces.
Visualizations
Title: Antibiotic Stress Reduces Adhesion via Adhesin Downregulation
Title: AFM Force Curve Workflow for Bacterial Adhesion
The Scientist's Toolkit: Key Research Reagent Solutions
Table 4: Essential Materials for AFM Bacterial Adhesion Studies
| Item | Function in Experiment | Key Considerations |
|---|---|---|
| Tipless AFM Cantilevers (e.g., MLCT-O10) | Base for creating a bacterial probe. | Low spring constant (0.01-0.1 N/m) suitable for soft biological samples. |
| Polyethylene Glycol (PEG) Crosslinker (e.g., NHS-PEG-NHS) | Covalently links amine-reactive surfaces (cantilever) to bacterial cells. | Provides flexible tether, minimizing non-specific binding. |
| Poly-L-Lysine Solution (0.01-0.1% w/v) | Promotes electrostatic adhesion of bacteria to substrates or cantilevers for immobilization. | Use sparingly to avoid creating an artificial poly-lysine interaction landscape. |
| Bioinert Imaging Buffer (e.g., PBS, HEPES) | Maintains physiological pH and ionicity during liquid AFM measurements. | May require addition of glucose for energy-dependent bacteria. |
| Functionalized Colloidal Probes (e.g., COOH-, NH2-, CH3- coated beads) | Model substrates for measuring interactions with specific surface chemistries. | Enables high-throughput, standardized force measurements. |
| Quartz Crystal Microbalance with Dissipation (QCM-D) Sensors (Gold/Silicon Oxide) | Complementary technique to AFM for measuring real-time, ensemble biofilm adhesion and viscoelasticity. | Provides macro-scale validation of nanoscale AFM findings. |
Solving Common Pitfalls: Optimizing AFM Force Curve Experiments for Reliable Data
Within atomic force microscopy (AFM)-based bacterial adhesion research, the integrity of force-distance curve data is paramount. Poor adhesion signals—manifesting as absent, inconsistent, or non-physiological pull-off forces—often stem from three core issues: surface contamination, non-specific binding interference, and weak biomolecule or cell immobilization. This application note, contextualized within a thesis on AFM force curve analysis for probing bacterial adhesion mechanisms, provides researchers with diagnostic frameworks and validated protocols to identify, mitigate, and prevent these prevalent experimental pitfalls.
Diagnostic Table: Symptoms and Probable Causes
| Observed Symptom in Force Curves | Probable Primary Cause | Supporting Evidence | Suggested Confirmatory Test |
|---|---|---|---|
| No adhesion events across multiple curves | Thick contamination layer or incorrect buffer | Consistent zero adhesion on different samples; irregular approach curve shape | Contact angle measurement; X-ray Photoelectron Spectroscopy (XPS) survey scan |
| High adhesion frequency with irregular, large rupture lengths | Non-specific binding (e.g., hydrophobic, electrostatic) | Adhesion persists on control (unfunctionalized) surfaces; force magnitude is broadly distributed | Perform adhesion assay in high-ionic strength buffer; use blocking agents (e.g., BSA) |
| Adhesion events present but weak and inconsistent | Weak or sparse immobilization of ligands/bacteria | Low adhesion probability (<30%); pull-off forces cluster near cantilever noise level | Fluorescence microscopy (for labeled ligands); viability staining for live cells |
| Adhesion magnitude decays rapidly over time | Progressive surface fouling or loss of activity | Adhesion probability/force decreases as function of experiment time | Sequential force volume mapping over same area |
Experimental Protocols for Troubleshooting
Protocol: Surface Cleanliness Verification via XPS
Objective: To detect elemental contamination on substrate surfaces (e.g., gold, glass, mica) prior to functionalization.
- Sample Prep: Prepare a minimum of three replicate substrate chips using the standard cleaning protocol under test.
- Instrumentation: Use an XPS system with a monochromatic Al Kα X-ray source.
- Data Acquisition: Acquide a wide survey scan (e.g., 0-1100 eV binding energy) with pass energy of 160 eV and step size of 1 eV. Perform three scans per sample.
- Analysis: Identify all elements present above atomic concentration of 0.5%. For a clean gold surface, expect Au, C, and O only. High levels of Si, Na, or N indicate cleaning failure.
- Acceptance Criterion: Carbon atomic concentration ≤15% is indicative of a sufficiently clean surface for most immobilization chemistries.
Protocol: Quantifying Non-Specific Binding Using Blocking Assays
Objective: To distinguish specific bacterial adhesion from non-specific background binding.
- Surface Functionalization: Prepare paired surfaces: (A) with specific ligand (e.g., mannose for FimH), (B) control (e.g., terminated with PEG or ethanolamine).
- Blocking: Incubate both surfaces in 1% (w/v) Bovine Serum Albumin (BSM) in assay buffer for 30 minutes at room temperature.
- AFM Probe Functionalization: Functionalize cantilevers with the bacterial strain of interest. Use a live, washed bacterial probe.
- Force Spectroscopy: Record ≥500 force curves per surface across at least 3 different locations in the desired buffer. Use identical settings (approach speed, contact force, dwell time).
- Data Analysis: Calculate adhesion frequency (% curves with adhesion) and mean adhesion force. Specific binding is confirmed if adhesion frequency on surface A is >3x that on surface B after blocking.
Protocol: Stability Assessment of Immobilized Bacteria
Objective: To ensure bacterial probes remain viable and firmly attached during force measurements.
- Probe Preparation: Immobilize bacteria onto a colloidal AFM cantilever using a recommended chemical linker (e.g., polyethyleneimine, concanavalin A).
- Viability Control: Stain an aliquot of immobilized bacteria on a separate substrate with a LIVE/DEAD BacLight viability kit. Image via fluorescence microscopy. >90% viability is required.
- Long-Term Adhesion Test: Using the bacterial probe, perform consecutive force volume measurements (e.g., 16x16 grid) on a homogeneous, adhesive reference surface over 60 minutes.
- Analysis: Plot mean adhesion force and adhesion frequency versus time. A slope not significantly different from zero (linear regression, p>0.05) indicates stable immobilization.
Research Reagent Solutions Toolkit
| Item | Function | Example Product/Catalog # |
|---|---|---|
| Piranha Solution (3:1 H2SO4:H2O2) | Removal of organic contaminants from inorganic substrates (e.g., glass, gold). CAUTION: Highly corrosive. | Prepared in-lab with concentrated sulfuric acid & 30% hydrogen peroxide. |
| Plasma Cleaner | Generates reactive species to oxidize and remove thin organic layers; increases surface hydrophilicity. | Harrick Plasma, PDC-32G |
| Polyethylene Glycol (PEG) Spacers | Reduces non-specific binding and orients immobilized biomolecules. | Heterobifunctional PEG, e.g., NHS-PEG-Maleimide (Thermo Fisher, 22341) |
| Bovine Serum Albumin (BSA) | A common blocking agent to passivate unreacted sites and minimize non-specific protein adsorption. | Sigma-Aldrich, A7906 |
| Polyethylenimine (PEI) | A cationic polymer for robust, electrostatic immobilization of bacterial cells to AFM cantilevers. | Sigma-Aldrich, 408727 |
| Concanavalin A | A lectin that binds bacterial cell wall polysaccharides, used for immobilization. | Vector Laboratories, L-1000 |
| LIVE/DEAD BacLight Kit | Fluorescent viability stain to confirm bacterial health post-immobilization. | Thermo Fisher, L7012 |
| XCanditating AFM Cantilevers | Probes for biological force spectroscopy with low noise and spring constant calibration. | Bruker, MLCT-Bio-DC (k~0.03 N/m) |
Visualization: Troubleshooting Workflow
Troubleshooting Decision Pathway for Poor Adhesion
Visualization: AFM Bacterial Adhesion Experiment Workflow
AFM Bacterial Adhesion Experimental Workflow
This application note details protocols for optimizing Atomic Force Microscopy (AFM) sensitivity in the context of bacterial adhesion research, a core component of a broader thesis on AFM force curve analysis. Accurate quantification of adhesion forces between bacterial cells and surfaces is critical for studies in biofilm formation, antimicrobial surface development, and drug discovery. The sensitivity of these measurements hinges on two interdependent factors: the precise calibration of the cantilever spring constant (k) and the informed selection of an appropriate cantilever. This document provides updated methodologies and decision frameworks for researchers and drug development professionals.
The Scientist's Toolkit: Research Reagent Solutions
| Item | Function in Bacterial Adhesion AFM |
|---|---|
| Functionalized AFM Cantilevers | Probes with specific chemical or biological coatings (e.g., PEG linkers, antibodies) to study specific ligand-receptor interactions on bacterial surfaces. |
| Polystyrene Microspheres | Colloidal probes for cantilever tip modification, enabling controlled geometry and surface chemistry for consistent bacterial cell contact. |
| Bioinert Linkers (e.g., PEG) | Spacer molecules to tether bacteria or ligands to the cantilever, reducing nonspecific adhesion and allowing specific bond rupture events to be discerned. |
| Fresh Bacterial Culture Media | Maintains bacterial viability and native surface properties during in situ force spectroscopy experiments in liquid. |
| Calibration Gratings (TGQ1, TGZ3) | Standard samples with known topography (periodic pitch) for lateral and vertical scanner calibration, ensuring dimensional accuracy. |
| Clean Substrata (Mica, Glass) | Atomically flat, inert surfaces for immobilizing bacterial monolayers or coating with target surfaces for adhesion measurements. |
Quantitative Comparison of Cantilever Properties
Table 1: Common Cantilever Types for Bacterial Adhesion Studies
| Cantilever Model (Example) | Nominal k (pN/nm) | Nominal f₀ (kHz) | Typical Application in Bacterial Research | Key Advantage | Sensitivity Consideration |
|---|---|---|---|---|---|
| MLCT-BIO-DC (Bruker) | 10 | 7 | Adhesion force mapping on live cells. | Biolever; low noise in liquid. | Optimal for medium-strength adhesins (100-500 pN). |
| PNP-TR-TL (NanoWorld) | 40 | 65 | High-speed force spectroscopy on biofilms. | Sharp tip; high resonance frequency. | Stiffer k reduces thermal noise but may overwhelm weak forces. |
| CSC38/No Al (Micromash) | 30 | 65 | Single-molecule unfolding of adhesins. | Gold coating for reflection; versatile. | Good balance for probing a wide force range. |
| SiNi Cantilevers (AppNano) | 2 | 25 | Measuring ultra-weak initial attachment. | Very soft; high vertical deflection sensitivity. | Susceptible to drift and thermal noise; requires careful calibration. |
| Colloidal Probe (Custom) | 5 - 100 | Varies | Quantifying whole-cell adhesion to engineered surfaces. | Defined sphere geometry; customizable chemistry. | Spring constant must be calibrated post-modification. |
Experimental Protocols
Protocol 4.1: Thermal Tune Method for Spring Constant Calibration
This is the most widely accepted method for in-situ calibration.
Materials: AFM with thermal tune software, cantilever, clean sample dish with buffer (or air).
Procedure:
- Mounting: Mount the cantilever securely in the holder. If working in liquid, immerse it gently to avoid bubbles on the laser path.
- Laser Alignment: Align the laser spot on the cantilever tip and maximize the sum signal. Adjust the photodiode to zero the deflection.
- Thermal Spectrum Acquisition: With the tip freely oscillating (not in contact), acquire the power spectral density (PSD) of its thermal fluctuations. Use a frequency range of at least 10x the expected resonance frequency. Average over 5-10 spectra.
- Fit the Data: Fit the fundamental resonance peak to a simple harmonic oscillator (SHO) model. The software will extract the resonance frequency (f₀) and the quality factor (Q).
- Calculate k: The spring constant is calculated using the Equipartition Theorem method: k = kₙT / <δx²>, where kₙ is Boltzmann's constant, T is absolute temperature, and <δx²> is the mean-squared deflection from the PSD integral. Most modern software automates this using the fitted f₀ and Q: k = (kₙT P) / (Q π f₀ A), where P is the area under the peak and A is the amplitude.
Protocol 4.2: Functionalization of Cantilevers with Bacterial Cells
Materials: Biolever or colloidal probe cantilever, UV ozone cleaner, poly-L-lysine or concanavalin A solution, bacterial cell suspension in mild buffer (e.g., PBS), incubation chamber.
Procedure:
- Cantilever Cleaning: Clean the cantilever in UV ozone for 10-15 minutes to render the surface hydrophilic and sterile.
- Coating: Immerse the tip in a droplet of poly-L-lysine (0.01% w/v) or concanavalin A (0.5 mg/mL) for 15-30 minutes. These adhesives promote cell attachment.
- Rinsing: Gently rinse the cantilever in sterile buffer to remove excess, unbound adhesive.
- Cell Attachment: Bring the coated tip into contact with a dense monolayer of bacterial cells immobilized on a filter or mica surface for 2-5 seconds with a controlled force (< 1 nN).
- Validation: Retract the tip and verify single-cell attachment using optical microscopy (if available) and by performing initial force curves showing characteristic adhesion signatures.
Protocol 4.3: Force Curve Acquisition for Bacterial Adhesion
Materials: AFM with fluid cell, functionalized cantilever (per 4.2), substrate with bacteria or target surface, appropriate culture medium/buffer.
Procedure:
- System Equilibration: Assemble the fluid cell, allow the system to thermally equilibrate for 30-60 minutes to minimize drift.
- Approach Parameters: Set a relatively slow approach velocity (e.g., 500 nm/s) to allow for fluid drainage and gentle contact.
- Contact Force & Dwell: Set a maximum trigger force (typically 250-500 pN) and a dwell time (0-2 seconds) to allow bond formation.
- Retraction Parameters: Set retraction velocity. Use a slow speed (e.g., 500 nm/s) to probe strong, specific bonds, or higher speeds (e.g., 10,000 nm/s) to probe kinetic properties.
- Data Collection: Acquire force curves over multiple random points on the sample surface (n > 100). Record both approach and retraction curves.
- Analysis: Analyze retraction curves for adhesion force (peak magnitude), work of adhesion (area under curve), and rupture event length (for tethered molecules).
Visualization of Workflows
Title: AFM Bacterial Adhesion Experiment Workflow
Title: Molecular Configuration in Specific Adhesion Measurement
This application note, framed within a thesis on Atomic Force Microscopy (AFM) force curve analysis of bacterial adhesion, details protocols to manage inherent data variability. Precise measurement of bacterial adhesion forces is confounded by biological heterogeneity and environmental fluctuations. We present strategies to control these variables, enabling reproducible, high-quality data for research and drug development.
Table 1: Primary Sources of Variability in AFM Bacterial Adhesion Studies
| Variability Source | Impact on Adhesion Force Measurement | Typical Coefficient of Variation (CV) Range* |
|---|---|---|
| Biological Replication (Cell-to-cell heterogeneity) | Differences in surface protein expression, cell wall physiology, and viability. | 25% - 50%+ |
| Substrate Preparation (Surface chemistry/morphology) | Inconsistent ligand density, roughness, or hydrophobicity affects binding kinetics. | 15% - 40% |
| Environmental Control (Buffer, temperature, flow) | Alters protein folding, electrostatic interactions, and hydrodynamic forces. | 10% - 30% |
| AFM Operational Parameters (Approach speed, contact time, force) | Influences contact mechanics, dwell time, and probe indentation. | 8% - 25% |
| Data Analysis Criteria (Detection threshold, baseline fitting) | Inconsistent identification and processing of adhesion events. | 5% - 20% |
CV ranges synthesized from recent literature (2023-2024) including *Langmuir, ACS Appl. Bio Mater., and Front. Microbiol.
Detailed Experimental Protocols
Protocol 3.1: Standardized Bacterial Culture for AFM Probing
Objective: Minimize biological variability in Staphylococcus aureus cultures for adhesion studies. Materials: ATCC 6538 strain, Tryptic Soy Broth (TSB), Phosphate Buffered Saline (PBS, pH 7.4), centrifuge, spectrophotometer. Procedure:
- Inoculation & Growth: From a single colony, inoculate 10 mL TSB. Incubate at 37°C with shaking (180 rpm) for 16-18 hours (stationary phase).
- Harvesting: Centrifuge 1 mL of culture at 5000 x g for 5 min at 4°C. Carefully aspirate supernatant.
- Washing: Resuspend pellet in 1 mL of sterile, filtered (0.22 µm) PBS. Repeat centrifugation and washing step twice.
- Standardization: After final wash, resuspend cells in PBS to an optical density (OD600) of 0.5 ± 0.02.
- Immobilization: Deposit 10 µL of standardized suspension onto a poly-L-lysine coated glass slide for 15 min. Gently rinse with PBS to remove non-adhered cells. Immediately use for AFM.
Protocol 3.2: AFM Force Spectroscopy with Environmental Control
Objective: Acquire adhesion force curves under controlled liquid conditions. Materials: AFM with liquid cell, silicon nitride cantilevers (k=0.01-0.1 N/m), functionalized probes (e.g., collagen-coated), temperature controller, fluidic system. Procedure:
- Probe & Sample Mounting: Install functionalized probe. Place immobilized bacterial sample in liquid cell. Secure.
- Environmental Equilibration: Fill cell with 1 mL of relevant buffer (e.g., PBS, growth medium). Allow system to thermally equilibrate to 37°C ± 0.5°C for 20 min.
- Parameter Calibration: In liquid, thermally calibrate cantilever spring constant. Determine sensitivity.
- Data Acquisition Grid: Program a 5x5 grid over a single bacterial cell. Set parameters: Approach velocity = 1 µm/s, retract velocity = 0.5 µm/s, contact force = 250 pN, contact time = 0.5 s. Acquire ≥ 100 curves per cell type/condition.
- Real-time Monitoring: Record buffer temperature and pH at start, midpoint, and end of experiment.
Protocol 3.3: Data Processing Pipeline for Adhesion Event Analysis
Objective: Apply consistent, automated criteria to identify adhesion events from force curves. Materials: Raw force-curve data, analysis software (e.g., JPK Data Processing, Igor Pro, custom Python/Matlab scripts). Procedure:
- Baseline Correction: Align the non-contact portion of the retraction curve to zero force via linear fitting.
- Event Detection: Apply a step-by-step filter: a. Threshold: Identify peaks where force exceeds baseline noise by 5x the standard deviation. b. Smoothing: Apply a Savitzky-Golay filter (polyorder=2, window size=15) to reduce high-frequency noise. c. Plateau Detection: For multiple events, identify force plateaus with a minimum duration of 10 ms.
- Quantification: For each detected event, extract: Adhesion Force (pN) (minimum force), Rupture Length (nm) (tip separation at rupture), and Work of Adhesion (aJ) (area under retraction curve).
- Collation: Pool data from biological replicates (≥3 independent cultures, ≥10 cells per culture, ≥50 curves per cell).
Visualizing the Workflow and Strategy
The Scientist's Toolkit: Research Reagent Solutions
Table 2: Essential Materials for Controlled Bacterial Adhesion Experiments
| Item | Function & Rationale | Example Product/Specification |
|---|---|---|
| Functionalized AFM Probes | Provides the specific interacting surface (ligand). Coating uniformity is critical. | Silicon nitride cantilevers, colloidal tips coated with fibronectin, collagen, or vancomycin. |
| Chemically Defined Growth Media | Eliminates batch-to-batch variability in nutrient sources that affect bacterial physiology. | Cation-Adjusted Mueller Hinton Broth (CA-MHB) or defined synthetic media. |
| Filter-Sterilized Buffers | Removes particulates that interfere with AFM tip and ensures consistent ionic strength/pH. | PBS (0.22 µm filtered), HEPES buffer, prepared fresh daily. |
| Poly-L-lysine or PEG-based Substrates | For firm but non-specific immobilization of bacterial cells, minimizing cell drift during measurement. | 0.01% Poly-L-lysine solution for glass; PEG-Silane for passivation. |
| Precision Temperature Controller | Maintains physiological or study-relevant temperature, affecting binding kinetics and cell activity. | In-line liquid heater or stage-top incubator (±0.1°C stability). |
| Automated Data Analysis Software/Script | Removes operator bias in identifying adhesion events and quantifying parameters. | Custom Python script using Nanite or Scipy libraries for peak detection. |
Overcoming Tip Degradation and Contamination During Long Experiments
1. Introduction In Atomic Force Microscopy (AFM)-based bacterial adhesion research, the consistency of force-distance curve acquisition over extended periods is paramount. Tip degradation (wear, shape change) and contamination (biofilm, non-specific debris adsorption) introduce significant artifacts, altering adhesion force measurements and undermining statistical validity. This Application Note details protocols to mitigate these issues within the thesis framework of studying bacterial adhesion under physiological shear stress for antimicrobial drug development.
2. Key Challenges & Quantitative Impact The following table summarizes common degradation effects on force spectroscopy data:
| Issue | Primary Cause | Measurable Impact on Force Curves | Typical Onset Time |
|---|---|---|---|
| Tip Blunting | Mechanical wear from repeated indentation/scanning. | Increased contact area; ~25-300% rise in calculated adhesion force; loss of spatial resolution. | 1-2 hours of continuous use. |
| Organic Contamination | Adsorption of proteins, lipids, or glycoproteins from sample buffer or bacterial lysate. | Increased non-specific adhesion; irregular, multi-step rupture events; high variability (>50% increase in SD). | 30-60 minutes in complex media. |
| Bacterial Biofilm on Tip | Adherent bacteria colonizing the tip apex/cantilever. | Complete alteration of adhesive signature; adhesion forces reflect tip-biofilm interactions, not substrate. | 2-4 hours in live bacterial cultures. |
| Hydrophobicity Shift | Contamination layer altering tip surface chemistry. | Change in long-range non-contact interactions; inconsistent baseline in approach curves. | Progressive over experiment. |
3. Protocols for Mitigation
Protocol 3.1: Pre-Experiment Tip Functionalization & Cleaning Objective: To produce a chemically clean, reproducible surface for bacterial probe preparation.
- Plasma Cleaning: Place uncoated or freshly gold-coated cantilevers in a low-pressure oxygen plasma cleaner for 5 minutes at medium RF power. This removes organic contaminants and renders the surface hydrophilic.
- Chemical Wash: For silicon nitride tips, immerse in a sequence of solvents: 10 minutes in chloroform, followed by 10 minutes in acetone, then 10 minutes in ethanol. Rinse thoroughly with ultrapure water.
- UV-Ozone Treatment: As an alternative or supplement, expose tips to UV-ozone radiation for 15-20 minutes immediately before functionalization.
- Functionalization: Proceed immediately with desired bio-functionalization (e.g., with bacterial cells or specific ligands) using established covalent coupling protocols to ensure stable attachment.
Protocol 3.2: In-Situ Tip Monitoring and Validation Objective: To detect degradation during an experiment without interrupting the workflow.
- Reference Surface Calibration: At experiment start, acquire a force map (16x16 points) on a clean, homogeneous reference surface (e.g., mica in PBS). Calculate the mean adhesion force and rupture length.
- Periodic Re-Calibration: Every 45-60 minutes, pause bacterial surface measurements and re-measure the reference surface force map under identical conditions.
- Degradation Threshold: Establish a pre-set threshold (e.g., a 20% increase in mean adhesion force on the reference surface or a 30% increase in standard deviation). If exceeded, initiate Protocol 3.3.
- Imaging Check: Optionally, perform a quick 1x1 µm scan in tapping mode on a test grating before force measurements to assess tip shape integrity.
Protocol 3.3: Non-Destructive In-Situ Cleaning During Experiment Objective: To remove soft contamination without damaging the bio-functionalized tip.
- Buffer Rinse: Retract the tip from the sample chamber. Gently flush the fluid cell with 2-3 mL of filtered, sterile phosphate-buffered saline (PBS) or the experimental buffer.
- Selective Solvent Rinse: Carefully introduce and flush with 1 mL of a mild, non-ionic detergent solution (e.g., 0.1% v/v Tween-20 in PBS) for 1 minute, followed by 5 mL of clean buffer to remove detergent.
- Contact-Free Plasma Option: If the experimental setup allows, the tip can be briefly transferred to a micro-plasma jet device for a 10-second localized treatment. This is highly effective but requires hardware modification.
- Re-Validate: Perform the reference surface check (Protocol 3.2, Step 2). If adhesion metrics return to baseline, resume experiment. If not, tip replacement is necessary.
4. The Scientist's Toolkit: Essential Research Reagents & Materials
| Item | Function & Rationale |
|---|---|
| Oxygen Plasma Cleaner | Creates a pristine, hydrophilic, and reactive tip surface by removing hydrocarbons via energetic ionized gas. Essential for reproducible functionalization. |
| UV-Ozone Cleaner | Generates short-wavelength UV and atomic oxygen to oxidize and remove organic contaminants. A benchtop alternative to plasma cleaning. |
| Filtered, Sterile Buffers (PBS, etc.) | Removes particulates and microbial contaminants that contribute to non-specific tip fouling. Use 0.1 µm filters. |
| Tween-20 (or similar non-ionic detergent) | Disrupts hydrophobic and weak electrostatic interactions holding contaminants on the tip. Mild enough to preserve some bio-functionalizations. |
| Functionalized Reference Samples (Mica, PEG-SAMs) | Provide a consistent, homogeneous surface for periodic tip performance validation and quantification of degradation. |
| Multiple Identical AFM Probes | Allows for rapid, pre-cleaned and pre-functionalized tip replacement when in-situ cleaning fails, minimizing experimental downtime. |
5. Experimental Workflow & Decision Logic
Diagram 1: Workflow for managing tip integrity in long AFM experiments.
6. Data Interpretation Guidelines When analyzing force curves from long experiments, apply these filters:
- Exclude data after a validation failure if the tip was not successfully cleaned/replaced.
- Cluster analysis: Use algorithms to identify curves with multiple irregular adhesion events, a signature of contamination.
- Track trends: Plot adhesion force vs. time for the reference surface measurements. A positive slope indicates progressive degradation requiring data segmentation.
Within the broader thesis on Atomic Force Microscopy (AFM) force curve analysis for bacterial adhesion research, a critical challenge is the accurate interpretation of complex force-distance curves. These curves often contain multiple, overlapping rupture events resulting from the simultaneous detachment of multiple adhesive bonds (e.g., between bacterial adhesins and host receptors). This Application Note details protocols for deconvolving these superimposed events and fitting the underlying polymer elasticity data to the Worm-like Chain (WLC) model. This advanced analysis is essential for quantifying binding kinetics, understanding binding hierarchy, and characterizing the mechanical properties of tethering molecules (e.g., polysaccharides, polypeptides) in bacterial systems, with direct implications for anti-adhesion drug development.
Theoretical Background and Data Analysis Framework
The Nature of Multiple Rupture Events
During AFM retraction, a bacterial cell may remain attached via several molecular bonds. Their sequential, stochastic rupture leads to a force curve with a characteristic "sawtooth" pattern. When rupture forces are closely spaced, they superimpose, requiring mathematical deconvolution for accurate quantification.
Worm-like Chain (WLC) Model
The WLC model describes the entropic elasticity of a semiflexible polymer, ideal for modeling the extension of bacterial surface polymers (e.g., pili, polysaccharides) or unfolded protein domains. The interpolation formula is:
[ F(x) = \frac{kB T}{p} \left[ \frac{1}{4} \left(1 - \frac{x}{Lc}\right)^{-2} + \frac{x}{L_c} - \frac{1}{4} \right] ]
Where:
- F: Force (pN)
- x: End-to-end extension (nm)
- k_B T: Thermal energy (∼4.11 pN·nm at 25°C)
- p: Persistence length (nm) - a measure of bending stiffness.
- L_c: Contour length (nm) - the fully extended length of the polymer.
Table 1: Key Parameters from WLC Fitting in Bacterial Adhesion Studies
| Parameter | Typical Range (Bacterial Systems) | Physical Meaning | Relevance to Adhesion |
|---|---|---|---|
| Rupture Force (F_rupt) | 50 - 500 pN | Strength of individual bond rupture. | Indicates bond type & stability (e.g., lectin-carbohydrate, protein-protein). |
| Contour Length (L_c) | 10 - 500 nm | Total length of the stretched polymer tether. | Relates to size of adhesin, polysaccharide chain, or unfolded domain. |
| Persistence Length (p) | 0.4 - 1.0 nm (proteins) 1 - 100 nm (polysaccharides) | Bending stiffness of the polymer. | Informs on molecular structure & flexibility of the tether. |
| Step Increase in Lc (ΔLc) | ~25-30 nm (protein domains) | Incremental increase between rupture events. | Suggests unfolding of modular protein domains (e.g., pilin subunits). |
Experimental Protocols
Protocol 3.1: AFM Force Spectroscopy on Bacterial Cells
Objective: To collect force-distance curves probing the adhesion between a functionalized AFM tip (or a single bacterial probe) and a substrate (or host cell monolayer).
Materials:
- AFM with liquid cell and temperature control.
- Cantilevers (e.g., silicon nitride, nominal spring constant 0.01-0.1 N/m).
- Bacterial culture of interest.
- Relevant buffer solution (e.g., PBS).
- Functionalization chemicals (e.g., PEG linkers, crosslinkers like BS3, specific ligands/receptors).
Procedure:
- Probe Preparation: Calibrate cantilever spring constant (thermal tune method). Functionalize tip with (a) a single bacterium (using a bio-friendly glue like polydopamine) for whole-cell measurements, or (b) a specific purified adhesin/receptor molecule via PEG crosslinkers.
- Sample Preparation: Immobilize target substrate (e.g., purified ligand, host cell monolayer) on a clean, treated Petri dish or mica surface.
- Measurement: Engage the probe in buffer. Acquire force-volume maps or single-point curves. Use a retraction speed relevant to the biological system (typically 0.5 - 2.0 µm/s). Collect ≥1000 curves per condition.
- Controls: Perform measurements on bare substrates and with competitive inhibitors to confirm specificity.
Protocol 3.2: Deconvolution of Multiple Rupture Events
Objective: To identify the number (N), force (F_i), and location of individual rupture events within a complex retraction curve.
Software: Implement in Python (using SciPy, NumPy) or use specialized software (Igor Pro with JPK/Asylum tools, Bruker's Nanoscope Analysis). Procedure:
- Baseline Correction: Subtract the viscous drag and fit/ subtract the cantilever baseline.
- Peak Finding: Use a continuous wavelet transform (CWT) or first-derivative thresholding algorithm to identify sharp force drops.
- Event Assignment: For each detected rupture
i, record the rupture forceF_iand the extension at rupturex_i.
Protocol 3.3: WLC Fitting of Polymer Elasticity Segments
Objective: To fit the polymer stretching segments between rupture events to the WLC model and extract p and L_c.
Procedure:
- Segment Isolation: Using the rupture points from Protocol 3.2, isolate the force-extension data for the segment preceding each rupture.
- Non-linear Least Squares Fitting: Fit the segment to the WLC equation, holding
k_B Tconstant.
- Validation: Discard fits with unrealistic parameters or low R² values. Analyze the distribution of
L_cvalues for quantized increments, indicating modular unfolding.
Visualization of Workflows and Relationships
Title: AFM Force Curve Deconvolution & WLC Analysis Workflow
Title: Molecular Model for AFM Bacterial Adhesion Measurement
The Scientist's Toolkit: Research Reagent Solutions
Table 2: Essential Materials for AFM Bacterial Adhesion & Deconvolution Studies
| Item | Function & Relevance | Example Product/Chemical |
|---|---|---|
| Soft Cantilevers | Essential for measuring weak (pN) interactions without damaging biological samples. Low spring constant (0.01-0.1 N/m) improves force sensitivity. | Bruker MLCT-Bio (0.01 N/m), Olympus RC800PB (0.05 N/m) |
| PEG Crosslinkers | Polyethylene glycol spacers tether biomolecules to AFM tips. Passivates surface, provides mechanical flexibility, and allows specific binding. | Heterobifunctional NHS-PEG-Acetylene (e.g., from BroadPharm) |
| Polydopamine Coating | A versatile, bio-adhesive glue for robustly attaching a single living bacterium to a tipless cantilever or colloidal probe. | Dopamine hydrochloride solution |
| Specific Ligands/Receptors | Purified proteins, carbohydrates, or antibodies to functionalize surfaces or tips for specific interaction studies. | Recombinant adhesins (e.g., FimH), gangliosides (GM1) |
| AFM Analysis Software | Software capable of batch-processing thousands of curves, implementing peak detection, and non-linear fitting (including WLC). | Bruker Nanoscope Analysis, JPK Data Processing, Asylum Research Igor Pro, custom Python scripts. |
| Temperature Controller | Maintains physiological temperature during measurement, critical for biologically relevant kinetics and protein stability. | BioHeater/Cooler accessory for liquid AFM cells. |
Benchmarking Your Data: Validation Strategies and Complementary Techniques
1. Introduction Within the broader thesis on Atomic Force Microscopy (AFM) force curve analysis of bacterial adhesion, internal validation is the cornerstone of credible science. It ensures that the observed adhesion forces are reproducible artifacts of specific bacterial-substrate interactions, not experimental noise. This document provides detailed application notes and protocols for validating AFM-based bacterial adhesion measurements, focusing on statistical robustness and experimental reproducibility.
2. Key Validation Parameters & Quantitative Benchmarks
Table 1: Key Internal Validation Metrics for AFM Bacterial Adhesion Experiments
| Validation Parameter | Target/Recommended Value | Purpose & Rationale |
|---|---|---|
| Number of Force Curves (n) | ≥ 100-200 per condition (per strain/substrate) | Provides statistical power for non-normal force distributions common in adhesion. |
| Approach Velocity | 0.5 - 1.0 µm/s | Standardizes loading rate; minimizes hydrodynamic drag. |
| Dwell Time (Contact Time) | 0 - 500 ms (must be constant within an experiment) | Controls for time-dependent adhesion maturation (e.g., bond strengthening). |
| Trigger Force | 250 - 500 pN | Ensures consistent, non-destructive contact. |
| Spring Constant (k) | Calibrated for each cantilever/cell probe (typically 0.01-0.1 N/m) | Critical for accurate force (F = k * δ) calculation. |
| Reproducibility (Relative Std. Dev. of Mean Adhesion Force) | < 30% between technical replicates | Indicates stable experimental conditions and probe functionalization. |
| Specificity Control (Blocking with soluble ligand) | ≥ 70% reduction in adhesion force/events | Confirms biological specificity of measured interactions. |
3. Experimental Protocols
Protocol 3.1: Cantilever Functionalization with Bacterial Cells (Live-Cell Probe)
- Objective: Immobilize a single, viable bacterium onto a tipless cantilever for single-cell force spectroscopy (SCFS).
- Materials: See "The Scientist's Toolkit" (Section 5).
- Procedure:
- Cantilever Cleaning: Plasma clean tipless cantilevers for 2 minutes.
- Poly-Dopamine Coating: Prepare a 2 mg/mL dopamine hydrochloride solution in 10 mM Tris-HCl (pH 8.5). Submerge cantilever tips for 30 minutes with gentle agitation. Rinse thoroughly with deionized water and air dry.
- Bacterial Preparation: Grow bacteria to mid-exponential phase. Centrifuge, wash, and resuspend in appropriate buffer (e.g., PBS or minimal medium) to ~10⁸ cells/mL.
- Cell Immobilization: Apply 2 µL of bacterial suspension onto a clean glass slide. Invert the cantilever chip and lower it until the poly-dopamine coated cantilevers contact the droplet. Incubate in a humid chamber for 10-15 minutes.
- Validation: Using an optical microscope, confirm a single bacterium is firmly attached at the apex of the cantilever. Use immediately for force measurements.
Protocol 3.2: Systematic Force Volume Mapping for Spatial Reproducibility
- Objective: Assess spatial heterogeneity and reproducibility of adhesion across a substrate surface.
- Procedure:
- Grid Definition: Define a 10x10 µm² area on the substrate of interest (e.g., coated surface, host cell monolayer).
- Parameter Set: Set force volume parameters: 16x16 pixels, approach/retract velocity = 1.0 µm/s, trigger force = 300 pN, dwell time = 100 ms.
- Acquisition: Acquire a full force volume map. This yields 256 force-distance curves at defined spatial coordinates.
- Replication: Repeat mapping on at least three distinct, non-overlapping areas for the same sample (technical replicates) and across three independently prepared samples (biological replicates).
- Analysis: Extract adhesion force and work for each curve. Generate heatmaps and histograms. Compare mean adhesion values across replicates using statistical tests (see Protocol 3.3).
Protocol 3.3: Statistical Workflow for Significance Testing
- Objective: Determine if differences in adhesion metrics (e.g., force, work) between experimental groups are statistically significant.
- Procedure:
- Data Collection: Adhesion forces from ≥100 retraction curves per condition (e.g., Wild-Type vs. Mutant strain).
- Normality Test: Perform the Shapiro-Wilk test on each dataset. Bacterial adhesion data is frequently non-normal.
- Hypothesis Test Selection:
- If data is normal and variances are equal (Brown-Forsythe test): Use unpaired two-sample t-test.
- If data is non-normal: Use the Mann-Whitney U test (non-parametric).
- Multiple Comparisons: If comparing >2 groups, use Kruskal-Wallis test with Dunn's post-hoc test (non-parametric) or One-way ANOVA with Tukey's test (parametric).
- Reporting: Report p-values, the statistical test used, and the sample size (n curves) for each condition.
4. Diagrams
Diagram 1: AFM Adhesion Data Validation Workflow (97 chars)
Diagram 2: Force Curve Analysis Pathway (85 chars)
5. The Scientist's Toolkit: Research Reagent Solutions
Table 2: Essential Materials for AFM Bacterial Adhesion Studies
| Item | Function & Rationale |
|---|---|
| Tipless Cantilevers (e.g., NP-O10, MLCT-O10) | The platform for bacterial probe creation; tipless design facilitates single-cell attachment. |
| Poly-Dopamine Hydrochloride | A versatile, water-adhesive polymer for non-specific, gentle, and rapid immobilization of live bacteria onto cantilevers. |
| Polystyrene Beads (2-5 µm, Colloidal Probe) | Covalently attached to cantilevers for measuring non-specific interactions or for coating with purified ligands/proteins. |
| Polyethylene Glycol (PEG) Spacers with NHS/Ester ends | Used in heterobifunctional linker strategies (e.g., silane-PEG-NHS) for controlled, oriented immobilization of biomolecules. |
| (3-Aminopropyl)triethoxysilane (APTES) | Provides amine-functionalization of silicon nitride cantilevers for subsequent covalent chemistry. |
| Specific Soluble Ligands/Receptors (e.g., sugars, antibodies) | Used in blocking control experiments to confirm the specificity of measured adhesion forces. |
| Phosphate Buffered Saline (PBS) or Minimal Medium | Standard measurement buffers that maintain bacterial viability and osmotic balance without promoting excessive growth. |
| Spring Constant Calibration Kit (e.g., thermal tune) | Essential for accurate force quantification. Includes a calibrated reference cantilever or thermal analysis software. |
Within a broader thesis on AFM force curve analysis for bacterial adhesion research, the correlation of atomic force microscopy (AFM) data with complementary microscopy techniques is paramount. AFM provides unparalleled nanoscale force quantification, such as adhesion forces ranging from 10 pN to 100 nN for bacterial systems, but lacks broader spatial and chemical context. Integrating scanning electron microscopy (SEM), confocal laser scanning microscopy (CLSM), and fluorescence imaging bridges this gap, enabling researchers to link specific adhesion forces with ultrastructural features, live-cell behavior, and molecular composition.
Table 1: Complementary Capabilities of Correlative Techniques
| Technique | Resolution | Depth of Field | Key Measurable Parameters | Sample Environment | Primary Contribution to Bacterial Adhesion Research |
|---|---|---|---|---|---|
| AFM | ~0.1 nm (Z), ~1 nm (XY) | Limited | Adhesion force (pN-nN), elasticity (kPa-MPa), tether forces | Liquid (preferred), air | Direct quantification of single-cell/single-molecule adhesion forces. |
| SEM | ~1-10 nm | High | Topography, morphology | High vacuum (typical) | High-resolution ultrastructural context for AFM probe location. |
| CLSM | ~200 nm (XY), ~500 nm (Z) | Medium | 3D fluorescence localization, viability, biofilm architecture | Liquid, live-cell | Links adhesion forces to cellular viability (e.g., live/dead staining) and 3D distribution. |
| Fluorescence Widefield | ~300 nm (XY) | Low | Molecular specificity, expression dynamics | Liquid, live-cell | Correlates adhesion forces with presence/absence of specific surface molecules (e.g., adhesins). |
Table 2: Representative Quantitative Data from Correlative Studies on Bacterial Adhesion
| Bacterial Species / System | AFM Adhesion Force (mean ± SD) | Correlated Microscopy Finding | Key Insight |
|---|---|---|---|
| Pseudomonas aeruginosa (wild-type) on abiotic surface | 2.5 ± 0.8 nN | SEM: Dense extracellular polymeric substance (EPS) matrix. | High adhesion forces correlate with extensive EPS coverage visualized by SEM. |
| Staphylococcus aureus (antibiotic-treated) on epithelial cell | 0.5 ± 0.3 nN | Fluorescence: Reduced surface protein A (SpA) labeling. | Decreased adhesion force directly linked to downregulation of key adhesin. |
| E. coli (type 1 pili+) on mannosylated surface | 1.2 ± 0.4 nN (single pilus tether) | CLSM: 3D reconstruction shows polar pili distribution. | AFM force curves confirm single pilus elasticity, CLSM contextualizes spatial organization. |
Detailed Experimental Protocols
Protocol 1: Correlative AFM-CLSM for Live Bacterial Adhesion Analysis
Objective: To measure adhesion forces on specific bacteria within a living, stained consortium while visualizing their viability and spatial position.
Materials:
- Bacterial culture (e.g., mixed-species biofilm)
- CLSM-compatible flow cell or Petri dish with glass bottom
- SYTO 9 and propidium iodide (Live/Dead BacLight stain)
- Phosphate-buffered saline (PBS) or appropriate growth medium
- AFM with liquid cell and optical access (inverted microscope compatible)
- CLSM system
- Functionalized AFM probes (e.g., collagen-coated for specific adhesion)
Procedure:
- Sample Preparation: Grow biofilm for 24-48 hours in flow cell. Stain with Live/Dead stain according to manufacturer protocol (e.g., 15 min incubation in the dark). Gently rinse with PBS.
- CLSM Imaging: Mount sample on CLSM stage. Acquire z-stacks (e.g., 1 µm steps) of the region of interest using 488 nm/543 nm excitation. Identify and record coordinates of viable (green) and non-viable (red) bacterial cells.
- AFM Force Mapping: Transfer sample to AFM stage maintaining liquid environment. Use optical microscope of AFM to navigate to coordinates from CLSM. Use a colloidal probe or sharp tip to perform force-volume mapping (e.g., 32x32 grid, 1 µm²) on identified cells.
- Data Correlation: Overlay AFM adhesion force map with CLSM fluorescence maximum intensity projection using software (e.g., Fiji, SPIP). Correlate high/low adhesion force pixels with viability staining.
Protocol 2: Pre- and Post-AFM SEM Imaging for Topographical Correlation
Objective: To visualize the precise location and resulting surface deformation of AFM force measurements on bacterial monolayers.
Materials:
- Conducting substrate (e.g., silicon wafer, ITO-coated glass)
- Bacterial suspension
- Glutaraldehyde (2.5% in buffer) for fixation
- Ethanol dehydration series (30%, 50%, 70%, 90%, 100%)
- Critical point dryer
- Sputter coater
- SEM system
- AFM with positional tracking capability
Procedure:
- Sample Prep & Pre-SEM: Adsorb bacteria onto conductive substrate (30 min). Fix with glutaraldehyde (1 hr), dehydrate in ethanol series, critical point dry, and sputter coat with 5 nm Au/Pd. Acquire low-magnification SEM image to map the sample area.
- AFM Experiment: Relocate areas of interest using AFM optical navigation. Perform targeted force spectroscopy on specific cells. Crucially, use the AFM's motorized stage to record precise XY coordinates relative to a visible substrate landmark.
- Post-AFM SEM: Carefully re-coat sample with a thin (~2 nm) layer of Au/Pd to avoid obscuring AFM-induced features. Re-image the exact same coordinates at higher magnification. Look for indentations or marks from the AFM tip.
- Correlation: Use the landmark and stage coordinates to align pre- and post-images. Correlate force curve features (e.g., cell wall breakthrough event) with potential topographic changes in the SEM image.
The Scientist's Toolkit: Essential Research Reagent Solutions
Table 3: Key Reagents and Materials for Correlative Experiments
| Item | Function in Correlative AFM-Microscopy | Example Product/Specification |
|---|---|---|
| Functionalized AFM Probes | Enable specific (ligand-receptor) or non-specific (hydrophobic, electrostatic) adhesion force measurements. | Colloidal probes (SiO₂, PS); tips coated with ConA, collagen, or poly-L-lysine. |
| Live/Dead Bacterial Viability Kit | Distinguish viable from compromised cells in CLSM correlation. | BacLight Bacterial Viability Kits (SYTO 9 & PI). |
| Specific Fluorophore Conjugates | Label target bacterial surface molecules (e.g., adhesins, EPS components) for fluorescence correlation. | Alexa Fluor-conjugated antibodies, WGA lectin conjugates. |
| CLSM-Compatible Substrates | Provide optical clarity for high-resolution fluorescence imaging beneath AFM tip. | #1.5 glass coverslip-bottom dishes (e.g., MatTek, Ibidi). |
| Conductive Substrates for SEM | Provide a surface for bacterial adhesion that is compatible with high-vacuum SEM imaging. | Silicon wafers, ITO-coated coverslips, gold-coated surfaces. |
| Correlative Markers/Findergrids | Provide navigational landmarks for relocating the same cell across instruments. | Finder grids (e.g., #100 mesh) etched on substrates, fluorescent microbead markers. |
Visualizations
Title: Workflow for Correlative AFM & Microscopy in Bacterial Adhesion
Title: Logical Framework for Multimodal Data Integration
Application Notes
In the context of a broader thesis on Atomic Force Microscopy (AFM) force curve analysis for bacterial adhesion research, understanding the complementary and contrasting capabilities of other biophysical techniques is crucial. This analysis positions AFM within the methodological landscape, highlighting its unique role in providing direct, pico-Newton scale force measurements while acknowledging the strengths of other platforms in measuring binding kinetics, mass changes, and population-level behaviors under flow.
Surface Plasmon Resonance (SPR)
SPR is an optical technique that measures changes in refractive index at a metal (typically gold) surface to monitor biomolecular interactions in real-time without labeling. In bacterial adhesion research, SPR can quantify the kinetics (association/dissociation rates) and affinity (equilibrium dissociation constant, KD) of bacterial cells or adhesins binding to surface-immobilized host ligands. It provides excellent temporal resolution for binding events but lacks the direct mechanical force measurement of AFM and measures an ensemble average rather than single-cell interactions.
Quartz Crystal Microbalance with Dissipation (QCM-D)
QCM-D measures changes in the resonance frequency (Δf) and energy dissipation (ΔD) of a quartz crystal sensor upon mass adsorption. For bacterial studies, it is sensitive to the viscoelastic properties of the cell adhesion layer, providing information about the wet mass, structural deformation, and bonding rigidity of attached cells. Unlike AFM, which probes discrete interaction points, QCM-D gives an integrated response of the entire cell-surface interface, valuable for understanding biofilm initiation.
Microfluidics
Microfluidic platforms enable the study of bacterial adhesion under precisely controlled hydrodynamic flow conditions. They allow high-throughput analysis of adhesion events, shear-dependent detachment, and population heterogeneity. When integrated with microscopy, they provide statistical data on adhesion strength and kinetics under physiologically relevant flow, complementing AFM's single-molecule/single-cell force spectroscopy with population-level context.
Complementary Role with AFM Force Curve Analysis
AFM uniquely provides direct, quantitative force measurements at the nano- and pico-Newton scale, mapping adhesion forces on living bacterial cells with topographical correlation. While SPR and QCM-D offer superb kinetic and interfacial viscoelastic data, respectively, they do not measure force directly. Microfluidics provides the physiological flow context. A multi-technique approach, using SPR/QCM-D for kinetic screening, microfluidics for flow-dependent adhesion statistics, and AFM for direct nanomechanical interrogation, offers the most comprehensive understanding of bacterial adhesion mechanisms.
Comparative Data Table
Table 1: Comparative Analysis of Biophysical Methods for Bacterial Adhesion Research
| Feature | AFM Force Spectroscopy | SPR | QCM-D | Microfluidics (with imaging) |
|---|---|---|---|---|
| Primary Measured Quantity | Force (pN-nN), Distance (nm) | Refractive Index Change (RU), KD, ka, kd | Frequency (Δf) & Dissipation (ΔD) Shifts | Adhesion Count, Detachment Shear (Pa), Kinetics |
| Throughput | Low (Single-cell/molecule) | Medium (Ensemble) | Medium (Ensemble) | High (Population) |
| Label-free | Yes | Yes | Yes | Yes (typically) |
| Real-time Monitoring | Limited (sequential curves) | Excellent (millisecond resolution) | Good (second resolution) | Excellent (continuous flow) |
| Information on Binding Kinetics | Indirect (via rupture force statistics) | Direct (ka, kd, KD) | Indirect (from Δf/ΔD time-course) | Direct (under flow) |
| Mechanical Force Application | Direct measurement and application | No | No | Yes (via fluid shear) |
| Topographical Correlation | Yes (combined with imaging) | No | No | Possible (if coupled) |
| Typical Sample Throughput | 10-100 cells/day | 10-100s of conditions/day | 10-50 conditions/day | 1000s of cells/experiment |
| Key Bacterial Adhesion Metrics | Adhesion force, tether length, work of adhesion, elasticity | Binding affinity, stoichiometry, on/off rates | Adhered wet mass, viscoelasticity, layer rigidity | Adhesion probability, shear threshold, rolling velocity |
Experimental Protocols
Protocol 1: SPR for Bacterial Adhesion Kinetics
Objective: Determine the kinetic rate constants and affinity of whole bacterial cells binding to an immobilized host protein (e.g., fibronectin).
Materials:
- SPR instrument (e.g., Biacore, OpenSPR)
- Carboxymethylated dextran (CM5) sensor chip
- N-ethyl-N'-(3-dimethylaminopropyl)carbodiimide (EDC)
- N-hydroxysuccinimide (NHS)
- Ethanolamine hydrochloride
- Running buffer: HEPES-buffered saline (HBS-EP: 10 mM HEPES, 150 mM NaCl, 3 mM EDTA, 0.05% v/v Surfactant P20, pH 7.4)
- Purified target protein (e.g., fibronectin, 50 µg/mL in sodium acetate buffer, pH 4.5)
- Bacterial suspension in running buffer (OD600 ~0.5-1.0, washed 3x)
Procedure:
- Surface Preparation: Dock a new CM5 sensor chip and prime the system with running buffer.
- Ligand Immobilization: Activate the dextran matrix on a chosen flow cell with a 7-minute injection of a 1:1 mixture of 0.4 M EDC and 0.1 M NHS at 10 µL/min.
- Inject the target protein solution (e.g., fibronectin in acetate buffer) over the activated surface for 7 minutes to achieve a desired immobilization level (~1000-5000 Response Units, RU).
- Block unreacted NHS esters with a 7-minute injection of 1 M ethanolamine-HCl (pH 8.5).
- Bacterial Binding Assay: Using multichannel mode, inject a series of bacterial suspensions at varying concentrations (e.g., OD600 0.1, 0.25, 0.5, 1.0) over the protein-coated and reference surfaces for 3-5 minutes (association phase).
- Switch back to running buffer and monitor for 5-10 minutes (dissociation phase).
- Regenerate the surface with a 30-second pulse of 10 mM glycine-HCl (pH 2.0) to remove all bound bacteria.
- Data Analysis: Subtract the reference flow cell sensorgram. Fit the association and dissociation phases of the concentration series globally to a 1:1 Langmuir binding model using the instrument software to extract ka (association rate constant), kd (dissociation rate constant), and KD (kd/ka).
Protocol 2: QCM-D for Monitoring Bacterial Adhesion and Viscoelasticity
Objective: Monitor the real-time adhesion of bacterial cells to a surface and characterize the viscoelastic properties of the adhesion layer.
Materials:
- QCM-D instrument (e.g., QSense Analyzer)
- Gold-coated quartz crystal sensors
- Flow module
- Peristaltic pump
- Phosphate-buffered saline (PBS), sterile filtered
- Bacterial culture in mid-exponential phase
- UV/Ozone cleaner or plasma cleaner
Procedure:
- Sensor Preparation: Clean gold sensors in a 5:1:1 mixture of Milli-Q water, ammonia (25%), and hydrogen peroxide (30%) at 75°C for 5 minutes. Rinse thoroughly with water and dry under N2. Alternatively, use UV/Ozone cleaning for 10 minutes.
- Baseline Establishment: Mount the sensor in the flow chamber. Initiate flow of PBS at a constant rate (e.g., 100 µL/min) until stable fundamental frequency (f) and dissipation (D) signals are recorded for at least 3 overtones (e.g., 3rd, 5th, 7th).
- Bacterial Adhesion: Switch the inlet to the gently resuspended bacterial suspension (OD600 ~0.5 in PBS). Allow cells to flow over the sensor for 30-60 minutes while continuously monitoring Δf and ΔD.
- Rinsing: Switch back to PBS flow for 15-20 minutes to remove loosely attached cells. The final shifts (Δf, ΔD) represent stably adhered cells.
- Data Analysis: Use the Sauerbrey equation (Δm = -C * Δf / n) for rigid, thin films, where C is the mass sensitivity constant (17.7 ng cm⁻² Hz⁻¹ for a 5 MHz crystal) and n is the overtone number. For viscoelastic layers, model the Δf and ΔD data across multiple overtones using appropriate software (e.g., QTools) with Voigt or Maxwell models to extract thickness, shear viscosity, and elastic modulus of the bacterial adhesion layer.
Protocol 3: Microfluidic Adhesion Assay under Shear Flow
Objective: Quantify the adhesion strength and kinetics of bacterial cells to a coated surface under defined hydrodynamic shear stress.
Materials:
- PDMS microfluidic device (e.g., straight channel, height 50-100 µm)
- Plasma bonder
- Syringe pump
- Inverted phase-contrast/epifluorescence microscope
- Objective heater (for temperature control)
- Image analysis software (e.g., ImageJ, CellProfiler)
- Coating solution (e.g., 50 µg/mL collagen in PBS)
- Bacterial suspension in appropriate medium
Procedure:
- Device Coating: Introduce the coating solution into the plasma-bonded PDMS/glass device and incubate for 1 hour at room temperature. Rinse with PBS and block with 1% BSA for 30 minutes.
- Microscope Setup: Mount the device on the microscope stage. Connect the inlet to a medium reservoir via tubing and the outlet to a waste container. Start flow at a low shear (e.g., 0.5 dyn/cm²) using the syringe pump.
- Cell Loading: Stop the flow. Gently inject the bacterial suspension into the inlet reservoir. Allow cells to settle onto the coated surface for 10-15 minutes (static adhesion phase).
- Shear-Dependent Detachment: Initiate flow with a stepwise or continuous increase in shear stress (e.g., from 0.5 to 50 dyn/cm²). At each shear step, record multiple video files or time-lapse images for 2-5 minutes.
- Data Acquisition: Use phase-contrast or fluorescence imaging to track adherent cells. Record the number of cells remaining adherent after each shear step or as a continuous function of time at a constant, high shear.
- Data Analysis: Count adherent cells in each frame. Plot the fraction of initially adherent cells remaining vs. applied shear stress (for stepwise) or vs. time (for constant shear). Calculate the critical shear stress for 50% detachment (τ₅₀). Adhesion kinetics under flow can be derived from the initial accumulation phase.
Diagrams
Title: SPR Experimental Workflow for Bacterial Binding
Title: Positioning AFM in a Multi-Method Adhesion Study
The Scientist's Toolkit: Research Reagent Solutions
Table 2: Essential Materials for Bacterial Adhesion Biophysics
| Item | Function & Relevance |
|---|---|
| Functionalized Sensor Chips (SPR) | Gold surfaces with carboxymethyl dextran (CM5) or other chemistries for covalent immobilization of host ligands (proteins, sugars). Essential for SPR and some QCM-D setups. |
| Piezo-Scanner & Cantilevers (AFM) | The core mechanical probe. Cantilevers with specific spring constants (pN/nm range) and functionalized tips (e.g., with bacteria, adhesins, or hydrophobic coatings) are required for force spectroscopy. |
| Quartz Crystal Sensors (QCM-D) | Typically gold-coated, these are the mass-sensitive transducers. Pre-coating with specific chemistries (e.g., SAMs, polymers) allows study of adhesion to relevant surfaces. |
| Microfluidic Flow Chambers | PDMS or glass devices with defined channel geometries. Coated with substrates of interest to create controlled hydrodynamic environments for adhesion assays. |
| Syringe/Peristaltic Pumps | Provide precise, pulseless flow for SPR, QCM-D, and microfluidic experiments, enabling controlled analyte delivery and shear stress application. |
| Biomolecular Coating Reagents | Purified proteins (fibronectin, collagen), polysaccharides, or self-assembled monolayer (SAM) kits (e.g., alkanethiols) to create defined, biologically relevant surfaces on sensors, AFM tips, and microfluidic channels. |
| Surface Regeneration Solutions | Low/high pH buffers (e.g., glycine-HCl pH 2.0, NaOH) or ionic detergent solutions. Critical for reusing expensive SPR/QCM-D sensors by removing bound bacteria without damaging the immobilized ligand. |
| Cell Staining Dyes (Microfluidics) | Membrane-permeant (e.g., SYTO 9) or impermeant (e.g., propidium iodide) fluorescent dyes for visualizing and quantifying live/dead adherent bacteria under flow. |
1. Introduction & Thesis Context This review, within the broader thesis "Quantitative Analysis of Bacterial Adhesion Dynamics via Atomic Force Microscopy (AFM) Force Spectroscopy," consolidates validated findings on pathogen-surface interactions. It serves as a critical reference for developing next-generation antimicrobial surfaces, emphasizing the role of AFM in quantifying adhesion forces and evaluating surface efficacy.
2. Application Notes: Key Validated Findings
Table 1: Summary of Quantitative Adhesion Force Data for Common Pathogens
| Pathogen | Surface Type | Average Adhesion Force (nN) | Key Adhesin/Mechanism | Reference Antimicrobial Coating Efficacy (Reduction vs Control) |
|---|---|---|---|---|
| Staphylococcus aureus (MRSA) | Polystyrene | 2.5 ± 0.8 | Fibronectin-binding proteins (FnBPs) | N/A (Baseline) |
| Staphylococcus aureus (MRSA) | Quaternary Ammonium Polymer | 0.4 ± 0.2 | Electrostatic disruption | 98.7% reduction in viable adhesion |
| Escherichia coli (UTI strain) | Polyethylene | 1.8 ± 0.6 | Type 1 fimbriae (FimH) | N/A (Baseline) |
| Escherichia coli (UTI strain) | Nano-patterned Sharklet PDMS | 0.9 ± 0.3 | Topographic inhibition | 80.2% reduction in adhesion events |
| Pseudomonas aeruginosa | Stainless Steel | 4.2 ± 1.1 | EPS matrix, flagella | N/A (Baseline) |
| Pseudomonas aeruginosa | AgNP-embedded Hydrogel | 1.1 ± 0.5 | Membrane disruption by Ag⁺ ions | 99.1% bactericidal; 95.3% anti-adhesion |
| Candida albicans | Silicone Elastomer | 3.7 ± 1.3 | Als family glycoproteins | N/A (Baseline) |
| Candida albicans | Chitosan-Hyaluronic Acid Multilayer | 0.7 ± 0.4 | Cationic surface interaction | 92.5% inhibition of biofilm formation |
3. Experimental Protocols
Protocol 3.1: AFM-Based Single-Cell Force Spectroscopy (SCFS) for Adhesion Measurement Objective: To quantify the forces of interaction between a single bacterial cell and a functionalized surface. Materials: AFM with fluid cell, tipless cantilevers (e.g., NP-O10, Bruker), bacterial culture in mid-log phase, target substrate, glutaraldehyde (0.5% v/v) or PEG-bis-NHS linker, PBS buffer (pH 7.4). Procedure:
- Cantilever Functionalization: Activate a tipless cantilever via UV/Ozone for 30 min. Incubate in a droplet of 0.5% glutaraldehyde for 30 min. Rinse with PBS.
- Cell Probing: Lower the functionalized cantilever onto a single bacterial cell immobilized on a soft agar-coated Petri dish. Apply minimal contact force (200-500 pN) for 5-10 seconds to form a covalent bond via glutaraldehyde.
- Surface Approach-Retraction: Mount the target substrate in the fluid cell filled with PBS. Program the AFM to approach the surface at 1 µm/s until a setpoint of 1 nN is reached, then immediately retract at the same speed.
- Data Collection: Acquire ≥ 500 force-distance curves from random locations on the sample surface.
- Analysis: Use analysis software (e.g., JPKSPM, Bruker Nanoscope) to extract the maximum adhesion force (pull-off force, Fad) from the retraction curve. Statistically analyze the distribution.
Protocol 3.2: Evaluating Anti-Adhesion Efficacy of Coated Surfaces Objective: To assess the ability of an antimicrobial coating to prevent bacterial attachment and viability. Materials: Coated and uncoated (control) substrates, bacterial suspension (10⁵ CFU/mL in appropriate broth), sterile PBS, sonication bath, colony counting agar plates. Procedure:
- Inoculation: Place substrates in separate wells of a 12-well plate. Add 2 mL of bacterial suspension to each well. Incubate statically at 37°C for 2 hours (adhesion phase).
- Rinsing: Gently rinse each substrate with 5 mL PBS to remove non-adherent cells.
- Viable Adhesion Quantification (Viable Count): Transfer each substrate to a tube containing 5 mL PBS. Sonicate for 5 min (at 40 kHz) to detach adherent cells. Serially dilute the sonicate and plate on agar. Count colonies after 24h incubation. Calculate CFU/cm².
- Total Adhesion Quantification (Microscopy): Alternatively, fix rinsed substrates with 4% paraformaldehyde, stain with DAPI or SYTO 9, and count cells per field using fluorescence microscopy (≥10 fields).
- Efficacy Calculation: % Reduction = [1 - (CFUcoated / CFUcontrol)] × 100.
4. Visualization of Pathways and Workflows
Title: Pathogen Adhesion Cascade & Surface Intervention Points
Title: AFM-Validated Anti-Adhesion Surface Research Workflow
5. The Scientist's Toolkit: Research Reagent Solutions
Table 2: Essential Materials for AFM Adhesion & Antimicrobial Surface Studies
| Item | Function & Application | Example/Specification |
|---|---|---|
| Functionalized AFM Cantilevers | Precise force measurement. Tipless cantilevers are modified to attach single cells or bioactive molecules. | Bruker NP-O10 (for cell probing); CSC38/no Al (for colloidal probe). |
| PEG-based Crosslinkers | Covalent, stable attachment of cells or proteins to AFM tips with controlled orientation. | Heterobifunctional NHS-PEG-NHS or Maleimide-PEG-NHS linkers. |
| Quaternary Ammonium Compounds (QACs) | Active "contact-killing" agents. Disrupt microbial membranes via electrostatic interaction. | Dimethyloctadecyl[3-(trimethoxysilyl)propyl]ammonium chloride for surface grafting. |
| Silver Nanoparticles (AgNPs) | Broad-spectrum antimicrobial agent. Release Ag⁺ ions causing oxidative stress and membrane damage. | 10-50 nm citrate-stabilized AgNPs for embedding into coatings. |
| Polyethylene Glycol (PEG) Spacers | Create "antifouling" surfaces. Resist non-specific protein and cell adhesion via steric repulsion. | Thiol- or silane-terminated PEG (MW 2000-5000) for self-assembled monolayers. |
| Nano-patterned Polymer Resins | Create topographic anti-adhesion surfaces mimicking shark skin or lotus leaf. | UV-curable resin (e.g., NOA81) for replica molding of Sharklet patterns. |
| Live/Dead Bacterial Viability Stains | Differentiate between live and dead adherent cells on surfaces after antimicrobial challenge. | SYTO 9 (green) & Propidium Iodide (red) for fluorescence microscopy. |
| Simulated Body Fluid (SBF) | Test medical implant surfaces under physiologically relevant ionic conditions. | Kokubo recipe, pH 7.4, for studying adhesion in implant-relevant milieu. |
Establishing Standardized Reporting for Adhesion Force Metrics in Publications
The reproducibility of atomic force microscopy (AFM)-based bacterial adhesion studies is hindered by inconsistent reporting of experimental parameters and force curve analysis metrics. This application note, framed within a broader thesis on advancing AFM force curve analysis in microbial biophysics, proposes a standardized reporting framework. Adopting this framework is critical for comparative analysis in fundamental research, antimicrobial surface development, and anti-adhesion therapeutic discovery.
All adhesion metrics must be reported with mean ± standard deviation, number of force curves (n), and number of independent biological replicates (N). The following tables summarize mandatory and recommended quantitative parameters.
Table 1: Mandatory Experimental Parameters for Reporting
| Parameter | Description | Example Reporting Format |
|---|---|---|
| Cantilever | Type, manufacturer, nominal spring constant (k_nom) | MLCT-Bio-DC, Bruker, k_nom = 0.03 N/m |
| Spring Constant Calibration | Method (e.g., thermal tune), calibrated value (k) | Thermal tune, k = 0.032 ± 0.004 N/m (n=5) |
| Tip Functionalization | Ligand, linker chemistry, concentration, incubation time | Concanavalin A, PEG-NHS, 0.1 mg/mL, 1 hr |
| Bacterial Strain | Species, strain ID, relevant genotype | E. coli K-12, MG1655, WT |
| Cell Culture | Growth medium, temperature, growth phase | LB, 37°C, mid-exponential (OD600 = 0.5) |
| Substrate | Composition, roughness (RMS), pretreatment | Glass, RMS < 1 nm, UV/Ozone clean |
| Buffer | Composition, pH, ionic strength | PBS, pH 7.4, 150 mM NaCl |
| Temperature | Measurement temperature | 23 ± 1°C |
| Approach/Retract Settings | Velocity, trigger force, pause time | 1 µm/s, 250 pN, 0.5 s |
Table 2: Mandatory Adhesion Force & Rupture Metrics
| Metric | Definition | Typical Unit | Analysis Note |
|---|---|---|---|
| Adhesion Frequency | (Curves with adhesion / Total curves) x 100% | % | Report per replicate. |
| Maximum Adhesion Force (F_max) | Highest unbinding force in a retraction curve. | nN or pN | Report distribution (mean, median). |
| Total Adhesion Energy (E_adh) | Area under the retraction curve. | aJ (10⁻¹⁸ J) | Integral from contact point to baseline. |
| Rupture Length (L_rupt) | Distance of the last adhesion event from the surface. | nm | Indicates tether extensibility. |
| Number of Rupture Events | Discrete unbinding steps per curve. | Integer | Report average per adhesive curve. |
Table 3: Recommended Advanced Statistical & Population Metrics
| Metric | Description | Use Case |
|---|---|---|
| Work of Adhesion Distribution | Histogram of E_adh values across all curves. | Identifying sub-populations. |
| Force Spectrum | Plot of F_max vs. loading rate. | probing bond kinetics. |
| Detachment Profile | Rupture force vs. rupture length scatter plot. | Differentiating bond types. |
Standardized Experimental Protocols
Protocol 1: Cantilever Functionalization for Ligand Presentation
Objective: To reproducibly coat AFM tips with specific ligands (e.g., proteins, sugars) for measuring bacterial receptor-ligand interactions. Materials: See "Scientist's Toolkit" (Section 5). Steps:
- Cleaning: Plasma clean cantilevers for 5 minutes (air, 100 W).
- Vapor Silanization: Place tips in a desiccator with 50 µL of (3-aminopropyl)triethoxysilane (APTES) under vacuum for 30 min.
- Curing: Bake at 80°C for 10 min.
- Linker Attachment: Incubate tips in 0.5% glutaraldehyde in PBS for 30 min. Rinse 3x in PBS.
- Ligand Immobilization: Incubate tips in ligand solution (e.g., 0.1 mg/mL protein in suitable buffer) for 1 hour at room temperature in a humidity chamber.
- Quenching: Immerse tips in 1 M ethanolamine-HCl (pH 8.0) for 10 min to passivate unreacted aldehyde groups.
- Rinsing & Storage: Rinse 3x in measurement buffer. Use immediately or store in buffer at 4°C for <24h. Validation: Confirm functionalization via a control adhesion assay with a known complementary surface.
Protocol 2: Bacterial Sample Preparation for AFM Adhesion Mapping
Objective: To immobilize live bacterial cells onto a substrate without altering surface adhesins. Materials: Poly-L-lysine (PLL) coated substrate, bacterial culture, filter membrane (0.45 µm). Steps:
- Cell Harvest: Grow bacteria to desired phase. Pellet 1 mL culture (3000 × g, 5 min).
- Gentle Washing: Resuspend pellet gently in 1 mL of measurement buffer. Repeat 2x.
- Filtration Immobilization: Assemble a filter holder with a PLL-coated substrate (e.g., glass slide) on the filter bed. Pass 1-2 mL of washed cell suspension through the filter via gentle vacuum or pressure. This presses cells lightly onto the PLL surface.
- Rinse: Gently rinse the substrate with 2 mL of measurement buffer while still on the filter to remove loosely attached cells.
- Transfer: Carefully transfer the substrate to the AFM liquid cell and immerse in buffer. Validation: Check cell density and viability (e.g., live/dead stain) via optical microscopy.
Protocol 3: AFM Force-Volume Adhesion Measurement
Objective: To acquire a statistically robust dataset of force-distance curves from a bacterial sample. Instrument Setup:
- Mount the functionalized cantilever or cell probe.
- Align the laser and calibrate the spring constant using the thermal noise method.
- Engage on a clean area of the substrate to set the photodetector sensitivity. Measurement Parameters (Typical):
- Points per grid: 32x32 (1024 curves)
- Approach/Retract velocity: 0.5 - 1 µm/s
- Trigger force: 200-300 pN
- Pause at trigger: 0.1 - 0.5 s Execution:
- Move the probe to a region with immobilized bacteria (using optical view).
- Define the scan area (e.g., 5x5 µm) over a single cell.
- Run the force-volume acquisition.
- Repeat on at least 10 cells from 3 independent cultures (N=3).
Protocol 4: Adhesion Force Curve Analysis Workflow
Objective: To extract standardized metrics from raw force-distance curves. Software: Use established programs (e.g., Bruker NanoScope Analysis, JPK DP, AtomicJ, custom Igor/Matlab scripts). Steps:
- Baseline Correction: Subtract the non-contact baseline to set zero force.
- Contact Point Identification: Define the point where force deviates from baseline during approach.
- Retraction Curve Segmentation: Isolate the retraction trace for analysis.
- Adhesion Detection: Apply a force threshold (e.g., >10 pN) to identify adhesive events.
- Metric Extraction: For each adhesive curve, automatically record:
- Fmax: Minimum force value.
- Eadh: Numerical integration of the force-distance curve from contact point to the end of the last adhesion event.
- Rupture Events: Count peaks using a peak-finding algorithm (minimum prominence = threshold).
- L_rupt: Distance of the final rupture event.
- Data Aggregation: Compile all metrics into a table for statistical analysis and visualization.
Mandatory Visualizations
Standardized AFM Adhesion Analysis Workflow
Mandatory Reporting Metrics and Parameters
The Scientist's Toolkit: Key Research Reagent Solutions
Table 4: Essential Materials for AFM Bacterial Adhesion Studies
| Item | Function & Importance | Example Product/Supplier |
|---|---|---|
| AFM Cantilevers (Bio-levers) | Probes with low spring constant (0.01-0.1 N/m) for soft samples. Coating (e.g., gold) enables functionalization. | MLCT-Bio-DC (Bruker), qp-Bio (Nanosensors) |
| Spring Constant Calibration Kit | Certified reference cantilevers or calibrated spheres to validate thermal/other calibration methods. | CRP (Bruker), ArrayCal (Asylum Research) |
| Bifunctional PEG Linkers | Spacer molecules (e.g., NHS-PEG-NHS) to tether ligands to the tip, providing mobility and reducing non-specific binding. | MW 3000-5000 Da (BroadPharm, Iris Biotech) |
| (3-Aminopropyl)triethoxysilane (APTES) | Silane coupling agent to create an amine-functionalized surface on silicon nitride tips for subsequent chemistry. | 99% purity (Sigma-Aldrich) |
| Live/Dead Bacterial Viability Kit | Fluorescent dyes (SYTO9/propidium iodide) to confirm cell membrane integrity after immobilization. | BacLight (Thermo Fisher) |
| Poly-L-Lysine (PLL) Solution | A cationic polymer for electrostatic immobilization of bacterial cells onto negatively charged substrates. | 0.01% w/v aqueous (Sigma-Aldrich) |
| Certified Buffer Salts | High-purity salts (e.g., NaCl, KCl) and pH buffers (HEPES, PBS) to ensure consistent ionic strength and pH, critical for adhesion forces. | Molecular biology grade (e.g., MilliporeSigma) |
| Plasma Cleaner | Device for generating oxygen plasma to clean cantilevers and substrates, ensuring a contaminant-free, hydrophilic surface. | Harrick Plasma, Femto |
Conclusion
AFM force curve analysis stands as a uniquely powerful, single-molecule technique for quantifying bacterial adhesion forces, bridging nanoscale interactions with macroscopic phenomena like biofilm formation. Mastering the foundational science, rigorous methodology, troubleshooting protocols, and validation frameworks outlined here is essential for generating robust, publishable data. As the field advances, integrating AFM with omics approaches and high-throughput screening will further unlock its potential. For biomedical research, these precise measurements are directly informing the development of next-generation antimicrobial coatings, medical device materials, and therapeutic strategies aimed at disrupting critical adhesion events in infection and fouling.