3D Cell Culture in Microfluidics: A Complete Guide for Advancing Biomedical Research
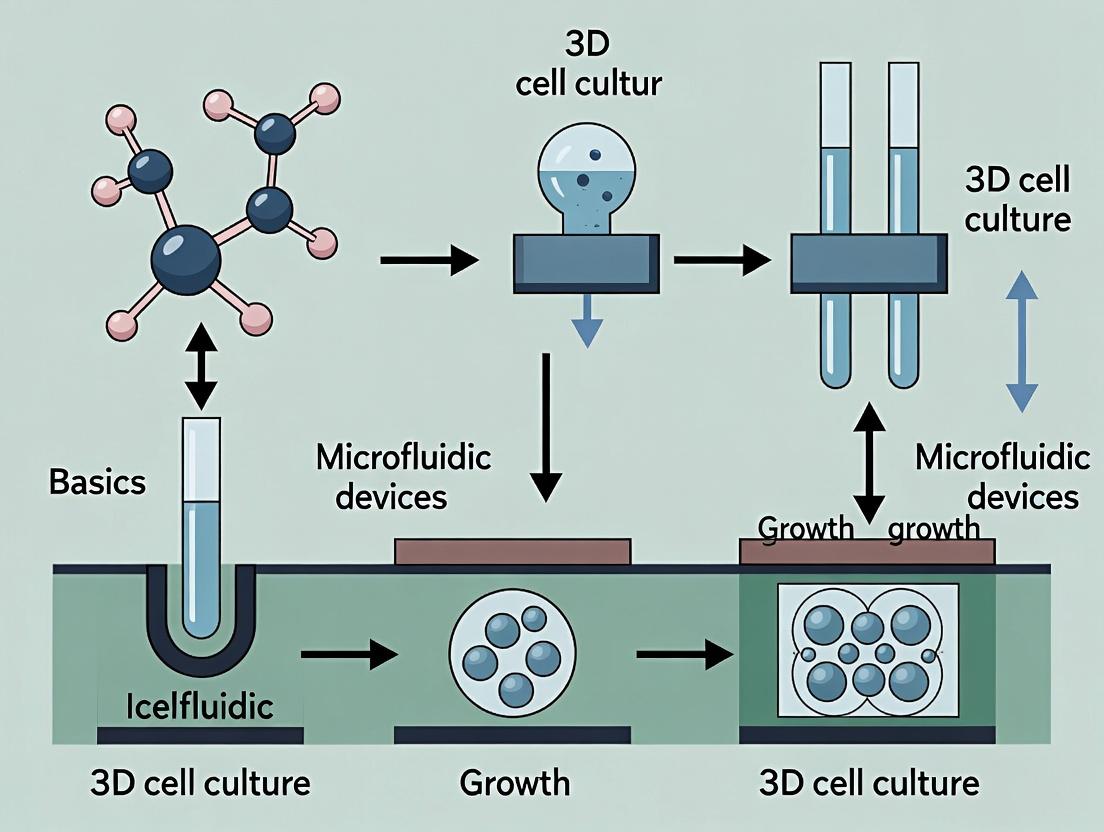
This comprehensive guide explores the fundamentals and advanced applications of 3D cell culture within microfluidic devices.
3D Cell Culture in Microfluidics: A Complete Guide for Advancing Biomedical Research
Abstract
This comprehensive guide explores the fundamentals and advanced applications of 3D cell culture within microfluidic devices. Targeting researchers and drug development professionals, it covers foundational principles, practical methodologies, troubleshooting strategies, and validation techniques. The article provides current insights into how organ-on-a-chip and spheroid cultures are revolutionizing disease modeling, drug screening, and personalized medicine by creating more physiologically relevant microenvironments.
From 2D to 3D: Understanding the Core Principles of Microfluidic Cell Culture
Why Move Beyond Traditional 2D Culture? Limitations and Physiological Gaps
Traditional two-dimensional (2D) cell culture on rigid plastic or glass substrates has been the cornerstone of in vitro biology for decades. However, its simplicity belies significant physiological inaccuracies. Framed within the broader thesis of advancing 3D cell culture in microfluidic devices, this document delineates the technical limitations of 2D systems and quantifies the gaps that necessitate a transition to more physiologically relevant models.
Quantitative Limitations of 2D Culture
The discrepancies between 2D culture and in vivo physiology can be systematically quantified across multiple parameters.
Table 1: Comparative Analysis of 2D Culture vs. In Vivo Physiology
| Parameter | Traditional 2D Culture | In Vivo Tissue Physiology | Physiological Gap & Consequence |
|---|---|---|---|
| Cell Morphology & Polarity | Forced apical-basal flattening; loss of 3D shape. | Defined 3D architecture; apical-basal polarity in epithelia. | Altered cytoskeletal organization; aberrant mechanotransduction. |
| Cell-Cell & Cell-ECM Interactions | Limited to flat plane; unnatural adhesion to rigid plastic. | Multidirectional; complex integrin-ECM binding in soft, 3D matrix. | Deficient signaling (e.g., integrin, Wnt, Hedgehog); anoikis resistance not modeled. |
| Proliferation & Differentiation | Hyper-proliferation; spontaneous differentiation or de-differentiation. | Tightly regulated by niche signals and spatial constraints. | Overestimation of drug efficacy; failure to model quiescent/stem cell populations. |
| Gene Expression Profile | Significant transcriptomic drift from tissue of origin. | Tissue-specific, stable expression profile maintained. | Poor predictive value for in vivo drug response and toxicity. |
| Metabolic Activity | High glycolytic flux due to hyper-proliferation and ample nutrient access. | Heterogeneous, governed by gradients (O2, nutrients) and zonation. | Inaccurate modeling of drug metabolism (e.g., cytochrome P450 activity). |
| Drug/Toxin Response | Uniform, direct exposure; poor barrier function modeling. | Graded penetration; influenced by stroma and tissue barriers. | Up to 90% of compounds showing efficacy in 2D fail in clinical trials. |
| Oxygen & Nutrient Gradients | Homogeneous distribution via diffusion in media. | Steep physiological gradients (e.g., in tumors, liver lobules). | Lack of hypoxic cores; no modeling of gradient-driven phenotypes. |
| Mechanical Forces | Substrate stiffness ~1 GPa (glass/plastic). | Tissue stiffness 0.1 kPa (brain) to >10 kPa (bone). | Misregulated mechanosensing (YAP/TAZ), migration, and metastasis. |
Detailed Experimental Protocols Highlighting 2D Limitations
The following protocols are cited to demonstrate key experiments that reveal the inadequacies of 2D culture.
Protocol: Assessing Drug Penetration Dynamics
Aim: To compare the penetration and efficacy of a chemotherapeutic (e.g., Doxorubicin) in 2D monolayer vs. a 3D spheroid model. Materials: MCF-7 cell line, standard DMEM, ultra-low attachment (ULA) plates, doxorubicin (fluorescent), confocal microscope. Method:
- 2D Culture: Seed cells in a 96-well plate at 10,000 cells/well. Allow to adhere for 24h.
- 3D Spheroid Culture: Seed 5,000 cells/well in a U-bottom ULA plate. Centrifuge at 300g for 3 min. Incubate for 72h to form a single spheroid per well.
- Treatment: Add doxorubicin (1 µM final concentration) to both models. Incubate for 24h.
- Analysis: Image using confocal microscopy (ex/em ~480/590 nm). In 2D, quantify whole-well fluorescence intensity. In 3D, create Z-stacks to measure fluorescence intensity as a function of depth from the spheroid periphery. Expected Outcome: Uniform fluorescence in 2D monolayer. In 3D spheroids (>500 µm diameter), a gradient will be observed, with significantly reduced signal in the core, modeling poor drug penetration seen in solid tumors.
Protocol: Transcriptomic Drift Analysis
Aim: To quantify gene expression changes between primary tissue, early-passage 2D culture, and late-passage 2D culture. Materials: Primary human hepatocytes, Hepatocyte Growth Medium, collagen-coated plates, RNA sequencing kit. Method:
- Extract RNA from (a) fresh primary hepatocytes, (b) P2 (passage 2) 2D cultures, and (c) P8 2D cultures (n=3 each).
- Perform RNA-seq library preparation and sequencing (30M reads/sample, paired-end).
- Align reads to the human genome (GRCh38). Perform differential expression analysis (e.g., using DESeq2). Focus on genes related to cytochrome P450 metabolism, plasma protein synthesis, and polarity (e.g., CYP3A4, ALB, CEACAM1). Expected Outcome: A significant downregulation (>10-fold) of key hepatic function genes in P2 and P8 cultures compared to primary tissue, demonstrating rapid loss of phenotype in 2D.
Visualizing Key Signaling Pathways Affected by 2D Culture
The following diagrams illustrate pathways that are fundamentally distorted in a 2D environment.
Diagram 1: Mechanotransduction Dysregulation in 2D
Diagram 2: Drug Development Decision Tree: 2D vs 3D Models
The Scientist's Toolkit: Key Reagents for Transitioning to 3D Models
Table 2: Essential Research Reagent Solutions for Advanced 3D Culture
| Item | Function & Rationale |
|---|---|
| Basement Membrane Extract (BME, e.g., Matrigel) | A gelatinous protein mixture providing a physiologically relevant 3D scaffold for cell growth, differentiation, and morphogenesis. Essential for organoid culture. |
| Synthetic Hydrogels (e.g., PEG-based) | Tunable, chemically defined matrices allowing precise control over stiffness, degradability, and biochemical cues (via RGD peptides). Reduces batch variability. |
| Ultra-Low Attachment (ULA) Plates | Surfaces coated with hydrogel or covalently bound polymers to inhibit cell attachment, forcing cells to aggregate and form 3D spheroids. |
| Microfluidic Organ-on-a-Chip Devices | PDMS or polymer chips with microchannels and chambers enabling perfusion, co-culture, and application of mechanical forces (e.g., shear stress, stretch). |
| Oxygen-Sensitive Probes & Live-Cell Dyes (e.g., Image-iT) | Chemical probes (e.g., for ROS, hypoxia) and fluorescent cell trackers to monitor metabolic gradients and cell dynamics in real-time within 3D structures. |
| Selective Pathway Inhibitors/Activators | Small molecules (e.g., Y-27632 (ROCK), CHIR99021 (Wnt)) crucial for initiating and maintaining stemness and polarization in 3D organoid cultures. |
| Tissue-Derived Decellularized ECM (dECM) | Provides tissue-specific biochemical and architectural cues, offering a more native niche than generic matrices for specialized cell types. |
The quantitative and qualitative data presented herein unequivocally demonstrate that traditional 2D culture creates an artifact-prone environment that widens the physiological gap, contributing directly to high failure rates in drug development. The integration of 3D culture within perfusable microfluidic devices (Organs-on-Chips) directly addresses these limitations by reconstituting tissue-tissue interfaces, mechanical forces, and physiologic gradients. This evolution is not merely technical but fundamental, enabling models that bridge the gap between conventional in vitro assays and in vivo reality, thereby de-risking the pipeline from discovery to clinic.
This guide provides a technical foundation for microfluidic 3D cell culture, framed within the broader thesis that in-vivo-like tissue models are essential for advancing fundamental biological research and preclinical drug development. Traditional 2D culture and static 3D cultures fail to recapitulate the dynamic microenvironment of living tissues. Microfluidic 3D culture, or "organ-on-a-chip" technology, addresses this by integrating key physiological components and principles into a miniaturized, controlled platform.
Key Components of a Microfluidic 3D Culture System
A functional microfluidic 3D culture platform comprises several integrated physical and biological components, as detailed in Table 1.
Table 1: Core Components of a Microfluidic 3D Culture Device
| Component Category | Specific Element | Function & Description | Common Materials |
|---|---|---|---|
| Structural Frame | Microfluidic Chip/Device | The main platform housing all components and fluidic networks. | Polydimethylsiloxane (PDMS), Polymethyl methacrylate (PMMA), Cyclic olefin copolymer (COC), Glass |
| Fluidic Network | Microchannels (10-500 µm) | Conduits for cell/media perfusion, establishing controlled flow. | Etched/embossed into chip material |
| Inlets/Outlets | Ports for introducing cells, media, drugs, and removing waste. | Integrated ports or punched holes | |
| Pumps | Generate precise, physiologically relevant fluid flow. | Syringe pumps, peristaltic pumps, osmotic pumps | |
| Cell Culture Zone | Extracellular Matrix (ECM) Chamber | Region for 3D hydrogel embedding of cells to mimic tissue stroma. | Matrigel, Collagen I, Fibrin, Alginate, synthetic PEG hydrogels |
| Physical Scaffolds (Optional) | Provide structural support for cells in some models. | Polymer meshes, porous membranes | |
| Environmental Control | Gas Exchange Membranes | Allow for oxygen and CO₂ diffusion (e.g., for air-blood barrier models). | Thin PDMS, Porous polyethylene terephthalate (PET) |
| Sensors (Advanced) | Monitor parameters like pH, O₂, glucose in real-time. | Integrated electrochemical/optical sensors | |
| Accessory Systems | Valves | Control fluid direction and timing (for multiplexing). | Pneumatic, mechanical pinch valves |
| Reservoirs | Store inlet and outlet media. | Tubing-connected wells or off-chip containers |
Core Working Principles
The functionality of these devices arises from the application of fundamental physical and biological principles.
1. Laminar Flow: At the microscale, fluids flow in parallel streams with minimal turbulence (low Reynolds number). This enables precise spatial control over solute gradients and the creation of patterned co-cultures.
2. Continuous Perfusion: Driven by pumps, media continuously flows past the cultured tissue. This mimics blood/lymphatic perfusion, providing:
- Sustained nutrient supply and waste removal.
- Application of physiologically relevant shear stresses on cells (e.g., endothelial cells).
- Stable, long-term culture conditions.
3. Dynamic Microenvironment Control: The system allows real-time manipulation of biochemical (solute gradients) and biophysical (shear stress, stiffness) cues.
4. Barrier Function Modeling: By patterning channels and cell types, functional tissue-tissue interfaces (e.g., epithelium-endothelium) can be engineered to study absorption, filtration, and disease mechanisms.
Diagram 1: Workflow and Core Principles
Detailed Experimental Protocol: Establishing a Basic 3D Co-culture Model
This protocol details the creation of a common two-channel "organ-on-a-chip" model featuring a 3D hydrogel tissue compartment adjacent to a perfused endothelialized channel.
Objective: To establish a microfluidic 3D co-culture model of a vascularized tissue unit for permeability or drug response studies.
Materials:
- PDMS-based microfluidic device (e.g., from commercial source or fabricated via soft lithography).
- Sterile tubing (e.g., Tygon) and connectors.
- Programmable syringe pump.
- Vacuum desiccator.
- Cells of interest (e.g., primary parenchymal cells, cell line) and endothelial cells (HUVECs).
- ECM hydrogel (e.g., Collagen I, 4-6 mg/mL).
- Cell culture media specific to each cell type.
- Phosphate-buffered saline (PBS), sterile.
- Sterilization equipment (e.g., UV ozone cleaner, autoclave).
Procedure:
Step 1: Device Preparation and Sterilization
- Place the PDMS device and glass slide in a UV ozone cleaner for 15-20 minutes per side for sterilization and surface activation.
- Assemble the device if components are separate.
Step 2: ECM Hydrogel Preparation and Loading
- Prepare the cell-ECM suspension on ice. Mix the desired cell density (e.g., 5-10 million cells/mL) with the liquid, unpolymerized hydrogel matrix. Adjust pH according to the matrix protocol (e.g., using NaOH for collagen).
- Pipette the cell-ECM mixture into the inlet of the designated tissue chamber. Use vacuum aspiration at the outlet port to gently draw the mixture into the chamber, avoiding bubble formation. Do not let the hydrogel enter the adjacent fluidic channels.
- Immediately transfer the device to a 37°C, 5% CO₂ incubator for 15-30 minutes to allow complete hydrogel polymerization.
Step 3: Endothelial Channel Seeding
- Prepare a suspension of endothelial cells at high density (e.g., 10-15 million cells/mL) in their growth medium.
- After gelation, pipette the endothelial cell suspension into the inlet of the adjacent fluidic channel.
- Temporarily place a higher volume of media in the tissue chamber outlet well than its inlet well to create a slight pressure bias toward the tissue chamber. This prevents the endothelial cells from entering the hydrogel chamber.
- Allow the device to sit statically in the incubator for 1-2 hours for endothelial cells to adhere to the channel wall adjacent to the hydrogel.
Step 4: System Assembly and Initiation of Perfusion
- Connect sterile tubing to the inlet and outlet ports of the endothelial channel. Connect the inlet tubing to a media reservoir on the syringe pump.
- Fill all tubing and ports with warm culture media, ensuring no air bubbles remain in the microchannels.
- Program the syringe pump to initiate a slow, continuous flow (e.g., 0.1-5 µL/min, depending on channel dimensions and desired shear stress).
- Place the entire assembled system in the incubator for continuous culture. Media is typically changed every 24-48 hours.
Step 5: Experimental Intervention and Analysis
- After 3-7 days of culture (once stable barriers/formats are established), introduce test compounds (drugs, cytokines) via the endothelial channel or tissue chamber media.
- Conduct real-time imaging, collect effluent for analysis, or fix and stain the device at endpoints for immunohistochemistry.
The Scientist's Toolkit: Essential Research Reagents and Materials
Table 2: Key Reagent Solutions for Microfluidic 3D Culture
| Item | Function/Role | Example Products/Types |
|---|---|---|
| PDMS (Sylgard 184) | The most common elastomer for rapid prototyping; gas-permeable, transparent, biocompatible. | Dow Sylgard 184 Kit |
| ECM Hydrogels | Provide the 3D scaffold that mimics the in-vivo extracellular matrix. Critical for cell morphology and signaling. | Corning Matrigel (basement membrane), Rat Tail Collagen I, Fibrin from bovine plasma, Alginate (marine-derived) |
| Synthetic Hydrogels | Defined, tunable matrices (stiffness, degradability, bioactivity) for reductionist studies. | Polyethylene glycol (PEG)-based (e.g., PEG-norbornene), Peptide hydrogels (RADA16) |
| Cell Culture Media | Formulated to support specific cell types under perfusion conditions. May require optimization for micro-volumes. | Standard commercial media (DMEM, RPMI), Specialty organ-specific media, Serum-free formulations |
| Tubing & Connectors | Conduits for fluid delivery; must be gas-impermeable and biocompatible for long-term culture. | Tygon S3 E-LFL, PTFE, PEEK connectors, Luer stubs |
| Programmable Syringe Pumps | Provide precise, pulseless, and continuous fluid flow essential for maintaining physiological shear and gradients. | Harvard Apparatus PHD ULTRA, neMESYS by Cetoni, Chemyx Fusion series |
| LIVE/DEAD Viability Assay | Standard for assessing cell viability directly within the microfluidic device via fluorescence microscopy. | Thermo Fisher Scientific (Calcein AM / Ethidium homodimer-1) |
| Fluorescent Tracers (Dextrans) | Used to quantify endothelial barrier permeability and diffusion kinetics within the 3D tissue. | Tetramethylrhodamine (TRITC)-Dextran (70 kDa, 150 kDa) |
| Antibodies for In-Situ Staining | For endpoint analysis of protein expression and spatial organization within the 3D construct. | Antibodies against ZO-1 (tight junctions), Vimentin, E-Cadherin, with species-appropriate secondaries |
Key Signaling Pathways Recapitulated
Microfluidic 3D culture platforms allow for the study of signaling in a physiologically relevant context. A critical pathway often investigated is the response to fluid shear stress in endothelial cells, which is pivotal in vascular biology and barrier function.
Diagram 2: Shear Stress Signaling in Vascular Models
Microfluidic 3D culture is defined by the integration of key components—a structured microscale device, a perfused fluidic network, and a biomimetic 3D extracellular matrix—operating on core principles of laminar flow, continuous perfusion, and dynamic microenvironmental control. When executed with the detailed protocols and tools outlined, this technology provides a powerful in-vitro platform that bridges the gap between traditional cell culture and animal models, directly supporting the foundational thesis that physiologically relevant human tissue models are indispensable for meaningful biomedical research and translation.
The transition from traditional two-dimensional (2D) cell culture to three-dimensional (3D) models within microfluidic devices represents a paradigm shift in biological research and drug development. This technical guide, framed within the broader thesis of 3D cell culture in microfluidics research, details the critical importance of replicating the in vivo microenvironment—specifically, tissue-specific niches and biochemical gradients. These elements are fundamental to cellular function, fate, and response, and their accurate in vitro reconstruction is paramount for generating physiologically relevant models for disease modeling, toxicity testing, and therapeutic screening.
Core Principles: Niches and Gradients
The tissue microenvironment comprises a complex, dynamic 3D architecture. A niche is a specialized, local tissue compartment that houses and influences stem or progenitor cells through a combination of cellular, physical, and chemical signals. Gradients are spatial variations in the concentration of soluble factors (e.g., growth factors, chemokines), gases (e.g., O₂, CO₂), or physical properties (e.g., stiffness, topology) that guide cellular behaviors such as migration, proliferation, and differentiation.
Microfluidic platforms, or "organs-on-chips," excel at controlling these parameters with high spatiotemporal precision, overcoming the limitations of static, homogeneous macroscopic 3D cultures.
Quantitative Data on Key Microenvironmental Parameters
The following tables summarize critical parameters for mimicking in vivo conditions.
Table 1: Key Physicochemical Parameters of Common Tissue Niches
| Tissue/Organ | Stiffness (kPa) | Predominant ECM Components | Key Soluble Factor Gradients | Oxygen Tension (% O₂) |
|---|---|---|---|---|
| Brain | 0.5 - 1 | Hyaluronic Acid, Laminin, Collagen IV | Netrin, Slit, BDNF | 0.5 - 5% (Highly Variable) |
| Lung (Alveolar) | 2 - 5 | Collagen I/IV, Elastin, Laminin | VEGF, TGF-β, BMP4 | 10 - 15% (Air-Exposed) |
| Liver (Sinusoid) | 1 - 5 | Collagen I/III/IV, Laminin, Fibronectin | Wnt, HGF, Insulin | 3 - 8% (Periportal to Pericentral) |
| Bone Marrow | > 20 (Bone) ~0.5 (Stroma) | Collagen I, Fibronectin, Hyaluronan | SDF-1α (CXCL12), SCF, OPN | 1 - 6% (Hypoxic Niche) |
| Solid Tumor | 0.5 - 50 (Heterogeneous) | Collagen I, Hyaluronan, Tenascin-C | VEGF, EGF, Lactate (pH Gradient) | 0.1 - 5% (Core Hypoxia) |
Table 2: Comparison of Gradient Generation Techniques in Microfluidics
| Technique | Principle | Gradient Shape | Typical Establishment Time | Key Application |
|---|---|---|---|---|
| Flow-Based (Co-Laminar) | Parallel streams of different concentrations diffuse at interface. | Linear, Stable with continuous flow | Seconds | Chemotaxis studies, Drug screening |
| Microfluidic Probe | Localized perfusion via a scanning probe. | User-defined, Dynamic | Minutes to Hours | Patterned stimulation, Wound healing |
| Source-Sink (Dialysis) | Diffusion from a source channel through a porous membrane/gel to a sink. | Exponential, Stable in static condition | Minutes to Hours | Stem cell differentiation, Neurogenesis |
| Hydrogel-Based Diffusion | Factor loaded into/behind a hydrogel plug. | Exponential, Decaying over time | Hours to Days | Angiogenesis, Metastasis invasion |
Experimental Protocols
Protocol 1: Establishing a Stable Chemokine Gradient for 3D Leukocyte Migration Assay
Objective: To create a linear CXCL12 gradient in a collagen I matrix within a three-channel microfluidic device to study T-cell migration. Materials: PDMS microfluidic chip (central gel channel, two side media channels), rat tail Collagen I (5 mg/mL), naïve CD4+ T-cells, CXCL12 in RPMI, cell-tracker dye. Method:
- Chip Preparation: Sterilize PDMS chip (UV/O₂ plasma, 30 min). Pre-cool all components on ice.
- Cell-ECM Mix Preparation: Neutralize collagen I solution on ice per manufacturer's protocol. Mix with T-cell suspension to a final density of 2x10⁶ cells/mL in 3 mg/mL collagen.
- Gel Loading: Pipette 10 µL of cell-collagen mix into the central gel channel. Incubate at 37°C, 5% CO₂ for 30 min for polymerization.
- Gradient Establishment: Fill one side channel with medium containing 200 ng/mL CXCL12 ("Source"). Fill the opposite side channel with medium alone ("Sink"). Maintain hydrostatic pressure balance.
- Imaging & Analysis: Place chip on live-cell imager (37°C, 5% CO₂). Acquire time-lapse images every 5 min for 4 hours at 10X. Track cell trajectories using manual tracking or software (e.g., TrackMate in Fiji). Calculate migration velocity, directionality, and chemotactic index.
Protocol 2: Fabricating a Stiffness-Gradient Hydrogel for Metastatic Invasion Studies
Objective: To generate a linear stiffness gradient within a fibrin gel to model the tumor-stroma interface for cancer cell invasion. Materials: Microfluidic gradient mixer chip, PEGDA (6kDa), photoinitiator (LAP), fibrinogen, thrombin, metastatic breast cancer cells (MDA-MB-231). Method:
- Gradient Precursor Solutions: Prepare two PEGDA-fibrinogen precursor solutions: Solution A (Soft): 3% (w/v) PEGDA, 5 mg/mL fibrinogen, 0.1% LAP. Solution B (Stiff): 10% (w/v) PEGDA, 5 mg/mL fibrinogen, 0.1% LAP. Keep on ice, protected from light.
- Gradient Generation: Connect syringes containing Solution A and B to the inlets of a linear gradient generator chip. Connect a single outlet syringe to collect the mixed solution. Use a syringe pump to simultaneously infuse both precursors at equal rates (10 µL/min total).
- Gel Polymerization: Mix the collected gradient stream with thrombin solution (1 U/mL final) immediately before loading into a chambered coverslip. Expose to 405 nm light (5 mW/cm², 60 s) for PEG crosslinking, followed by incubation at 37°C for 30 min for fibrin polymerization.
- Cell Seeding & Culture: Seed GFP-labeled cancer cells on top of the polymerized gradient gel. Image after 72 hours using confocal microscopy. Quantify invasion depth and cell morphology as a function of local gel stiffness (calibrated via atomic force microscopy).
Visualization of Key Concepts
Title: Microfluidic Gradient-Driven Cell Migration
Title: Key Components of a Synthetic Stem Cell Niche
The Scientist's Toolkit: Essential Research Reagent Solutions
Table 3: Key Reagents for Constructing Microenvironment-Mimetic Models
| Reagent / Material | Function & Rationale | Example Vendor/Product |
|---|---|---|
| Tunable Hydrogels (Synthetic) | Provide precise, decoupled control over stiffness, ligand density, and degradability. Essential for mechanobiology studies. | BioTek PEGDA / PEG-RGD; Cellendes Mebiol Gel. |
| Decellularized ECM (dECM) | Contains the full, tissue-specific complement of native ECM proteins and bound factors for niche replication. | MatriGene (Liver, Heart dECM); Sigma-Aldridge Cultrex BME. |
| Recombinant Morphogens & Chemokines | High-purity proteins for establishing defined, quantitative soluble gradients (e.g., VEGF, BMP, CXCL12). | PeproTech; R&D Systems. |
| Gas-Permeable Membranes / Materials | Enable precise control over O₂/CO₂ tensions, crucial for modeling hypoxia or air-liquid interfaces (e.g., lung). | Ibidi Gas Permeable Plates; PDMS. |
| Microfluidic Chip Fabrication Resins | High-resolution, biocompatible resins for prototyping chips with complex microarchitecture. | Formlabs Biomedical Resin; ASIGA. |
| Live-Cell Imaging Dyes (Viability, ROS, Ca²⁺) | Report on real-time cellular responses to microenvironmental cues without fixation. | Thermo Fisher CellTracker, Invitrogen ROS/Sensor dyes. |
| Matrisome / Adhesome Array Kits | Screen cell-ECM interactions or secreted matrix proteins to define niche-specific signatures. | RayBiotech ECM Protein Array. |
Within the foundational thesis of 3D cell culture in microfluidic devices, three major advanced model systems have emerged as transformative tools: spheroids, organoids, and organ-on-a-chip (OoC) systems. These models bridge the gap between traditional 2D cell cultures and complex, often ethically challenging, in vivo studies. This whitepaper provides an in-depth technical comparison, protocols, and resource guidelines for researchers and drug development professionals.
Core Definitions and Comparative Analysis
Spheroids are simple, self-assembled 3D aggregates of one or more cell types. They model cell-cell interactions and gradients (e.g., oxygen, nutrients) seen in tissues like tumors.
Organoids are complex, stem cell-derived 3D structures that self-organize through cell sorting and lineage commitment, recapitulating key architectural and functional aspects of a specific organ.
Organ-on-a-Chip (OoC) systems are microfluidic devices containing engineered or natural miniature tissues cultured within continuously perfused, micrometer-sized chambers that simulate physiological microenvironments and forces.
Table 1: Quantitative Comparison of Major 3D Model Types
| Feature | Spheroids | Organoids | Organ-on-a-Chip |
|---|---|---|---|
| Cellular Complexity | Low to Medium (1-3 cell types) | High (Multiple cell types, stem cell-derived) | Configurable (1+ tissue types) |
| Architectural Fidelity | Low (Gradient-driven organization) | High (Self-organized, organ-specific) | Engineered (Microfabricated structures) |
| Throughput | High (96/384-well plates) | Medium (24/96-well plates) | Low to Medium (Device-dependent) |
| Lifespan | Days to 2 weeks | Weeks to months | Days to weeks (perfused) |
| Physiological Relevance | Gradients, basic cell-cell contact | Gene expression, multicellular organization | Mechanical forces (shear, strain), tissue-tissue interfaces |
| Assay Compatibility | High (compatible with HTS) | Medium (imaging-intensive) | Medium (often custom analysis) |
| Cost per Unit | Low ($1-$10) | Medium ($10-$100) | High ($100-$1000+ for commercial) |
| Key Application | High-throughput drug screening, hypoxia studies | Disease modeling, developmental biology, personalized medicine | ADME/Tox studies, mechanistic physiology, multi-organ interaction |
Detailed Experimental Protocols
Protocol 2.1: Generation of Multicellular Tumor Spheroids via the Hanging Drop Method
Objective: To produce uniform, scaffold-free spheroids for chemotherapy screening. Materials: Tumor cell line (e.g., MCF-7), complete growth medium, 96-well plate with low-attachment surface or hanging drop tray, PBS.
- Harvest cells at 70-80% confluence using standard trypsinization. Centrifuge (300 x g, 5 min) and resuspend in complete medium.
- Count cells and adjust density to 5.0 x 10³ to 2.5 x 10⁴ cells/mL, depending on desired final spheroid size (typically 200-500 µm).
- Hanging Drop Method: Pipette 20-30 µL of cell suspension onto the lid of a 96-well plate. Invert the lid and place over a plate filled with PBS to maintain humidity. Cells aggregate at the liquid-air interface in each drop.
- Incubate at 37°C, 5% CO₂ for 3-5 days. Spheroids will form and compact.
- For assay transfer, gently pipette spheroids from the drops or use a low-attachment plate for bulk culture.
Protocol 2.2: Establishing Intestinal Organoids from Human Pluripotent Stem Cells (hPSCs)
Objective: To derive human intestinal organoids (HIOs) modeling the crypt-villus structure. Materials: hPSCs, definitive endoderm induction medium (Activin A), intestinal specification medium (FGF4, CHIR99021), Matrigel, Intestinal growth medium (EGF, Noggin, R-spondin-1).
- Differentiate hPSCs to definitive endoderm using Activin A (100 ng/mL) in RPMI for 3 days.
- Induce hindgut specification by culturing endoderm clusters in RPMI with FGF4 (500 ng/mL) and CHIR99021 (3 µM) for 4 days, forming 3D spheroids.
- Embed hindgut spheroids in 30 µL Matrigel droplets in a 48-well plate. Polymerize at 37°C for 20 min.
- Overlay with intestinal growth medium supplemented with EGF (50 ng/mL), Noggin (100 ng/mL), and R-spondin-1 (500 ng/mL). Culture for 14-21 days, with medium changes every 3-4 days.
- Organoids can be passaged every 7-10 days by mechanical disruption and re-embedding in fresh Matrigel.
Protocol 2.3: Operating a Liver-on-a-Chip for Toxicity Testing
Objective: To culture hepatic spheroids under perfusion and assess compound toxicity. Materials: Commercial or PDMS-based liver-chip, primary human hepatocytes & non-parenchymal cells, perfusion medium, syringe pump, test compound.
- Cell Preparation: Form pre-aggregated hepatic spheroids (see Protocol 2.1) or load a cell suspension into the chip's tissue chamber.
- Device Priming: Connect medium reservoirs and waste lines. Prime all microfluidic channels with medium to remove air bubbles.
- Cell Loading: Introduce cell spheroids/suspension into the designated tissue chamber via inlet ports.
- Perfusion Culture: Connect the chip to a syringe pump. Initiate continuous medium flow at a physiological shear stress (e.g., 0.5 - 2 dyne/cm²). Place the entire assembly in a 37°C incubator.
- Dosing & Sampling: After 3-5 days of stabilization, introduce the test compound into the perfusion medium reservoir. Collect effluent from the waste line at timed intervals for biomarker analysis (e.g., albumin, urea, LDH).
- Endpoint Analysis: At experiment termination, fix cells in situ for immunostaining or extract for RNA/protein analysis.
Signaling Pathways and Workflows
Diagram 1: Key Pathways in Intestinal Organoid Development
Diagram 2: Workflow for 3D Model Selection
The Scientist's Toolkit: Essential Research Reagents & Materials
Table 2: Key Reagent Solutions for 3D Microfluidic Culture Research
| Item | Function & Description | Example Application |
|---|---|---|
| Basement Membrane Matrix (e.g., Matrigel, Cultrex) | Provides a 3D, biologically active scaffold rich in laminin, collagen, and growth factors to support cell polarization and morphogenesis. | Embedding for organoid growth; coating microfluidic channels. |
| Synthetic Hydrogels (e.g., PEG-based, Alginate) | Chemically defined, tunable scaffolds allowing precise control over mechanical properties (stiffness, porosity) and biochemical functionalization. | Creating engineered microenvironments in OoC; decoupling matrix effects. |
| R-spondin-1 / Noggin / EGF ("ENR" Cocktail) | Critical growth factor combination for maintaining intestinal stem cell niches and promoting epithelial growth in organoids. | Long-term culture of intestinal, gastric, and liver organoids. |
| Low-Adhesion / U-Shaped Bottom Microplates | Physically prevent cell attachment, forcing cells to aggregate and form spheroids via cell-cell adhesion. | High-throughput spheroid formation for screening assays. |
| Microfluidic Chip (PDMS or commercial) | PDMS chips allow custom design; commercial chips offer standardized, often multi-channel, perfusion systems for tissue culture. | Creating physiological flow, shear stress, and multi-tissue interfaces in OoC. |
| Programmable Syringe/Peristaltic Pump | Provides precise, continuous, or intermittent medium flow through microfluidic devices, mimicking blood circulation. | Maintaining long-term OoC culture; applying physiological shear stress. |
| Viability/Cytotoxicity Assay (3D-optimized, e.g., ATP-based) | Luminescent or fluorescent assays specifically validated for penetration and accuracy in 3D tissue structures. | Quantifying cell viability and compound efficacy/toxicity in spheroids/organoids. |
Within the field of 3D cell culture in microfluidic devices, the selection of fabrication materials is foundational to experimental success. The material dictates biocompatibility, mechanical properties, optical clarity, and permeability, directly influencing cell behavior and assay outcomes. This whitepaper provides an in-depth technical guide to the three cornerstone material classes: Poly(dimethylsiloxane) (PDMS), thermoplastics, and hydrogels. Their unique properties, fabrication methodologies, and applications are examined within the critical context of creating physiologically relevant microenvironments for drug development and basic research.
Poly(dimethylsiloxane) - PDMS
PDMS, an elastomeric silicone, is the dominant material for rapid prototyping of microfluidic devices for cell culture due to its ease of use and favorable properties.
Key Properties:
- Gas Permeability: High permeability to O₂ and CO₂ is crucial for long-term cell viability.
- Optical Transparency: Enables high-resolution microscopy from UV to near-IR.
- Biocompatibility: Generally inert and non-toxic for many cell types.
- Elasticity: Allows integration of pneumatic valves and pumps on-chip.
Primary Fabrication Protocol: Soft Lithography
- Master Fabrication: A silicon wafer is coated with a negative photoresist (e.g., SU-8) via spin coating.
- Photolithography: The resist is exposed to UV light through a photomask defining the channel design, then developed to create a relief master.
- PDMS Casting: A 10:1 (w/w) mixture of PDMS base and curing agent is poured over the master and degassed.
- Curing: Cured at 65-80°C for 1-2 hours.
- Bonding: The cured PDMS slab is peeled, access ports are punched, and the slab is bonded to a glass slide or another PDMS layer via oxygen plasma treatment (typically 30-60 seconds at high RF, 0.1-0.4 mbar).
Limitations: Hydrophobic recovery post-plasma, absorption of small hydrophobic molecules (e.g., drugs), and inherent softness which can limit channel geometry fidelity.
Table 1: Quantitative Properties of PDMS (Sylgard 184)
| Property | Typical Value | Impact on 3D Cell Culture |
|---|---|---|
| Young's Modulus | 1-3 MPa | Softer than many tissues; can be tuned (~0.1-3 MPa) by mixing ratio. |
| Oxygen Permeability | ~800 barrers | Excellent for aerobic cell culture. |
| Water Contact Angle | ~110° (native), ~10° (post-plasma) | Requires surface treatment for aqueous filling and hydrogel patterning. |
| Autofluorescence | Low in visible range, high in UV | Compatible with common fluorescent dyes (e.g., FITC, TRITC). |
Thermoplastics
Thermoplastics like polystyrene (PS), poly(methyl methacrylate) (PMMA), and cyclic olefin copolymer (COC) are used for commercial and high-throughput microfluidic devices.
Key Properties:
- Rigidity: Enables precise, high-aspect-ratio channels and prevents deformation during operation.
- Chemical Resistance: Broader resistance to solvents compared to PDMS.
- Manufacturability: Suitable for mass production via injection molding or hot embossing.
- Low Absorption: Minimal absorption of small molecules, critical for quantitative drug studies.
Primary Fabrication Protocol: Hot Embossing
- Master/Mold Creation: A metal (e.g., nickel) master mold is fabricated via micromachining or electroplating from a photoresist master.
- Heating: A thermoplastic substrate (e.g., COC sheet) and the mold are heated above the polymer's glass transition temperature (Tg).
- Embossing: Force is applied to press the mold into the softened polymer.
- Cooling & Demolding: The system is cooled below Tg, and the mold is separated, leaving the patterned substrate.
- Bonding: The patterned substrate is sealed to a cover layer using solvent bonding, thermal fusion bonding, or adhesive films.
Limitations: Requires specialized equipment for fabrication; surface modification (e.g., protein coating) is often necessary for cell adhesion.
Table 2: Common Thermoplastics for Microfluidics
| Polymer | Tg (°C) | Key Advantage | Primary Use Case |
|---|---|---|---|
| Polystyrene (PS) | ~100 | Tissue-culture treated, biocompatible | Standard for adherent 2D/3D culture in well-plates; devices for cytotoxicity. |
| Poly(methyl methacrylate) - PMMA | ~105 | Excellent optical clarity, low cost | Prototyping via laser ablation; visible spectrum imaging. |
| Cyclic Olefin Copolymer (COC) | 80-180 | Very low autofluorescence, high chemical resistance | High-resolution fluorescence imaging; organic solvent applications. |
Hydrogels
Hydrogels are hydrated polymer networks that form the 3D extracellular matrix (ECM) mimic for encapsulating cells. They are often used as the core material within devices fabricated from PDMS or plastics.
Key Properties:
- Biomimicry: Can replicate the viscoelasticity and biochemical cues of native tissue ECM.
- Porosity: Allows nutrient/waste diffusion and 3D cell migration/invasion.
- Tunability: Mechanical stiffness (elastic modulus) and biochemical composition can be precisely controlled.
Primary Classes & Gelation Protocols:
A. Natural Hydrogels:
- Collagen I: Most common mammalian ECM protein.
- Protocol: Mix neutralized collagen solution (e.g., 3-5 mg/mL, pH 7) with cell suspension on ice. Pipette into microfluidic device chamber. Incubate at 37°C for 20-45 minutes to trigger fibrillogenesis and gelation.
- Matrigel: Basement membrane extract.
- Protocol: Thaw on ice, dilute with cold medium, mix with cells. Load into device and incubate at 37°C. Gelation occurs rapidly (~30 min) above 15°C.
B. Synthetic Hydrogels:
- Poly(ethylene glycol) (PEG)-based: Bio-inert, highly tunable.
- Protocol: Use PEG precursors functionalized with reactive groups (e.g., acrylates, norbornenes). Mix with cells, crosslinker (e.g., dithiothreitol for thiol-ene), and photoinitiator (e.g., LAP). Introduce into device and expose to UV light (365-405 nm, 5-20 mW/cm² for 10-60 sec) for covalent photocrosslinking.
Table 3: Hydrogel Properties for 3D Culture
| Hydrogel Type | Typical Stiffness Range | Gelation Trigger | Key Feature for Microfluidics |
|---|---|---|---|
| Collagen I | 0.1 - 10 kPa | Temperature, pH | Native ligand presentation; can contract over time. |
| Matrigel | ~0.5 kPa | Temperature | Contains complex growth factors; batch variability. |
| Fibrin | 0.1 - 50 kPa | Enzymatic (thrombin) | Excellent for angiogenesis and wound healing models. |
| PEG-based | 0.1 - 100 kPa | Light (photocrosslinking) | Precise spatiotemporal control over gelation and properties. |
| Alginate | 1 - 100 kPa | Divalent Ions (Ca²⁺) | Gentle ionic crosslinking; often modified with RGD peptides. |
Integration in Microfluidic 3D Cell Culture: A Workflow
The integration of these materials enables sophisticated organ-on-a-chip and tumor spheroid models.
Workflow for 3D Microfluidic Culture Fabrication
Key Signaling Pathways in a 3D Mechanotransduction Context
The material stiffness (hydrogel/PDMS) directly influences cell fate through mechanosensing.
YAP/TAZ Mechanotransduction from Matrix Stiffness
The Scientist's Toolkit: Research Reagent Solutions
Table 4: Essential Materials for 3D Microfluidic Culture Fabrication
| Item | Function/Description | Example Vendor/Product |
|---|---|---|
| PDMS Kit | Two-part elastomer for device fabrication. | Dow, Sylgard 184 Elastomer Kit |
| SU-8 Photoresist | Negative photoresist for creating mold masters. | Kayaku Advanced Materials, SU-8 2000/3000 series |
| Silicon Wafers | Substrate for photolithography master. | UniversityWafer, <100>, 4" diameter |
| Oxygen Plasma System | For PDMS-PDMS or PDMS-glass bonding. | Henniker Plasma, HPT series; or Harrick Plasma |
| Cyclic Olefin Copolymer (COC) Sheets | Rigid, optically clear thermoplastic for devices. | TOPAS Advanced Polymers, TOPAS 8007 |
| Type I Collagen, Rat Tail | Gold standard natural hydrogel for 3D culture. | Corning, Rat Tail Collagen I, High Concentration |
| Matrigel Basement Membrane Matrix | Reconstituted basement membrane hydrogel. | Corning, Matrigel Growth Factor Reduced |
| PEG-diacrylate (PEGDA) | Synthetic hydrogel precursor for photocrosslinking. | Sigma-Aldrich, PEGDA Mn 700 |
| Photoinitiator (LAP) | Lithium phenyl-2,4,6-trimethylbenzoylphosphinate for UV crosslinking. | Toronto Research Chemicals, LAP |
| Plasma Cleaner Compatible Glass Slides | Device substrate for bonding. | Fisher Scientific, Plain Microslides |
| Biocompatible Syringe Tubing | For connecting perfusion pumps to devices. | Cole-Parmer, PharMed BPT Tubing |
| Portable Punch Tool | For creating inlet/outlet ports in PDMS. | Syneo, Uni-Core punch set |
| Reversible Sealing Tape | For securing devices to slides/dish during testing. | Grace Bio-Labs, SecureSeal hybridization chambers |
Current Trends and Drivers in the Field (2024-2025)
This whitepaper delineates the principal trends and technological drivers shaping 3D cell culture within microfluidic devices, contextualized within the foundational thesis that these systems are indispensable for recapitulating in vivo physiology. The convergence of advanced biomaterials, integrative sensing, and artificial intelligence is transitioning the field from proof-of-concept models toward robust, standardized platforms for predictive drug development and disease modeling.
Dominant Technical Trends
Multi-Material and Dynamic Hydrogels
The shift from passive scaffolds (e.g., Matrigel, collagen) to engineered, stimuli-responsive hydrogels is paramount. These materials enable spatiotemporal control over biochemical and biophysical cues.
Table 1: Engineered Hydrogel Properties (2024-2025)
| Hydrogel Material | Key Modifiable Property | Typical Shear Modulus Range | Responsive Trigger | Primary Application |
|---|---|---|---|---|
| Peptide-PEG Hybrids | Ligand Density, Stiffness | 0.5 - 5 kPa | Enzymatic Degradation | Metastasis & Invasion Studies |
| Alginate-Based (RGD-modified) | Stiffness (via Ca²⁺) | 0.2 - 20 kPa | Ionic Crosslinking | Mechanotransduction Studies |
| Gelatin Methacryloyl (GelMA) | Stiffness (via UV crosslink) | 0.1 - 30 kPa | Light (λ 365-405 nm) | Vascularized Tissue Models |
| Hyaluronic Acid-Methacrylate | Degradation Rate, Stiffness | 0.5 - 15 kPa | Hyaluronidase / Light | Tumor Microenvironment |
Integration of Real-Time, Multi-Modal Sensing
Microfluidic devices are evolving into self-contained analytical platforms. The trend is toward non-destructive, continuous monitoring within the culture environment.
Table 2: Integrated Sensing Modalities in Microfluidic 3D Culture
| Sensing Modality | Measured Analytic | Limit of Detection (Typical) | Temporal Resolution | Readout Method |
|---|---|---|---|---|
| Embedded Electrochemical | Glucose, Lactate | 10-100 µM | Continuous (sec-min) | Amperometry |
| Oxygen-Sensitive Phosphorescence | pO₂ | 0.1 mmHg | ~30 seconds | Luminescence Lifetime Imaging |
| Impedance Spectroscopy | Barrier Integrity (TEER) | 1-5 Ω·cm² | Minutes | Real-time EIS |
| Aptamer-Functionalized FETs | Specific Cytokines (e.g., TNF-α) | pM-nM range | Minutes | Transistor Current Shift |
AI-Driven Design and Analysis
Machine learning (ML) is applied to two key areas: a) optimizing device geometry and flow parameters, and b) analyzing complex, high-content imaging data from 3D cultures.
Protocol 1: ML-Optimized Perfusion Culture Protocol
- Seed cells in GelMA hydrogel within a commercially available or 3D-printed microfluidic chip (e.g., AIM Biotech, Emulate, or custom PDMS device).
- Perfuse with culture medium at an initial flow rate (e.g., 1 µL/min).
- Monitor viability (via live/dead stain) and morphology (phase-contrast/confocal) at 24h intervals for 72h.
- Feed imaging data (cell cluster size, circularity, aspect ratio) and flow parameters (shear stress, nutrient gradient) into a convolutional neural network (CNN) regression model (e.g., U-Net architecture).
- Utilize the trained model to predict the optimal flow rate profile for maximizing viability and function. Validate the predicted protocol experimentally.
Core Experimental Protocols
Protocol for Establishing a Vascularized Tumor Spheroid Model
This protocol details the creation of a co-culture model to study tumor-endothelial interactions.
Materials & Reagents:
- PDMS microfluidic device with three parallel channels (central gel channel, two side perfusion channels).
- Human umbilical vein endothelial cells (HUVECs).
- Patient-derived glioblastoma (GBM) cells.
- Fibrinogen (10 mg/mL), Thrombin (5 U/mL), aprotinin (to inhibit fibrinolysis).
- Endothelial Growth Medium (EGM-2) and tumor culture medium.
- Critical Step: Pre-coat perfusion channels with 50 µg/mL fibronectin for 1 hour at 37°C to enhance endothelial adhesion.
Methodology:
- Spheroid Formation: Generate GBM spheroids using a 96-well ultra-low attachment plate (500 cells/spheroid, 72h).
- Gel Preparation: Mix spheroids with fibrinogen solution (final 5 mg/mL) and aprotinin (50 µg/mL). Keep on ice.
- Device Loading: Inject the spheroid-fibrinogen mixture into the central gel channel.
- Polymerization: Immediately inject thrombin solution (2 U/mL final) into the gel channel to initiate fibrin polymerization. Incubate at 37°C for 15 min.
- Endothelial Seeding: Introduce HUVECs (2x10^6 cells/mL) into the two side channels. Allow adhesion for 4h under static conditions.
- Perfusion Culture: Connect the side channels to a syringe pump. Perfuse EGM-2 medium through one side channel at 10 µL/hour, creating a chemokine gradient. Culture for 5-7 days, imaging sprouting every 24h.
Protocol for On-Chip Multiplexed Cytokine Secretion Analysis
A methodology for spatially resolved secretion profiling from different regions of a 3D culture.
- Functionalization: Pattern antibody "capture" spots for IL-6, VEGF, and MMP-9 on a glass slide integrated into the microfluidic device base.
- Culture & Stimulation: Culture pancreatic cancer spheroids in a collagen I matrix in the main chamber. Stimulate with 10 ng/mL TGF-β for 48h under perfusion.
- Secretome Collection: Direct a fraction of the perfusate (5%) over the antibody array for 1h.
- Detection: Wash and incubate with a cocktail of fluorescently labeled detection antibodies.
- Quantification: Image using a microarray scanner. Quantify spot intensity against a standard curve run in parallel on the same chip.
Visualization of Key Concepts
(Diagram 1: Closed-loop AI-driven model optimization)
(Diagram 2: Vascularized spheroid model workflow)
The Scientist's Toolkit: Essential Research Reagents & Materials
Table 3: Key Reagent Solutions for Advanced 3D Microfluidic Culture
| Item | Function & Rationale | Example Vendor/Catalog |
|---|---|---|
| Tunable Hydrogel Kits | Provide reproducible, defined matrices with modifiable stiffness and adhesive ligand density. Essential for mechanobiology studies. | Cellendes 3-Life, BioLamina LN-based, Advanced BioMatrix HyStem |
| Oxygen-Responsive Nanoparticles | Enable real-time, non-destructive mapping of oxygen gradients within 3D cultures, critical for modeling hypoxia. | PreSens Sensor Particles, Luxcel MitoXpress probes |
| Organ-on-Chip Certified ECMs | Batch-tested extracellular matrix formulations optimized for specific organotypic models (e.g., liver, kidney, blood-brain barrier). | Corning Matrigel OOC-QC, Cultrex BME OOC-QC |
| Multiplexed Secretion Assay On-Chip Kits | Integrated, low-volume immunoassays for simultaneous measurement of up to 10 analytes from microfluidic effluent. | IsoPlexis Single-Cell Secretion, MSD U-PLEX Assays (adapted) |
| Photoinitiator (e.g., LAP) | A biocompatible lithium acylphosphinate photoinitiator for rapid, cytocompatible UV crosslinking of GelMA and other photopolymers. | Sigma-Aldrich 900889, TCI L0290 |
| Fluorescent Nanobeacons | FRET-based aptamer sensors for live-cell imaging of intracellular metabolites (e.g., ATP, cAMP) in 3D micro-environments. | AptaFluor series, proprietary designs from recent literature. |
The field is being driven by a synthesis of precision biomaterial engineering, seamless multi-omics integration, and data-driven iterative design. The overarching goal is the development of standardized, validated, and highly predictive human-relevant systems that will redefine preclinical research in drug discovery and precision medicine. Future progress hinges on interdisciplinary collaboration between biologists, engineers, and data scientists.
Step-by-Step Protocols and Cutting-Edge Applications in Research & Drug Development
The advancement of physiologically relevant in vitro models, particularly three-dimensional (3D) cell cultures (e.g., spheroids, organoids) within microfluidic devices ("organs-on-chips"), is fundamentally constrained by the available fabrication techniques. The choice between established methods like Soft Lithography and emerging Rapid Prototyping technologies dictates the device's feature resolution, material biocompatibility, prototyping speed, and ultimately, its suitability for complex 3D co-culture and perfusion experiments. This guide provides a technical comparison, detailing protocols and considerations for researchers engineering the next generation of 3D cell culture platforms.
Technical Deep Dive: Soft Lithography
Soft Lithography is a suite of techniques centered on replica molding of elastomers, primarily poly(dimethylsiloxane) (PDMS). Its dominance in academic microfluidics stems from its material properties ideal for cell culture.
Core Experimental Protocol: Standard PDMS Device Fabrication via SU-8 Molding
- Master Fabrication (Silicon Wafer Mold):
- Spin Coating: Clean a silicon wafer. Dehydrate at 150°C for 5 min. Dispense SU-8 photoresist and spin-coat to achieve a target thickness (e.g., 100 µm for channel height).
- Soft Bake: Heat wafer on a hotplate using a graded ramping protocol to evaporate solvent (e.g., 65°C for 3 min, 95°C for 7 min).
- UV Exposure & Post-Exposure Bake: Expose the wafer to UV light through a high-resolution photomask (chrome/quartz or high-quality film) defining the channel network. Perform a post-exposure bake (e.g., 65°C for 1 min, 95°C for 4 min) to crosslink exposed regions.
- Development: Immerse the wafer in SU-8 developer (e.g., propylene glycol monomethyl ether acetate, PGMEA) with gentle agitation to dissolve unexposed resist, revealing the relief mold. Rinse with fresh developer and isopropanol.
- Hard Bake & Silanization: Harden the master at 150°C for 15 min. Vapor-phase silanize with (tridecafluoro-1,1,2,2-tetrahydrooctyl)trichlorosilane for 1 hour in a desiccator to create an anti-adhesion layer.
- PDMS Replica Molding & Device Assembly:
- Mixing & Degassing: Mix PDMS base and curing agent (typically 10:1 w/w ratio). Degas under vacuum until all bubbles are removed.
- Curing: Pour over the SU-8 master. Cure in an oven at 65°C for 2-4 hours.
- Peeling & Punching: Peel the cured PDMS slab from the master. Use biopsy punches to create inlet/outlet ports.
- Bonding: Clean PDMS and a glass slide (or another PDMS slab) with oxygen plasma (e.g., 30-50 W, 30-45 sec). Immediately bring surfaces into conformal contact, forming an irreversible seal.
Technical Deep Dive: Rapid Prototyping
Rapid Prototyping (additive manufacturing) for microfluidics includes techniques like Stereolithography (SLA), Digital Light Processing (DLP), and Two-Photon Polymerization (2PP). These methods build devices layer-by-layer directly from CAD models.
Core Experimental Protocol: Microfluidic Device Fabrication via DLP 3D Printing
- Resin Preparation & CAD Design:
- Select a biocompatible, water-resistant photopolymer resin. For cell culture, use resins certified for ISO 10993 Biocompatibility (Class VI). If needed, add a bioactive dye (e.g., Sudan I) to enhance resolution.
- Design the complete device (channels, ports, chambers) in CAD software. Include any support structures. Orient the model to minimize layer-staircase effect on critical features. Slice the model into 2D layers (e.g., 10-50 µm thickness) using printer software.
- Printing & Post-Processing:
- Printing: The build platform lowers into the resin vat. A digital light projector flashes the image of the first layer, curing it onto the platform. The platform lifts, and the process repeats for each layer. For enclosed channels, print a temporary open side for resin drainage.
- Post-Processing: After printing, immerse the device in a solvent bath (e.g., isopropanol) in an ultrasonic cleaner for 5-10 minutes to remove uncured resin. Agitate thoroughly.
- Post-Curing: Expose the cleaned device to broad-spectrum UV light in a post-curing chamber for 20-30 minutes to ensure complete polymerization and improve mechanical stability.
- Bonding (for multi-part devices): For sealing printed layers or bonding to glass, use oxygen plasma treatment followed by application of a thin layer of uncured resin as an adhesive and a final UV cure.
Quantitative Comparison & Selection Guide
Table 1: Direct Comparison of Key Fabrication Parameters
| Parameter | Soft Lithography (PDMS) | Rapid Prototyping (DLP/SLA) | Implications for 3D Cell Culture |
|---|---|---|---|
| Typical Feature Resolution | 1 µm – 100 µm | 25 µm – 150 µm | SL superior for small capillaries, RP sufficient for most organoid chambers. |
| Prototyping Speed | 24 – 48 hours (including master) | 1 – 4 hours (direct print) | RP enables faster design iteration, crucial for optimizing culture conditions. |
| Material (Key Property) | PDMS (Elastomeric, Gas-Permeable, Absorbs small hydrophobic molecules) | Acrylate/Epoxy Resins (Rigid, Variety, Some Biocompatible Options) | PDMS gas-permeability ideal for oxygenation; RP material absorption negligible. |
| Surface Chemistry | Hydrophobic, readily modified | Varies, often less modifiable than PDMS | PDMS allows easy extracellular matrix (ECM) coating for cell adhesion. |
| Cost per Device (Low Volume) | Low ($2-$10) | Medium ($5-$50) | SL cheaper per chip after master; RP has no master cost. |
| 3D Complexity | Low (2.5D layers, requires complex assembly) | High (True 3D, monolithic) | RP uniquely enables integrated 3D perfusion networks around cell-laden hydrogels. |
| Throughput & Scalability | Medium (batch molding) | Low-Medium (serial printing) | SL better for producing many identical devices; RP for bespoke designs. |
Table 2: Suitability for 3D Cell Culture Applications
| Application / Requirement | Recommended Technique | Rationale |
|---|---|---|
| High-Resolution Barrier Models (e.g., BBB, Gut Epithelium) | Soft Lithography | Superior resolution for micron-scale membranes and channels. |
| Organ-on-a-Chip with Mechanical Actuation (e.g., cyclic stretch) | Soft Lithography | PDMS elasticity is essential for applying mechanical stimuli. |
| Rapid Design of Complex 3D Perfusion Scaffolds | Rapid Prototyping | Direct printing of convoluted vasculature-like networks. |
| High-Throughput Drug Screening Array | Soft Lithography | Lower cost per device and batch production capability. |
| Integrated Sensors/Electrodes | Rapid Prototyping (Hybrid) | Ability to embed components during the print process. |
| Minimizing Small Molecule Absorption | Rapid Prototyping | Use of non-absorbing resins prevents drug/cytokine loss. |
The Scientist's Toolkit: Essential Reagents & Materials
Table 3: Key Research Reagent Solutions for Fabrication & Culture
| Item | Function in Fabrication/Experiments | Example/Note |
|---|---|---|
| PDMS (Sylgard 184) | Elastomer for soft lithography; gas-permeable device body. | Mix ratio (10:1) can be adjusted for stiffness. |
| SU-8 Photoresist | Negative-tone epoxy for creating high-aspect-ratio master molds. | SU-8 2050 or 2100 for typical channel heights (50-250 µm). |
| Biocompatible Photoresin | Material for rapid prototyping cell culture devices. | MUST be certified (e.g., MED610, Biomodeler). |
| (Tridecafluoro-1,1,2,2-tetrahydrooctyl)trichlorosilane | Vapor-phase deposition on masters to prevent PDMS adhesion. | Handle in fume hood. Creates a fluorinated release layer. |
| Oxygen Plasma Cleaner | Activates PDMS/glass/resin surfaces for irreversible bonding. | Also used for surface hydrophilization before cell seeding. |
| Poly-L-lysine or Fibronectin | ECM-coating solutions to promote cell adhesion to device surfaces. | Crucial for anchoring 2D monolayers or 3D hydrogel matrices. |
| Basement Membrane Extract (e.g., Matrigel) | Temperature-sensitive hydrogel for embedding organoids or creating 3D cell cultures within channels. | Keep on ice during device loading. |
| Tubing & Connectors (e.g., Tygon, PEEK) | Interface between the microfluidic chip and external pumps/syringes for perfusion. | Ensure biocompatibility and secure, leak-free connections. |
Designing Perfusion Systems for Continuous Nutrient and Waste Exchange
The advancement from static 3D cell cultures (e.g., spheroids, organoids) to dynamic, perfused microphysiological systems is a cornerstone of modern microfluidic device research. This evolution addresses the critical limitation of diffusion, which inadequately supplies nutrients and removes wastes in thick, metabolically active 3D constructs. This technical guide details the design of microfluidic perfusion systems that enable continuous, convective mass transfer, thereby maintaining physiological gradients and long-term culture viability—essential for predictive drug development and disease modeling.
Core Principles of Perfusion Design
Effective perfusion systems are engineered to mimic the vascular niche. Key design parameters include:
- Shear Stress: Calculated for microchannels to remain within physiological ranges (typically 0.1 - 5 dyn/cm² for many tissues).
- Residence Time: The time medium spends in the culture chamber, dictating nutrient uptake and waste accumulation.
- Flow Uniformity: Ensuring consistent perfusion throughout the 3D construct, often achieved through engineered geometries like micropillars or porous membranes.
Key Quantitative Parameters in System Design
The following table summarizes critical quantitative parameters for designing and operating a perfusion system for 3D cell culture.
Table 1: Key Quantitative Design and Operational Parameters
| Parameter | Typical Range / Value | Impact on Culture | Measurement Method |
|---|---|---|---|
| Volumetric Flow Rate (Q) | 0.1 - 100 µL/h | Determinates nutrient delivery and shear stress. | Syringe pump calibration, flow sensor. |
| Shear Stress (τ) | 0.1 - 5.0 dyn/cm² | Influences cell morphology, differentiation, and viability. | Computational fluid dynamics (CFD) or calculation from Q. |
| Channel Height/Width | 50 - 500 µm | Defines fluidic resistance and spatial constraints for 3D constructs. | Microscopy, profilometry. |
| Oxygen Partial Pressure (pO₂) | 1 - 10% (within construct) | Critical for cell metabolism and phenotype. | Fluorescent oxygen sensors (e.g., Ruthenium-based). |
| Medium Residence Time | 1 minute - 1 hour | Directly linked to metabolite concentration and waste accumulation. | Chamber volume / Flow rate (Q). |
| Diffusion Time (across 200 µm) | ~8 minutes (for glucose) | Highlights the necessity of perfusion for large constructs. | Calculation via Fick's law. |
| System Volumetric Throughput | 2.4 - 2400 µL/day | Informs medium reservoir sizing and experiment duration. | 24 * Flow Rate (Q). |
Experimental Protocol: Establishing a Perfused 3D Culture
This protocol details the setup and operation of a standard polydimethylsiloxane (PDMS)-glass microfluidic device for 3D hydrogel culture under perfusion.
A. Device Priming and Hydrogel Loading
- Sterilization: Autoclave the assembled PDMS device or sterilize with 70% ethanol for 30 minutes, followed by UV exposure for 15 minutes per side.
- Channel Priming: Connect outlet tubing to a waste reservoir. Using a syringe pump, perfuse the device with 1x phosphate-buffered saline (PBS) for 10 minutes at 50 µL/min to wet all channels and remove bubbles.
- Hydrogel Cell Suspension: Trypsinize and count cells. Mix with liquid, ice-cold extracellular matrix (ECM) hydrogel (e.g., Matrigel or collagen I) at a density of 5-10 million cells/mL. Keep on ice.
- Loading: Stop flow. Inject the cell-hydrogel mix into the main culture chamber via a dedicated loading port using a pipette. Avoid introducing bubbles.
- Gelation: Place the entire device in a humidified 37°C, 5% CO₂ incubator for 20-30 minutes to allow complete hydrogel polymerization.
- Medium Connection: Connect the inlet tubing to a sterile medium reservoir (e.g., a syringe on the pump). Initiate slow perfusion at 0.5-2 µL/h for 4-6 hours to allow cell acclimation, then increase to the desired operational flow rate.
B. Long-Term Maintenance and Monitoring
- Medium Exchange: Replace the medium in the inlet reservoir every 48-72 hours, maintaining sterility.
- On-Chip Viability Assay: Perfuse with 2 µM calcein AM and 4 µM ethidium homodimer-1 in PBS for 30 minutes at 37°C. Image using fluorescence microscopy.
- Effluent Analysis: Collect outflow medium in a microplate for periodic off-line analysis of glucose consumption, lactate production, or secreted biomarkers.
Visualization of Perfusion System Workflow
The Scientist's Toolkit: Essential Research Reagent Solutions
Table 2: Key Reagents and Materials for Perfused 3D Culture
| Item | Function in Perfusion System | Key Consideration |
|---|---|---|
| PDMS (Sylgard 184) | Device fabrication via soft lithography; gas-permeable, optically clear. | Mixing ratio (10:1 base:curing agent) affects stiffness. Sterilize post-curing. |
| Matrigel / Collagen I | Hydrogel scaffold providing 3D ECM for cell encapsulation and growth. | Lot variability (Matrigel). Polymerization temperature and time are critical. |
| Serum-Free Medium | Provides defined nutrients and growth factors; reduces bubble formation. | Optimize for specific cell type. Supplement with growth factors as needed. |
| Tubing (e.g., Tygon) | Connects reservoirs, pumps, and device for sterile fluid transport. | Ensure biocompatibility and low gas permeability. Secure with blunt needles. |
| Syringe Pump | Provides precise, continuous flow for controlled perfusion. | Use programmable models for complex flow profiles (e.g., pulsatile). |
| Fluorescent Viability Dyes (Calcein AM/EthD-1) | On-chip, live/dead staining for non-destructive health assessment. | Perfuse dyes directly; ensure compatibility with perfusion medium. |
| Oxygen-Sensitive Nanoparticles | Real-time, spatial mapping of oxygen gradients within the 3D construct. | Incorporate into hydrogel during mixing. Requires specialized imaging. |
| Anti-Evaporation Agent (e.g., 1% PEG) | Added to medium reservoirs to minimize evaporation in long-term cultures. | Use low concentration to avoid altering medium viscosity or osmolarity. |
The integration of three-dimensional (3D) cell culture models into microfluidic platforms represents a paradigm shift in biomedical research, moving beyond traditional two-dimensional (2D) monolayers. This foundational thesis posits that 3D microfluidic systems uniquely recapitulate the dynamic cell-cell and cell-matrix interactions, nutrient gradients, and physiological shear forces of in vivo tissues. Within this framework, high-throughput compound screening and toxicity testing emerge as flagship applications. These platforms enable the parallelized, miniaturized analysis of drug candidates on biologically relevant tissue models—from spheroids and organoids to tissue-engineered constructs—delivering human-relevant data with enhanced predictive power and reduced reliance on animal models.
Core Advantages of 3D Microfluidic Systems for Screening
The transition to 3D microfluidic models for screening is driven by quantifiable improvements in biological relevance and assay performance.
Table 1: Comparative Performance Metrics: 2D vs. 3D Microfluidic Culture in Drug Screening
| Metric | Traditional 2D Culture | 3D Microfluidic Culture | Data Source & Notes |
|---|---|---|---|
| Gene Expression Correlation to In Vivo | Low (10-20%) | High (70-80%) | RNA-seq analyses show 3D models better mimic tissue-specific profiles. |
| EC50 Discrepancy (vs. in vivo) | Often 10-1000 fold | Typically 1-10 fold | For chemotherapeutics like Doxorubicin; due to diffusion barriers in 3D. |
| Throughput (Assays per week) | Very High (10^4-10^5) | Moderate-High (10^2-10^3) | Modern microfluidic plates (e.g., 96-384 chip formats) bridge the gap. |
| Compound Consumption | High (μL-mL range) | Very Low (nL-pL range) | Microfluidic perfusion drastically reduces reagent volumes. |
| Functional Assay Integration | Low (mostly endpoint) | High (real-time imaging, secretion) | Continuous monitoring of biomarkers, oxygen, pH, and metabolites. |
| Cell Viability Assay Z'-factor | Typically >0.5 | Can be >0.4-0.5 | Requires optimized fluidic control to minimize variability. |
Detailed Experimental Protocols
Protocol 3.1: Fabrication of a High-Throughput Spheroid Screening Array
Objective: Create a PDMS-based microfluidic device for forming and culturing 300+ spheroids in a standardized array for parallel compound exposure.
Materials: SU-8 master mold, PDMS (Sylgard 184), plasma oxidizer, inlet/outlet punches, glass slides, tubing, syringe pumps.
Method:
- Master Mold Patterning: Use standard photolithography to create an SU-8 mold featuring an array of 400μm diameter x 300μm deep micro-wells, each fed by a dedicated perfusion channel.
- PDMS Replication & Bonding: Mix PDMS base:curing agent (10:1), degas, pour onto mold, and cure at 65°C for 4 hours. Peel off, punch inlets/outlets, and bond to a glass slide via oxygen plasma treatment.
- Priming and Cell Loading: Sterilize with 70% ethanol, rinse with PBS, and prime with 0.1% BSA in media. Introduce a single-cell suspension (e.g., HepG2 at 5x10^6 cells/mL) via a low-flow-rate pump (2 μL/min). Cells settle by gravity into wells.
- Spheroid Formation: Place chip in incubator (37°C, 5% CO2) on a static platform for 72h. Media perfusion (0.5 μL/min per channel) begins after 24h to nourish formed spheroids.
Protocol 3.2: High-Throughput Toxicity Screening Workflow
Objective: Perform a dose-response toxicity screen on mature spheroids with real-time viability readouts.
Materials: 3D spheroid array chip, automated syringe pump system, test compounds in DMSO, CellTox Green Cytotoxicity Assay dye, live-cell imaging system.
Method:
- Spheroid Maturation: Culture spheroids under perfusion for 5-7 days until compact and diameter stabilizes (~300μm).
- Compound Library Preparation: Serially dilute compounds in complete media. Final DMSO concentration must be ≤0.1% in all channels. Include vehicle (0.1% DMSO) and positive control (1% Triton X-100) channels.
- Automated Dosing: Use a multiplexed syringe pump to simultaneously switch the perfusion medium from growth media to compound-containing media for designated channel sets. Perfuse for 48-72 hours.
- Real-Time Viability Monitoring: At T=0, 24, 48, 72h, introduce CellTox Green dye (1:1000 dilution in perfusion media) for 3 hours. Image using an automated microscope with GFP filter. Dye penetrates compromised membranes, fluorescing upon DNA binding.
- Endpoint Analysis: At 72h, switch to media containing Hoechst 33342 (nuclear stain) and propidium iodide (PI) for final viability count. Quantify spheroid area, circularity, and fluorescence intensity (CellTox Green, PI) using ImageJ or commercial analysis software.
Visualization of Workflows and Pathways
Diagram 1: High-Throughput 3D Screening Experimental Workflow
Diagram 2: Key Toxicity Pathways in a 3D Hepatic Model
The Scientist's Toolkit: Essential Research Reagent Solutions
Table 2: Key Reagents and Materials for 3D Microfluidic Screening
| Item | Function & Rationale | Example Product/Catalog |
|---|---|---|
| ECM Hydrogels | Provides a 3D scaffold mimicking the in vivo extracellular matrix. Critical for organoid growth and cell differentiation. | Matrigel (Corning), Cultrex BME, Collagen I, Synthetic PEG-based hydrogels. |
| Specialized 3D Media | Formulated to support the metabolic demands of dense 3D structures and maintain stemness or specific differentiation. | Organoid Growth Media (Stemcell Tech.), HepatiCult (for hepatocytes), specific cytokine/additive kits. |
| Live-Cell Viability Dyes | Non-lytic, fluorescent probes for real-time kinetic monitoring of cytotoxicity (membrane integrity) and apoptosis (caspase activity). | CellTox Green (Promega), Incucyte Cytolight Green (Sartorius), CellEvent Caspase-3/7. |
| Oxygen-Sensitive Probes | Reports on hypoxia within spheroid cores, a critical parameter influencing drug response and toxicity. | Image-iT Green Hypoxia Reagent (Thermo Fisher), Ru(dpp)3-based nanoparticles. |
| Microfluidic Chip Bonding Agent | Ensures a sterile, leak-proof seal between PDMS and glass/plastic. Plasma treatment is standard; alternatives exist for mass production. | Oxygen Plasma, Silicone Adhesive (e.g., RTV 118), Glass/PDMS bonding kits. |
| High-Content Analysis Software | Automated image analysis tools capable of segmenting 3D objects, quantifying morphology, and multiplexed fluorescence in z-stacks. | Harmony (PerkinElmer), HCA-Vision (Thermo), open-source (CellProfiler 3D). |
The shift from traditional 2D cell culture to three-dimensional (3D) models in microfluidic devices represents a foundational thesis in modern cancer research. This paradigm recognizes that the tumor microenvironment (TME)—a complex milieu of cancer cells, stromal cells, extracellular matrix (ECM), and biochemical gradients—drives tumor progression and metastasis. Microfluidic platforms enable precise spatial and temporal control over these elements, creating physiologically relevant models to dissect metastatic mechanisms and test therapeutic interventions.
Core Components of the TME-on-a-Chip
A biomimetic TME model requires the integration of several key elements, recapitulating the hallmarks of the metastatic cascade.
Table 1: Essential Components of a Metastasis-Capable TME Chip
| Component | Description & Function | Common Implementation in Microfluidics |
|---|---|---|
| 3D Extracellular Matrix (ECM) | Provides structural and biochemical support; influences cell migration. | Collagen I, Matrigel, or fibrin gels in a central chamber. |
| Vascular/Endothelial Compartment | Models vessel walls for intra- and extravasation studies. | A parallel channel lined with endothelial cells (HUVECs). |
| Multicellularity | Incorporates stromal players critical to the TME. | Cancer-associated fibroblasts (CAFs), immune cells, pericytes. |
| Dynamic Perfusion | Mimics interstitial flow and shear stress; delivers nutrients/gradients. | Controlled flow via syringe or peristaltic pumps. |
| Spatial Compartmentalization | Separates primary tumor, metastatic target, and circulation. | Adjacent microchambers connected by constriction channels. |
Key Experimental Protocols
Protocol: Establishing a 3D Invasion Assay
Objective: To model local invasion of tumor cells into the surrounding stroma.
- Chip Priming: Fill all channels of a PDMS-based microfluidic device with 1X PBS. Coat the side channels with 0.1 mg/ml poly-D-lysine for 1 hour.
- ECM Gel Loading: Prepare a chilled solution of collagen I (e.g., 2.5 mg/ml) with cells (e.g., CAFs or normal fibroblasts). Inject into the central matrix chamber. Incubate at 37°C for 30 min for polymerization.
- Cell Seeding: Seed fluorescently labeled tumor cells (e.g., MDA-MB-231 for breast cancer) into one of the side channels, allowing them to adhere to the gel interface.
- Culture & Perfusion: Connect the device to a perfusion system. Use culture medium with 1% FBS in the tumor cell channel and 10% FBS in the opposite channel to create a chemotactic gradient.
- Imaging & Analysis: Acquire time-lapse confocal microscopy images every 6 hours for 72 hours. Quantify invasion distance and number of invasive cells using image analysis software (e.g., Fiji/ImageJ).
Protocol: Circulating Tumor Cell (CTC) Extravasation Model
Objective: To study the exit of tumor cells from a simulated vasculature into a metastatic niche.
- Vessel Lining: Seed human umbilical vein endothelial cells (HUVECs) into a straight microchannel at high density (5x10^6 cells/ml). Allow them to form a confluent, lumen-like monolayer over 24-48 hours.
- Metastatic Niche Preparation: Load a collagen/Matrigel mix containing primary lung fibroblasts into an adjacent compartment.
- CTC Introduction: Trypsinize and resuspend fluorescent tumor cells in serum-free medium. Introduce them into the endothelial channel at a low flow rate (0.5 µl/min) for 2 hours.
- Extravasation Phase: Stop flow for 12 hours to allow adhesion and transmigration.
- Analysis: Fix, stain for endothelial markers (CD31) and actin, and image via confocal microscopy. Quantify the percentage of tumor cells that have fully transmigrated through the endothelium and into the matrix.
Signaling Pathways in the Metastatic Niche
Microfluidic models have elucidated key pathways activated during metastasis within the TME.
Diagram Title: Key Signaling Pathways in the Metastatic Cascade
Experimental Workflow for TME-Metastasis Studies
Diagram Title: TME-on-Chip Experimental Workflow
The Scientist's Toolkit: Key Research Reagent Solutions
Table 2: Essential Materials for TME Microfluidic Modeling
| Item | Function/Application | Example Product/Note |
|---|---|---|
| PDMS (Sylgard 184) | Device fabrication; optically clear, gas-permeable elastomer. | Dow Corning. Standard 10:1 base:curing agent ratio. |
| Collagen I, High Concentration | Major component of the ECM; forms tunable 3D hydrogels. | Rat tail collagen I, 8-10 mg/ml stock (Corning). |
| Growth Factor-Reduced Matrigel | Basement membrane extract; provides complex biochemical cues. | Corning Matrigel. Keep on ice during handling. |
| Microfluidic Perfusion Pumps | Generate precise, low-flow rate gradients and shear stress. | Elveflow OB1 or syringe pumps (Harvard Apparatus). |
| Live-Cell Imaging Dyes | Label different cell types for tracking (nuclei, cytoplasm, membrane). | CellTracker (Thermo Fisher), Hoechst 33342. |
| Cytokine/Growth Factor Cocktails | Mimic TME signaling (e.g., TGF-β for EMT, VEGF for angiogenesis). | Recombinant human proteins (PeproTech, R&D Systems). |
| Anti-Invasion/Therapeutic Compounds | Positive/Negative controls for drug testing (e.g., MMP inhibitor). | GM6001 (MMP inhibitor), Paclitaxel (cytotoxic). |
| Permeable Membrane Inserts (Optional) | For Transwell-integrated chips, to separate compartments. | PET membranes, 8 µm pores (for invasion studies). |
Quantitative Insights from Recent Studies (2023-2024)
Table 3: Summary of Key Quantitative Findings from Recent TME Chip Studies
| Study Focus (Model Type) | Key Metric & Result | Implication for Metastasis |
|---|---|---|
| CAF-Driven Invasion (Breast Cancer) | Invasion distance increased by 250% in co-culture vs. tumor cells alone. | Stromal CAFs are critical drivers of local invasion. |
| Shear Stress on CTCs (Lung Metastasis) | 0.5 dyn/cm² shear increased apoptosis by 40% in single CTCs vs. clusters. | Clustering confers survival advantage in circulation. |
| Chemotherapy Penetration (Pancreatic) | Gemcitabine reduced tumor cell viability by only 35% in dense 3D vs. 85% in 2D. | 3D TME models reveal significant drug penetration barriers. |
| Immune Cell Cytotoxicity (Melanoma) | Anti-PD-1 therapy increased T-cell mediated killing by 60% only in the presence of dendritic cells. | Chip models can dissect contributions of specific immune populations. |
The application of 3D microfluidic models to TME and metastasis studies provides an indispensable bridge between simplistic 2D cultures and complex, low-throughput animal models. By enabling the deconstruction of the metastatic cascade into spatially and temporally controlled events—from EMT and local invasion to intravasation and distant niche formation—these systems offer unparalleled mechanistic insight. The future lies in increasing complexity through patient-derived cells, integrating multi-omics readouts, and automating platforms for high-content therapeutic screening, ultimately accelerating the development of effective anti-metastatic therapies.
Within the thesis on the fundamentals of 3D cell culture in microfluidic devices, this guide details their transformative application in modeling host-pathogen interactions. By moving beyond traditional 2D monolayers, 3D microfluidic models—often termed "Organ-on-a-Chip" (OOC) systems—recapitulate the tissue-scale architecture, fluid shear stresses, and multicellular complexity that define in vivo infection and immune response. This technical whitpaper explores current methodologies, quantitative insights, and protocols central to this emerging paradigm.
Static 2D cultures fail to model the spatial dynamics of infection, such as epithelial barrier function, gradient-driven immune cell migration, and pathogen invasion through layered tissues. Microfluidic 3D culture integrates human-relevant cellular scaffolds (e.g., collagen, Matrigel) within precisely controlled microenvironments, enabling real-time analysis of infection kinetics, host response, and therapeutic intervention under physiologically relevant conditions.
Key Experimental Models & Quantitative Data
The following table summarizes prominent 3D microfluidic models used in recent infectious disease research.
Table 1: 3D Microfluidic Models for Host-Pathogen Research
| Pathogen/Disease | Host Tissue Model | Chip Design & 3D Matrix | Key Measured Outputs (Quantitative Data) | Reference Insights (Year) |
|---|---|---|---|---|
| Pseudomonas aeruginosa (Lung Infection) | Primary human airway epithelial cells, pulmonary endothelial cells | Two-channel "Lung-on-a-Chip" with porous membrane and collagen I ECM | Cilia beating frequency: Decreased from ~15 Hz to ~5 Hz post-infection.Neutrophil transmigration: Increased by 300% vs. static control.Bacterial load: 10-fold higher in 3D dynamic vs. 2D. | (2023) Barrier dysfunction and immune response kinetics were replicated. |
| Salmonella Typhi (Gut Infection) | Human intestinal epithelial cells (Caco-2), mucus-producing cells, endothelial cells | Multi-lumen chip with laminar flow and collagen-embedded crypt-villus geometry | Transepithelial Electrical Resistance (TEER): Dropped to 65% of baseline.Bacterial invasion: Enhanced 50x in flow model over Transwell.Cytokine IL-8 secretion: Peak of 450 pg/mL at 24h post-infection. | (2024) Model demonstrated physiologically relevant invasion and barrier loss. |
| Hepatitis B Virus (HBV) | Primary human hepatocytes, hepatic stellate cells, Kupffer-like macrophages | Perfused 3D bioreactor with spheroids in Matrigel | Viral titer: Maintained >10^7 IU/mL for >30 days.Cyp3A4 metabolic activity: Retained at 80% of in vivo levels.Fibrosis markers (α-SMA): Upregulated 4-fold in chronic model. | (2023) Enabled long-term modeling of chronic infection and drug testing. |
| Plasmodium falciparum (Malaria) | Human umbilical vein endothelial cells (HUVECs), red blood cells (RBCs) | Microvascular network chip seeded in fibrin gel | RBC sequestration: 40% of capillary areas occluded.Parasite cytoadherence: 22 infected RBCs/mm².Effective shear stress: 0.5 - 4 dyn/cm². | (2022) Quantified cytoadhesion dynamics under physiological flow. |
Detailed Experimental Protocol: Lung Infection Model
This protocol outlines the creation and infection of a representative alveolar-capillary barrier model.
Title: Establishing a 3D Microfluidic Alveolar Model for Bacterial Infection Studies
Materials:
- PDMS-based two-channel microfluidic device (commercial or fabricated).
- Primary human alveolar epithelial cells (e.g., hAELVi).
- Human pulmonary microvascular endothelial cells (HPMEC).
- Acid-soluble collagen I (rat tail), 5 mg/mL.
- Culture media (epithelial and endothelial specific).
- Pseudomonas aeruginosa strain (GFP-labeled).
- Fluorescent dextran (70 kDa, FITC-labeled) for barrier integrity.
- Live-cell imaging microscope with environmental control.
Procedure:
- Device Preparation: Sterilize the PDMS chip (70% ethanol, UV). Treat the central porous membrane (e.g., 10 µm pores) with O₂ plasma to facilitate matrix attachment.
- Epithelial Channel Seeding:
- Prepare a collagen I solution (2.5 mg/mL) in neutralization buffer on ice.
- Inject the solution into the top (epithelial) channel and incubate (37°C, 30 min) to gel.
- Seed alveolar epithelial cells at 2x10^6 cells/mL in the top channel. Culture under static conditions for 48h to form a confluent monolayer.
- Endothelial Channel Seeding:
- Seed HPMECs at 1.5x10^6 cells/mL in the bottom channel. Culture under a continuous flow of 30 µL/h (endothelial medium) for 24h.
- Air-Liquid Interface (ALI) Establishment:
- After epithelial confluence, drain the top channel medium, exposing the apical side to air. Continue perfusion of medium in the bottom channel (30 µL/h).
- Culture at ALI for 5-7 days to induce epithelial maturation (tight junctions, surfactant production).
- Infection & Assay:
- Pre-infection Integrity Check: Perfuse FITC-dextran through the endothelial channel. Measure apical fluorescence leakage over 60 min via time-lapse microscopy. Calculate apparent permeability (Papp).
- Infection: Introduce P. aeruginosa (MOI 10) suspended in PBS to the apical (air-exposed) surface.
- Real-time Analysis:
- Bacterial Adhesion/Invasion: Image GFP fluorescence hourly.
- Immune Recruitment: If applicable, perfuse fluorescently labeled human neutrophils through the endothelial channel and quantify transmigration.
- Cytokine Profiling: Collect effluent from the endothelial channel at 6h, 12h, 24h for multiplex ELISA (e.g., IL-1β, IL-6, IL-8).
- Barrier Function: Repeat FITC-dextran assay at 24h post-infection.
Visualizing Key Pathways and Workflows
Diagram Title: Experimental Workflow for a 3D Lung Infection Chip
Diagram Title: Core Host Innate Immune Signaling Upon Infection
The Scientist's Toolkit: Essential Research Reagents & Materials
Table 2: Key Reagent Solutions for 3D Microfluidic Host-Pathogen Studies
| Item | Function/Description | Example Product/Brand |
|---|---|---|
| Tunable Hydrogels | Provide a 3D extracellular matrix (ECM) scaffold for cell embedding and tissue morphogenesis. Stiffness and composition can be tailored. | Corning Matrigel (Basement Membrane), Rat Tail Collagen I, Fibrinogen. |
| Organ-on-a-Chip Devices | Microfabricated platforms (often PDMS) with microchannels and membranes to co-culture tissues under perfusion. | Emulate (Organ-Chips), MIMETAS (OrganoPlate), custom PDMS chips. |
| Primary Cell Co-Culture Systems | Human primary cells (epithelial, endothelial, immune) essential for physiologically relevant responses. | Lonza, PromoCell, ATCC primary cell lines. |
| Live-Cell Imaging Dyes | Fluorescent probes for viability, reactive oxygen species (ROS), calcium flux, and membrane integrity in real-time. | CellTracker dyes (Thermo Fisher), Calcein-AM/PI, H2DCFDA (for ROS). |
| Barrier Integrity Assay Kits | Quantify paracellular permeability, typically using fluorescent tracers (e.g., FITC-dextran) or TEER measurement systems. | EVOM3 with STX2 electrode (World Precision Instruments). |
| Cytokine/Chemokine Multiplex Panels | Profile multiple inflammatory mediators from small-volume chip effluent (µL scale). | LEGENDplex (BioLegend), V-PLEX (Meso Scale Discovery). |
| Programmable Perfusion Pumps | Generate precise, physiologically relevant flow rates (µL/h to mL/h) for continuous medium supply or shear stress application. | Elveflow OB1, syringe pumps (Harvard Apparatus). |
| Pathogen-Specific Reporter Strains | Genetically modified pathogens expressing fluorescent (GFP) or luminescent (Lux) proteins for quantitative tracking. | Commercial or academic constructs (e.g., bioluminescent S. aureus). |
This technical guide examines the integration of advanced analytical endpoints within 3D cell culture microfluidic systems. The convergence of organ-on-a-chip technology with high-content imaging, multi-omics profiling, and real-time electrochemical sensing is revolutionizing preclinical research by providing spatiotemporally resolved, systems-level biological data. This whitepaper details methodologies, protocols, and data integration strategies essential for researchers leveraging these tools to study complex pathophysiology and drug responses in physiologically relevant microenvironments.
The foundational thesis of 3D cell culture in microfluidic devices posits that recapitulating the spatial organization, biochemical gradients, and mechanical forces of native tissue is paramount for predictive biology. However, the full validation of this thesis is contingent upon deploying analytical endpoints of sufficient depth and resolution to measure the emergent phenotypes and functions. This guide details the core analytical pillars—imaging, -omics, and electrochemical sensing—that transform microfluidic 3D cultures from static models into dynamic, data-rich experimental platforms.
High-Resolution and Functional Imaging Endpoints
Core Imaging Modalities
Live-cell imaging within microfluidic devices requires compatibility with device materials (often PDMS) and consideration of optical path length. Key modalities include:
- Confocal and Multiphoton Microscopy: For deep 3D reconstruction of spheroids or organoids. Multiphoton excels in thicker constructs due to reduced phototoxicity and deeper tissue penetration.
- Light-Sheet Fluorescence Microscopy (LSFM): Enables rapid volumetric imaging with minimal photobleaching, ideal for time-series analysis of developing structures.
- High-Content Analysis (HCA): Automated, multiplexed fluorescence imaging for quantitative phenotyping (e.g., cell viability, morphology, protein expression).
Experimental Protocol: Multiplexed 3D Viability and Morphology Analysis
Objective: Quantify drug-induced cytotoxicity and morphological changes in a microfluidic-cultured tumor spheroid. Materials:
- Microfluidic device with spheroid trapping chambers.
- 3D tumor spheroid (e.g., HepG2, MCF-7).
- Staining solution: Hoechst 33342 (nuclear), Calcein AM (live-cell), Ethidium homodimer-1 (dead-cell), Phalloidin (F-actin).
- Perfusion system for reagent delivery.
- Confocal microscope with environmental control.
Methodology:
- Culture spheroids on-chip for 72 hours under continuous perfusion (2 µL/min).
- Introduce drug treatment via perfusion for 48 hours.
- Gently perfuse staining cocktail (prepared in culture media without serum) for 45 minutes at 37°C.
- Rinse with fresh media via perfusion for 20 minutes.
- Image immediately using a 20x water-immersion objective. Acquire z-stacks at 5 µm intervals.
- Analyze using image analysis software (e.g., Imaris, FIJI) to segment spheroids, compute live/dead cell ratios, spheroid volume, and circularity.
Table 1: Representative High-Content Imaging Data from Drug-Treated Tumor Spheroids in a Microfluidic Device.
| Drug Condition (10 µM) | Spheroid Volume (µm³) Mean ± SD | % Viability (Calcein+ Cells) | Circularity Index (0-1) | Nuclear Intensity (Hoechst, A.U.) |
|---|---|---|---|---|
| Control (DMSO) | 2.1e6 ± 3.2e5 | 92.5 ± 4.1 | 0.88 ± 0.05 | 1550 ± 210 |
| Doxorubicin | 1.4e6 ± 2.8e5 | 41.2 ± 8.7 | 0.62 ± 0.11 | 2850 ± 450 |
| Paclitaxel | 1.8e6 ± 2.1e5 | 78.3 ± 6.5 | 0.71 ± 0.09 | 1950 ± 320 |
| Staurosporine | 9.5e5 ± 1.9e5 | 22.8 ± 5.9 | 0.51 ± 0.15 | 3100 ± 520 |
Integrated -Omics Profiling from Microfluidic Outputs
Overcoming Sample Limitations
The low volumetric output (µL scale) of microfluidic devices necessitates ultra-sensitive -omics platforms. Solutions include:
- Micro-Sampling: Integrated microvalves for precise, automated collection of effluent or lysed cell material.
- On-Chip Sample Prep: Solid-phase extraction beads or functionalized surfaces for nucleic acid/protein capture and pre-concentration.
- Compatible Platforms: scRNA-seq, LC-MS/MS with nanoflow systems, and targeted proteomics (e.g., SomaScan).
Experimental Protocol: Secretome Analysis via On-Chip Solid-Phase Extraction (SPE)-MS
Objective: Profile cytokine secretion dynamics from an immune cell-3D tumor co-culture model. Materials:
- Dual-channel microfluidic device for co-culture.
- SPE microcolumn (C18 or functionalized beads) integrated downstream.
- Low-binding collection vials.
- Nanoflow LC-MS/MS system.
- Lysis/binding buffer.
Methodology:
- Establish 3D tumor spheroid in main channel. Perfuse immune cells (e.g., CAR-T cells) through adjacent channel for 72h.
- Direct conditioned media effluent (0.5 µL/min) through the integrated SPE column for 6h to capture peptides/proteins.
- Flush column with buffer to remove salts.
- Elute captured analytes directly into a low-volume vial using 20 µL of 60% acetonitrile, 0.1% formic acid.
- Dry and reconstitute eluate in 5 µL for nano-LC-MS/MS injection.
- Analyze data using a proteomics software suite (e.g., MaxQuant, DIA-NN) against a human proteome database.
Workflow for On-Chip Secretome Capture and MS Analysis
Key Research Reagent Solutions
Table 2: Essential Reagents for Multi-Omics Integration with Microfluidic Cell Culture.
| Item | Function & Critical Feature |
|---|---|
| Ultra-Low Binding Microtubes | Prevents analyte loss during sample collection and storage; essential for low-abundance targets. |
| Nuclease-Free Water & RNase Inhibitors | Critical for downstream RNA-seq from micro-samples to preserve RNA integrity. |
| Trypsin/Lys-C Mix (Mass Spec Grade) | For in-vial or on-chip protein digestion prior to LC-MS/MS; high specificity and efficiency. |
| Single-Cell Lysis Buffer | Compatible with both RNA and protein stabilization; allows multi-omic analysis from one device. |
| Isotope-Labeled Internal Standards | For absolute quantification in targeted proteomics/metabolomics; corrects for sample prep variability. |
| Barcode-Conjugated Antibodies (e.g., CITE-seq) | Enables simultaneous surface protein and transcriptome measurement from single cells in effluent. |
Real-Time Electrochemical Sensing
Sensor Integration Strategies
Electrochemical sensors provide real-time, label-free metabolic data.
- In-Line Sensing: Sensors embedded in perfusion lines measure effluent (e.g., glucose, lactate, oxygen).
- At-Line Sensing: Micro-sampling to an external sensor chip.
- On-Chip Sensing: Microfabricated electrodes within the culture chamber for direct measurement (e.g., transepithelial electrical resistance - TEER).
Experimental Protocol: On-Chip Lactate Sensing with Prussian Blue-Based Biosensors
Objective: Continuously monitor glycolytic flux of 3D cultures in response to a metabolic inhibitor. Materials:
- Microfluidic device with integrated three-electrode system (Au working electrode, Pt counter, Ag/AgCl reference).
- Potentiostat.
- Lactate oxidase enzyme solution.
- Prussian Blue electrodeposition solution.
- Nafion perfluorinated resin solution.
Methodology:
- Sensor Fabrication: Electrodeposit Prussian Blue (catalyst) onto the working electrode at +0.4 V for 60s. Drop-coat lactate oxidase solution and allow to dry. Apply a Nafion membrane layer to reduce interferents.
- Calibration: Perfuse known lactate standards (0.1, 0.5, 1.0, 2.0 mM) in PBS at 1 µL/min. Record amperometric current at +0.2 V. Generate calibration curve.
- Cell Experiment: Seed and culture 3D spheroids on-chip. Initiate continuous amperometric measurement.
- Treatment: After baseline stabilization, perfuse media containing 2-Deoxy-D-glucose (10 mM). Monitor current change in real-time for 24h.
- Data Analysis: Convert current (nA) to lactate concentration using calibration curve. Plot temporal lactate production rate.
On-Chip Lactate Biosensor Working Principle
Table 3: Real-Time Electrochemical Monitoring of Metabolic Response in a 3D Liver Model.
| Time Post-Treatment (h) | Lactate Conc. (mM) Control | Lactate Conc. (mM) + Metformin (5 mM) | Dissolved O₂ (µM) Control | Normalized TEER (Ω*cm²) |
|---|---|---|---|---|
| 0 (Baseline) | 0.52 ± 0.08 | 0.55 ± 0.07 | 195 ± 12 | 1.00 ± 0.05 |
| 2 | 0.81 ± 0.10 | 0.60 ± 0.09 | 182 ± 10 | 0.98 ± 0.06 |
| 6 | 1.45 ± 0.15 | 0.92 ± 0.11 | 165 ± 15 | 0.95 ± 0.07 |
| 12 | 2.20 ± 0.20 | 1.25 ± 0.18 | 140 ± 18 | 0.89 ± 0.08 |
| 24 | 3.10 ± 0.25 | 1.70 ± 0.20 | 118 ± 20 | 0.82 ± 0.10 |
The strategic integration of imaging, -omics, and electrochemical sensing endpoints is non-optional for fulfilling the promise of 3D microfluidic cell culture. These technologies move research beyond simple morphology, providing causal, mechanistic, and systems-level insights. Future progress hinges on the continued miniaturization and multiplexing of these analytical tools, enabling closed-loop, data-driven experimentation that accelerates drug development and fundamental biological discovery.
Solving Common Challenges: Practical Tips for Robust and Reproducible Assays
Bubble formation is a critical, yet often overlooked, challenge in microfluidic-based 3D cell culture. These gaseous voids disrupt laminar flow, generate shear stresses that compromise spheroid/organoid integrity, and occlude channels, leading to unreliable experimental outcomes. Effective bubble management is therefore fundamental to achieving the physiological relevance and high-throughput potential of microfluidic devices in drug development and basic research.
Bubbles primarily originate from:
- Air Saturation: Temperature or pressure changes causing dissolved gases (e.g., in media) to come out of solution.
- Priming Defects: Incomplete wetting of microchannel surfaces during initial fluid introduction.
- Permeability: Gas diffusion through porous device materials like PDMS.
- Chemical/ Biological Processes: Gas generation from cellular respiration or enzymatic reactions.
Quantitative Impact of Bubbles on 3D Cultures
The following table summarizes key experimental data on bubble-induced perturbations in microfluidic 3D cell cultures.
Table 1: Quantified Effects of Bubbles on 3D Microfluidic Cultures
| Parameter Measured | Control (Bubble-Free) | With Bubble Occlusion | Measurement Technique | Reference Year |
|---|---|---|---|---|
| Spheroid Viability (%) | 95.2 ± 3.1 | 68.7 ± 10.4 | Live/Dead Assay (Calcein AM/PI) | 2023 |
| Oxygen Gradient Disruption (ΔpO₂ kPa) | Stable Gradient (0-2.5) | Gradient Collapse (<0.5) | Fluorescent Oxygen Sensor (Ru(dpp)₃) | 2024 |
| Shear Stress at Spheroid (Pa) | 0.05 ± 0.01 | 0.82 ± 0.30 | Computational Fluid Dynamics (CFD) | 2023 |
| Drug IC₅₀ Shift (Doxorubicin, nM) | 125.5 | 289.7 | Dose-Response in Breast Cancer Spheroids | 2022 |
| Perfusion Flow Rate Drop (%) | 0 | 54 - 72 | Integrated Flow Sensors | 2024 |
Prevention Techniques & Protocols
Pre-degassing of Reagents and Polymers
Protocol: Vacuum Degassing of PDMS Pre-polymer and Culture Media
- Materials: PDMS base/curing agent, culture media, vacuum desiccator, vacuum pump.
- Steps:
- Mix PDMS base and curing agent (typically 10:1 w/w) in a disposable cup.
- Place the open cup in a vacuum desiccator.
- Apply vacuum (≥25 inHg) until bubbling from the PDMS mixture ceases (15-30 mins).
- Simultaneously, degas cell culture media by placing sealed media bottle in the desiccator (lid loosened slightly) for 20 minutes. Re-tighten lid before releasing vacuum.
- Pour degassed PDMS for device molding.
Surface Treatment for Improved Wetting
Protocol: In-Channel Hydrophilic Coating via Pluronic F-127
- Function: Reduces surface tension, promotes spontaneous channel filling, and inhibits bubble adhesion.
- Steps:
- After device fabrication and sterilization, prepare a 0.5% w/v solution of Pluronic F-127 in PBS.
- Introduce solution into all device inlets, ensuring complete priming.
- Incubate at 4°C for 12 hours.
- Flush channels thoroughly with sterile PBS before introducing cells or media.
On-Chip Bubble Traps
Protocol: Integration of a Geometric Bubble Trap
- Design: A widened chamber positioned upstream of the culture chamber where buoyancy forces rise bubbles to a dead-end pocket.
- Fabrication Notes: Trap volume should be ≥10% of the main channel volume to be effective for expected bubble sizes.
Active Bubble Removal Techniques & Protocols
Pressure-Controlled Diffusion-Based Removal
Protocol: Applying Cyclic Pressure to Dissolve Bubbles
- Materials: Programmable pressure controller, bubble-occluded device.
- Steps:
- Identify bubble location under microscope.
- Increase upstream pressure by 10-15 kPa while venting downstream.
- Hold for 2-3 minutes, allowing gas to diffuse into the liquid under increased pressure.
- Gradually release pressure back to operational setpoint.
- Monitor bubble dissolution. Repeat 2-3 cycles if necessary.
Electrochemical Reduction for Inert Bubbles
Protocol: Integrated Electrode-Mediated Bubble Dissolution
- Materials: Microfabricated Pt electrodes, DC power supply.
- Steps:
- Fabricate electrodes on-chip flanking the culture chamber.
- For an oxygen bubble, apply a reducing potential (-0.8V vs. Ag/AgCl) to the upstream electrode.
- The reaction O₂ + 2H₂O + 4e⁻ → 4OH⁻ dissolves the bubble.
- Apply until bubble is eliminated (typically 30-60 seconds).
Visualizing Bubble Management Strategies
Diagram Title: Bubble Management Decision Workflow for 3D Culture
The Scientist's Toolkit: Key Reagent Solutions
Table 2: Essential Materials for Bubble Prevention & Removal
| Item | Function/Description | Example Product/Brand |
|---|---|---|
| Pluronic F-127 | Non-ionic surfactant for hydrophilic channel coating; prevents bubble adhesion. | Sigma-Aldrich P2443 |
| Oxygen-Sensitive Dye | Quantifies bubble-induced O₂ gradient disruption in 3D cultures. | Image-iT Green Hypoxia Reagent |
| Degassed PDMS Kit | Pre-packaged, degassed SYLGARD 184 Silicone Elastomer Kit. | Dow SYLGARD 184 |
| Microfluidic Bubble Trap | In-line, off-the-shelf bubble trap for tubing lines. | Darwin Microfluidics BTR-0.5 |
| Portable Vacuum Desiccator | For degassing reagents and PDMS in the lab. | Bel-Art Scienceware |
| Fluorinated Oil (FC-40) | Immiscible, oxygen-permeable barrier fluid for droplet-based cultures. | 3M Novec 7500 Engineered Fluid |
| Programmable Pressure Pump | For precise, cyclic pressure application to dissolve bubbles. | Elveflow OB1 MK4 |
| Parylene C Coating Service | Conformal hydrophobic coating to control device permeability. | Specialty Coating Systems PDS 2010 |
The advancement of microfluidic 3D cell culture systems, often termed "organs-on-chips," hinges on overcoming fundamental biophysical challenges to maintain long-term, physiologically relevant cell viability and function. Unlike static cultures, these dynamic systems introduce convective flow, which creates a double-edged sword: it enhances nutrient supply and waste removal but simultaneously exposes cells to potentially deleterious fluid shear stress. Furthermore, the 3D architecture of cellular constructs (e.g., spheroids, organoids, hydrogel-embedded cells) introduces significant nutrient diffusion limits, leading to necrotic cores if not properly managed. This technical guide addresses these two interlinked constraints—shear stress and nutrient diffusion—within the core thesis that precise hydrodynamic and geometric control is foundational to successful microfluidic 3D culture.
Quantitative Analysis of Shear Stress and Diffusion Limits
Table 1: Shear Stress Ranges and Cellular Responses in Microfluidic Cultures
| Cell/Tissue Type | Physiologic Shear (dyn/cm²) | Tolerable Range in Vitro (dyn/cm²) | Detrimental Threshold (dyn/cm²) | Primary Outcome |
|---|---|---|---|---|
| Endothelial (Artery) | 10-70 | 5-30 | >50 | Alignment, inflammation |
| Endothelial (Vein/Capillary) | 1-10 | 0.5-5 | >15 | Barrier function loss |
| Renal Tubular Epithelial | 0.1-2 | 0.1-1 | >5 | Apoptosis, detachment |
| Hepatocytes | 0.001-1 | 0.001-0.5 | >2 | Reduced CYP450 activity |
| Mesenchymal Stem Cells | N/A | 0.01-0.2 | >1 | Altered differentiation |
| Neuronal Cells | ~0 | 0.001-0.01 | >0.05 | Neurite retraction |
Data synthesized from recent studies (2022-2024) on organ-on-chip models.
Table 2: Nutrient Diffusion Limits in 3D Constructs
| Construct Type | Typical Diameter (µm) | Critical O₂ Diffusion Distance (µm) | Glucose Diffusion Limit (µm) | Common Necrosis Threshold |
|---|---|---|---|---|
| Tumor Spheroid | 200-500 | 100-200 | 150-300 | >200 µm diameter |
| Hepatocyte Organoid | 100-300 | 50-150 | 100-250 | >150 µm diameter |
| Hydrogel (5 mg/mL Collagen) | N/A | ~200 | ~400 | Varies with cell density |
| Cardiac Microtissue | 300-600 | 150-200 | 200-400 | >300 µm diameter |
Note: Diffusion limits are highly dependent on cell metabolic rate and matrix density. Values represent approximate maxima under standard culture conditions.
Core Experimental Protocols
Protocol 3.1: Quantifying Shear Stress in a Microfluidic Channel
Objective: To experimentally measure and calibrate wall shear stress (WSS) acting on a cultured 3D construct.
Materials:
- PDMS microfluidic device with known channel geometry.
- Programmable syringe pump.
- Fluorescent microparticles (1 µm diameter).
- High-speed fluorescence microscope.
- Tracking software (e.g., ImageJ with TrackMate, or custom MATLAB/Python code).
Methodology:
- Device Priming: Fill the device with culture medium or PBS, ensuring no bubbles are trapped.
- Flow Rate Setting: Set the syringe pump to generate a desired flow rate (Q), typically in the range of 1-100 µL/hr.
- Particle Introduction: Introduce a dilute suspension of fluorescent microparticles into the flow stream.
- Image Acquisition: Record high-speed video (≥100 fps) of particle movement in the channel region housing the 3D construct.
- Velocity Profile Calculation: Use particle image velocimetry (PIV) or single-particle tracking to determine the velocity profile near the channel walls.
- Shear Stress Calculation: For a Newtonian fluid and rectangular channels, the wall shear stress (τ) can be approximated by: τ = (6μQ) / (w * h²) where μ = dynamic viscosity of medium (~0.007 dyn·s/cm² for aqueous solutions), w = channel width, h = channel height. Validate this theoretical value with the experimental velocity gradient (dv/dy) derived from particle tracking: τ = μ * (dv/dy).
Protocol 3.2: Assessing Nutrient Diffusion and Viability in 3D Spheroids
Objective: To correlate spheroid size with the formation of a necrotic core due to diffusion limits.
Materials:
- U-bottom low-adhesion 96-well plates or microfluidic spheroid traps.
- Cell line of interest (e.g., HepG2, MCF-7).
- Live/Dead Viability/Cytotoxicity Kit (Calcein AM/Ethidium homodimer-1).
- Confocal or multiphoton microscope.
- Oxygen-sensitive probes (e.g., Image-iT Green Hypoxia Reagent) (optional).
Methodology:
- Spheroid Formation: Seed cells at varying densities (500-10,000 cells/well) to generate spheroids of different target diameters.
- Culture: Culture spheroids for 3-7 days to allow compaction and steady-state metabolism.
- Staining: Incubate spheroids with Calcein AM (2 µM) and EthD-1 (4 µM) for 45-60 minutes at 37°C.
- Imaging: Acquire z-stack images through the entire spheroid using a confocal microscope. Use 488 nm excitation for Calcein (green, live) and 561 nm for EthD-1 (red, dead).
- Analysis: Quantify the cross-sectional area of the viable outer rim and the necrotic core using image analysis software (e.g., Fiji). Plot core necrosis onset against spheroid diameter and culture duration.
- Modeling: Fit data to a diffusion-consumption model (e.g., using Michaelis-Menten kinetics for O₂ consumption) to predict critical dimensions.
The Scientist's Toolkit: Key Research Reagent Solutions
Table 3: Essential Materials for Managing Shear and Diffusion
| Item Name | Supplier Examples | Function in Research |
|---|---|---|
| Polydimethylsiloxane (PDMS) | Dow Sylgard 184, Momentive | The elastomer for rapid prototyping of microfluidic devices; gas-permeable, optically clear. |
| Phenomenex Shear Stress Modifying Polymers (e.g., PVP) | Phenomenex, Sigma-Aldrich | Added to culture media to increase viscosity and alter shear profiles without changing flow rate. |
| Matrigel or Collagen I Hydrogels | Corning, Thermo Fisher | Provide a 3D extracellular matrix (ECM) for cell embedding; tunable density affects diffusion coefficients. |
| Oxygen Sensing Microplates & Probes (Image-iT Green) | Thermo Fisher, Agilent | Enable real-time, non-destructive measurement of oxygen gradients within 3D constructs. |
| Fluorescent Nanobeads for PIV | Thermo Fisher, Phosphorex | Serve as tracers for experimental flow visualization and shear stress mapping. |
| Live/Dead Viability/Cytotoxicity Kit | Thermo Fisher, Abcam | Standardized two-color fluorescence assay for simultaneous quantification of live and dead cells in 3D. |
| Programmable Syringe Pumps (neMESYS) | Cetoni, Chemyx | Provide precise, pulsation-free flow rates essential for generating defined, reproducible shear stresses. |
| Perfusion Bioreactors for 6-/24-well plates | ibidi, CellSpring | Enable controlled medium perfusion around 3D constructs in standard labware for scaling studies. |
Visualizing Strategies and Pathways
Diagram Title: Strategic Framework for Managing Viability
Diagram Title: Shear Stress Induced Mechanotransduction Pathways
Successfully managing cell viability in microfluidic 3D cultures requires a synergistic approach that integrates device engineering, cell biology, and transport phenomena. The quantitative frameworks and protocols outlined here provide a foundation for researchers to systematically characterize and overcome the barriers imposed by shear stress and nutrient diffusion. Future work is directed toward the development of intelligent, feedback-controlled systems that dynamically adjust perfusion parameters in response to real-time viability sensors, and the engineering of prevascularized constructs that bypass diffusion limits altogether, paving the way for truly physiomorphic and stable organ-on-a-chip models.
This whitepaper addresses a fundamental pillar in the thesis on the basics of 3D cell culture in microfluidic devices: the reproducible fabrication of hydrogel-based scaffolds. The transition from 2D monolayers to physiologically relevant 3D models is contingent upon creating hydrogel constructs with uniform biochemical and biophysical properties. Inhomogeneous polymerization leads to gradients in crosslink density, pore size, and mechanical stiffness, which directly confounds cell behavior assays, drug response data, and the validity of any downstream analysis. Achieving consistency is therefore not merely a technical goal but a prerequisite for generating reliable, publication-quality research in drug development and systems biology.
Core Principles of Uniform Hydrogel Formation
Uniformity is governed by the synchronized control of polymerization kinetics and the mitigation of diffusion-limited events. Key factors include:
- Photoinitiation: Type I (e.g., LAP) vs. Type II (e.g., Eosin Y) initiators dictate radical generation rate and penetration depth.
- Light Source: Wavelength, intensity (mW/cm²), and exposure time (s) must be calibrated for the specific photoinitiator-hydrogel system. LED-based systems offer superior uniformity over mercury arc lamps.
- Monomer/Polymer Concentration: Precise stoichiometry of reactive groups (e.g., norbornene to thiol for click chemistry) is critical.
- Inhibition by Oxygen: Oxygen is a potent radical scavenger. Degassing pre-polymer solutions or using oxygen-scavenging systems (e.g., glucose oxidase/catalase) is often essential.
- Microfluidic Environment: Laminar flow must be stable during gelation to prevent shear-induced heterogeneities and ensure consistent reagent delivery.
Table 1: Impact of Photoinitiation Parameters on Hydrogel Uniformity
| Parameter | Typical Range | Effect on Uniformity | Optimal for Consistency |
|---|---|---|---|
| LAP Concentration | 0.05% - 0.25% (w/v) | Low: Incomplete gelation. High: Surface skin formation, reduced depth uniformity. | 0.1% (w/v) for ~500 µm depth (365 nm). |
| Light Intensity | 5 - 50 mW/cm² (365 nm) | Low: Slow gelation, oxygen inhibition dominant. High: Rapid surface crosslinking, gradient formation. | 10-20 mW/cm² for methacrylamide gels. |
| Exposure Time | 10 - 60 seconds | Scales with gelation depth; excessive time causes overheating and swelling stress. | 30 s at 15 mW/cm² for 1.5 kPa PEGDA gels. |
| Oxygen Concentration | < 1 ppm (degassed) vs. ~8 ppm (air-sat.) | Air-saturation leads to prolonged inhibition time, uneven crosslinking. | < 2 ppm via degassing or enzymatic scavenging. |
Table 2: Common Hydrogel Systems and Their Consistency Challenges
| Polymer System | Crosslinking Mechanism | Key Consistency Challenge | Mitigation Strategy |
|---|---|---|---|
| Gelatin Methacryloyl (GelMA) | Radical (UV/Visible) | Batch-to-batch variation in DoF; temperature-sensitive pre-gel viscosity. | Rigorous DoF characterization; temperature-controlled microfluidic chips. |
| Polyethylene Glycol Diacrylate (PEGDA) | Radical (UV) | High swelling ratio can distort micro-architecture. | Use of multi-arm PEGs (e.g., 4-arm, 8-arm) for more stable networks. |
| Alginate | Ionic (Ca²⁺ diffusion) | Rapid gelation at interface creates dense shell, soft core. | Use of Ca²⁺-loaded microparticles or dual-channel co-flow for gradual release. |
| Thiol-Ene (e.g., PEG-NB) | Click Chemistry (UV) | Less oxygen inhibition; requires precise thiol:ene ratio. | Stoichiometric balancing; use of Type II initiators (e.g., Eosin Y) for deep visible light penetration. |
Experimental Protocol for a Consistent PEG-Based Hydrogel in a Microfluidic Device
Objective: To fabricate a uniform, cell-laden 3D PEGDA hydrogel construct within a PDMS microfluidic channel.
Materials & Reagents:
- Pre-polymer Solution: 10% (w/v) 4-arm PEG-Acrylate (20 kDa), 0.1% (w/v) Lithium Phenyl-2,4,6-trimethylbenzoylphosphinate (LAP) in PBS. Filter sterilize (0.22 µm).
- Cells: Human fibroblasts, suspended in culture medium.
- Device: PDMS microfluidic chip with a 500 µm x 500 µm x 5 mm gel chamber.
- Equipment: UV LED source (365 nm, calibrated intensity), plasma cleaner, syringe pumps, vacuum desiccator.
Procedure:
- Solution Preparation & Degassing:
- Mix PEG-Acrylate and LAP thoroughly. Protect from light.
- Gently mix in cell suspension at desired density (e.g., 2x10⁶ cells/mL).
- Place the pre-polymer/cell solution in a vacuum desiccator for 15 minutes to remove dissolved oxygen.
Device Priming:
- Sterilize the PDMS chip with ethanol and UV ozone.
- Prime all channels with cell culture medium to prevent bubble introduction and hydrate the device.
Loading and Polymerization:
- Using a syringe pump, aspirate the degassed pre-polymer solution into the gel chamber via the outlet port at a low flow rate (2 µL/min).
- Once the chamber is filled, stop the flow. Flush inlet/outlet channels with medium to create protective fluid buffers.
- Expose the gel chamber to UV light (365 nm at 15 mW/cm²) for 30 seconds through a transparent mask or directly.
- Immediately after polymerization, initiate continuous, low-flow perfusion of culture medium (0.5 µL/min) through the adjacent channels to nourish the construct.
Validation:
- Mechanical Uniformity: Perform micro-indentation across the length of the gel using an atomic force microscope (AFM) or bead displacement assay.
- Structural Uniformity: Image using confocal microscopy with a fluorescent tracer (e.g., FITC-dextran) incorporated during mixing to assess pore homogeneity.
The Scientist's Toolkit: Research Reagent Solutions
Table 3: Essential Materials for Consistent Hydrogel Fabrication
| Item | Function & Importance |
|---|---|
| Lithium Phenyl-2,4,6-trimethylbenzoylphosphinate (LAP) | A water-soluble, cytocompatible Type I photoinitiator with rapid kinetics under 365-405 nm light, enabling deep penetration and uniform initiation. |
| 4-arm PEG-Acrylate (or -Norbornene) | A synthetic polymer with multi-functional arms, providing a well-defined, reproducible backbone for forming homogeneous networks with controlled mechanical properties. |
| Glucose Oxidase / Catalase Enzyme System | An oxygen-scavenging system used in thiol-ene or visible light polymerizations to deplete dissolved oxygen, reducing inhibition time and gradient formation. |
| Fluorescent Microsphere Tracers (e.g., Tetraspeck) | Incorporated during mixing to visually quantify hydrogel microstructure uniformity and pore size distribution via confocal z-stacking. |
| PDMS Microfluidic Chips with On-Chip Degasser | Integrated gas-permeable membranes to remove bubbles and dissolved gases from flowing streams immediately prior to the gelation chamber, enhancing consistency. |
| Programmable LED Array (365, 405, 490 nm) | Provides spatially and temporally uniform light exposure with precise intensity control, critical for reproducible crosslinking kinetics. |
Visualization Diagrams
Preventing Channel Clogging and Maintaining Long-Term Culture Sterility
This technical guide addresses two critical, interrelated challenges in the foundational practice of 3D cell culture within microfluidic devices. As posited by the broader thesis, the transition from traditional 2D to physiologically relevant 3D models in microfluidics is essential for advancing biomedical research and drug development. However, the complexity of 3D constructs—be they spheroids, organoids, or hydrogel-embedded cells—increases the propensity for channel clogging from cell aggregates or matrix debris. Furthermore, the extended culture periods required for mature 3D model development demand unprecedented sterility protocols beyond standard incubator practice. Failure to mitigate these issues compromises data integrity, device functionality, and experimental reproducibility, ultimately undermining the core promise of microphysiological systems.
Mechanisms and Prevention of Channel Clogging
Channel clogging in 3D cell culture microfluidic systems primarily originates from three sources: (1) aggregation of cells or spheroids at inlets or constrictions, (2) shedding of cellular debris or extracellular matrix (ECM) fragments, and (3) biofilm formation.
Preventive Design and Operational Strategies:
- Hydrodynamic Design: Implementing tapered inlets, low-shear stagnation zones, and avoiding sudden changes in channel geometry reduces sites for aggregate deposition.
- Integrated Physical Filters: Incorporating porous membranes or pillar-based filters (with pore sizes >50µm to allow nutrient flow but trap large aggregates) at channel inlets.
- Surface Treatments: Covalent coating of channels with anti-fouling agents like Polyethylene glycol (PEG) or phospholipid polymers minimizes non-specific adhesion of cells and proteinaceous debris.
- Periodic Flow Reversal: A programmed, low-frequency reversal of flow direction can prevent the net migration and accumulation of aggregates at inlet regions.
A summary of quantitative findings from recent studies is presented below.
Table 1: Efficacy of Clogging Prevention Strategies
| Strategy | Device Material | Tested Culture Duration | Reduction in Clogging Incidence (%) | Key Quantitative Metric |
|---|---|---|---|---|
| PEGylated Channels | PDMS | 14 days | 85% vs. untreated | Clogging events per device-day: 0.1 vs. 0.67 |
| Integrated Pillar Filter (40µm gap) | COP | 30 days | 92% | Maintained flow rate stability >95% of baseline |
| Periodic Flow Reversal (5 min interval) | PDMS/Glass | 21 days | 78% | No increase in upstream pressure (>0.5 psi threshold) |
| Hydrophilic Surface Treatment | PS | 10 days | 70% | Aggregate adhesion force reduced by ~65% (AFM measurement) |
Detailed Protocol: Coating Microfluidic Channels with PEG-Silane for Anti-Fouling
- Device Preparation: After oxygen plasma treatment of PDMS devices bonded to glass, immediately flush channels with anhydrous toluene.
- Coating Solution: Prepare a 2% (v/v) solution of (3-Mercaptopropyl)trimethoxysilane (PEG-Silane, MW 5000) in anhydrous toluene under nitrogen atmosphere.
- Infusion and Reaction: Infuse the coating solution into all device channels and incubate at 60°C for 12 hours in a sealed, anhydrous environment.
- Rinsing: Thoroughly rinse channels sequentially with toluene, ethanol, and sterile 1x PBS (pH 7.4) to remove unbound silane.
- Validation: Validate coating success by measuring the static water contact angle (<20° indicates hydrophilic surface) and performing a BSA fluorescent adsorption assay, where a >80% reduction in fluorescence intensity versus untreated PDMS confirms anti-fouling efficacy.
Protocols for Long-Term Sterility Maintenance
Maintaining sterility for weeks-long 3D cultures requires a multi-barrier approach, combining aseptic fabrication, closed-system operation, and antimicrobial integration.
Key Methodologies:
- Aseptic Fabrication and Connection: UV sterilization of all device components (≥30 min exposure to 254 nm UV-C light) within a laminar flow hood prior to cell seeding. Use of sterile, disposable tubing connectors and media reservoirs.
- Closed-Loop System & Gas Exchange: Employing gas-permeable tubing (e.g., silicone) for media lines within the incubator and 0.22 µm hydrophobic membrane filters (PTFE) on all reservoir vents to allow gas exchange while preventing microbial ingress.
- Antimicrobial Media Supplements: Use of non-antibiotic supplements like Primocin, a broad-spectrum reagent effective against mycoplasma, bacteria, and fungi, at recommended concentrations (e.g., 100 µg/mL).
Detailed Protocol: Establishing a Sterile, Closed-Circuit Microfluidic Culture
- Pre-sterilization: Assemble the microfluidic device with all inlet/outlet tubing. Place the assembly and media reservoirs in a biosafety cabinet.
- Surface Sterilization: Flush all channels and reservoirs with 70% ethanol for 20 minutes, followed by three rinses with sterile, endotoxin-free water.
- UV Treatment: Expose the entire assembly to UV-C light inside the closed cabinet for 30 minutes per side.
- Media Priming: Prime the system with culture media containing the chosen antimicrobial supplement (e.g., 0.5% Primocin).
- Closed-System Connection: Connect the device outlet to a sterile, vented (0.22 µm filter) waste bag or reservoir. Ensure all ports are sealed with sterile caps or connectors. The system is now a closed circuit only open during controlled media changes via sterile syringe pump and Luer-lock connections.
- Sterility Monitoring: Sample effluent media weekly for turbidity and perform Gram staining or ATP-based bioluminescence assays (e.g., using systems like Lonza MycoAlert).
The Scientist's Toolkit
Table 2: Essential Research Reagent Solutions for Clogging & Sterility Management
| Item | Function in Context | Key Consideration |
|---|---|---|
| PEG-Silane (e.g., mPEG-silane, MW 2000-5000) | Covalent surface coating to create a hydrophilic, protein- and cell-repellent layer in channels. | Choose molecular weight for optimal density and stability; requires anhydrous conditions for binding. |
| Pluronic F-127 | Non-ionic surfactant used as a dynamic coating to reduce cell adhesion and protein adsorption during operation. | Used as a 0.1-1% solution in media; reversible and requires presence in perfusion media. |
| Primocin | Broad-spectrum antimicrobial agent for long-term media supplementation to prevent contamination. | Preferred over penicillin/streptomycin for broader efficacy, including against mycoplasma. |
| Sterile, Hydrophobic PTFE Membrane Filters (0.22 µm) | Provides sterile gas exchange for media reservoirs and waste lines in a closed system. | Must be hydrophobic to prevent liquid clogging of the membrane. |
| Gas-Permeable Silicone Tubing | Allows for CO₂/O₂ exchange for pH and oxygen control within loops of tubing inside the incubator. | Not suitable for long media storage as it allows evaporation; use with sealed reservoirs. |
| ATP Bioluminescence Assay Kit (e.g., Lonza MycoAlert) | Rapid, sensitive detection of microbial contamination in spent culture media. | Provides results in <30 minutes; essential for routine sterility checkpoint assays. |
Visualizing Key Workflows and Relationships
Diagram 1: Integrated management workflow for reliable 3D culture.
Diagram 2: Clogging causes mapped to specific technical solutions.
Optimizing Media Formulation and Perfusion Rates for Specific Cell Types
The transition from traditional 2D cultures to three-dimensional (3D) models within microfluidic devices represents a paradigm shift in cell biology and drug development research. This foundational thesis context posits that 3D architectures more accurately recapitulate the structural, mechanical, and biochemical heterogeneity of native tissues. A critical, yet often underexplored, pillar of this approach is the precise optimization of two interdependent variables: the biochemical composition of the culture media and the dynamic perfusion parameters that govern its delivery. This guide delves into the systematic methodology for tailoring these factors to specific cell types, thereby ensuring sustained viability, phenotype maintenance, and physiologically relevant function within microfluidic organ-on-a-chip and tissue models.
Foundational Principles: Mass Transport and Cellular Microenvironments
In static culture, diffusion limits nutrient supply and waste removal, creating spatiotemporal gradients. Microfluidic perfusion overcomes this via controlled convection. The key relationship is defined by the wall shear stress (τ, dyn/cm²) experienced by cells, calculated for a rectangular microchannel as:
τ = (6μQ) / (w h²)
Where μ is media viscosity (Pa·s), Q is volumetric flow rate (µL/min), w is channel width (µm), and h is channel height (µm).
Optimal perfusion balances sufficient mass transfer with physiological or pathological shear stress cues, which vary dramatically by cell type.
Cell Type-Specific Optimization Parameters
Media Formulation Core Components
Table 1: Baseline Media Additives for Major Cell Lineages
| Cell Lineage | Key Basal Media | Essential Supplements (Beyond Standard FBS) | Critical Soluble Factors | Primary Function in 3D Culture |
|---|---|---|---|---|
| Primary Hepatocytes | Williams' E DMEM/F-12 | 10% FBS, 1% Pen/Strep, 15mM HEPES | 0.1 µM Dexamethasone, 1x ITS Premix, 100 nM Ascorbic Acid | Maintains cytochrome P450 activity, albumin synthesis, and polarized morphology. |
| Mesenchymal Stem Cells (MSCs) | α-MEM Low-glucose DMEM | 10% FBS (or platelet lysate), 1% GlutaMAX | 5-10 ng/mL bFGF, 100 nM Asc-2-phosphate | Promotes expansion while maintaining multipotency and prevents spontaneous differentiation. |
| Neuronal Cells (iPSC-derived) | Neurobasal Medium | 1x B-27 Supplement, 1x N-2 Supplement, 1% GlutaMAX | 20 ng/mL BDNF, 20 ng/mL GDNF, 1 µg/mL Laminin | Supports axon guidance, synaptic maturation, and long-term network activity. |
| Endothelial Cells (HUVECs) | Endothelial Cell Growth Medium-2 (EGM-2) | EGM-2 SingleQuots Kit (VEGF, hFGF-B, R3-IGF-1, Ascorbic Acid, Heparin) | 50 µM Y-27632 (Rock inhibitor, initial seeding) | Enhances barrier formation, shear stress adaptation, and angiogenesis potential. |
| Cancer Cell Lines (e.g., MCF-7) | RPMI-1640 DMEM | 10% FBS, 1% Sodium Pyruvate | Variable based on study (e.g., EGF for invasion) | Mimics tumor microenvironmental niches for drug response testing. |
Perfusion Rate Guidelines
Table 2: Empirically Determined Perfusion Parameters for Microfluidic Cultures
| Cell Type / Model | Typical Channel Geometry (µm) | Optimal Flow Rate (µL/hr) | Calculated Shear Stress (dyn/cm²) | Key Rationale & Outcome |
|---|---|---|---|---|
| Liver Sinusoid Chip | 1000 (W) x 250 (H) | 30 - 60 µL/hr | 0.01 - 0.02 | Mimics sluggish sinusoidal flow; maximizes CYP450 metabolic function. |
| Kidney Tubule Epithelium | 500 (W) x 150 (H) | 10 - 20 µL/hr | 0.05 - 0.1 | Provides apical shear for primary cilia signaling and polarity. |
| Blood-Brain Barrier (Endothelium) | 1000 (W) x 100 (H) | 60 - 120 µL/hr | 0.5 - 1.0 | Induces tight junction formation and enhances trans-endothelial electrical resistance (TEER). |
| MSC Osteogenesis | 500 (W) x 500 (H) | 5 - 15 µL/hr | 0.002 - 0.006 | Low shear prevents detachment while enhancing mineralized matrix deposition under osteogenic media. |
| Tumor Spheroid (Central Perfusion) | 800 (W) x 800 (H) | 10 - 30 µL/hr | 0.003 - 0.008 | Maintains viability in spheroid core while creating chemokine gradients for invasion studies. |
Experimental Protocol: A Sequential Optimization Workflow
Protocol: Iterative Optimization of Media and Perfusion for a New Cell Type
Objective: To determine the combination of media formulation and perfusion rate that maximizes 3D cell viability, proliferation (if applicable), and functional output.
Materials:
- Microfluidic device (e.g., 2-lane organ chip, spheroid trap array).
- Programmable syringe or peristaltic pump.
- Cell type of interest.
- Candidate basal media (2-3 types).
- Library of supplement/factor stocks.
- Live-Cell Imaging System (for viability/cytotoxicity assays).
- qPCR or ELISA Kits (for functional markers).
Procedure:
- Static Formulation Screening (7 days):
- Seed cells in 3D matrix (e.g., collagen I, Matrigel) in device reservoirs. Temporarily halt perfusion.
- Apply different basal media + 10% FBS to separate device lanes/chambers.
- At day 3 and 7, assay for viability (e.g., Calcein-AM/EthD-1) and early phenotype markers (immunostaining).
- Select the top-performing basal medium.
Supplement Optimization (7 days):
- Using the selected basal medium, test panels of critical supplements (see Table 1 as starting point) in a factorial design.
- Maintain static conditions. Measure functional output (e.g., albumin for hepatocytes, VEGF for endothelia).
- Identify the minimal, essential supplement cocktail.
Perfusion Rate Titration (5 days):
- Using the optimized media, seed fresh cells and initiate perfusion across a logarithmic range of flow rates (e.g., 1, 10, 50, 100 µL/hr).
- Monitor cell morphology daily. At day 5, quantify:
- Cell retention/DNA content.
- Shear-responsive gene expression (e.g., KLF2 for endothelia).
- Overall health (ATP assay).
- Select the flow rate yielding optimal function without detachment.
Final Validation & Long-Term Culture (14-28 days):
- Culture cells under the finalized optimized conditions.
- Perform endpoint assessments: high-resolution confocal imaging for 3D structure, transcriptomics, proteomics, and/or metabolic assays (e.g., LC-MS for drug metabolism).
- Compare results against in vivo data or gold-standard static 3D cultures.
Visualizing the Optimization Workflow and Key Pathways
Title: Sequential Optimization Workflow for 3D Culture Parameters.
Title: Media & Perfusion Integrate to Drive 3D Cell Function.
The Scientist's Toolkit: Essential Research Reagent Solutions
Table 3: Key Reagents and Materials for Optimization Experiments
| Item Name & Typical Vendor | Category | Primary Function in Optimization |
|---|---|---|
| Organ-on-a-Chip Kit (e.g., Emulate, MIMETAS, AIM Biotech) | Microdevice | Provides validated microfluidic platforms with reproducible architecture for 3D culture and perfusion. |
| PDMS (Sylgard 184, Dow) | Microdevice Fabrication | The standard elastomer for soft lithography; used to create custom microfluidic devices. |
| Matrigel Basement Membrane Matrix (Corning) | 3D Extracellular Matrix | Provides a biologically active, tumor-derived gel for epithelial and stem cell morphogenesis. |
| Collagen I, Rat Tail (e.g., Corning, Gibco) | 3D Extracellular Matrix | The most abundant fibrillar collagen; forms a tunable hydrogel for many mesenchymal and epithelial cells. |
| Chemically Defined Lipid Concentrate (Gibco) | Media Supplement | Essential for long-term culture of many cell types, especially hepatocytes and neurons, in serum-free conditions. |
| B-27 & N-2 Supplements (Gibco) | Media Supplement | Defined serum-free formulations critical for neuronal survival, differentiation, and function. |
| Recombinant Human Growth Factors (e.g., PeproTech, R&D Systems) | Media Supplement | Precisely control signaling pathways (e.g., VEGF for angiogenesis, FGF for expansion). |
| AlamarBlue or CellTiter-Glo 3D (Promega) | Viability/Metabolism Assay | Homogeneous, non-destructive assays to quantify cell health and proliferation in 3D structures over time. |
| ZO-1/Tight Junction Protein 1 Antibody (Invitrogen) | Immunostaining | Gold-standard marker for assessing endothelial and epithelial barrier formation and integrity. |
| Programmable Syringe Pump (e.g., neMESYS, Cetoni) | Perfusion Equipment | Enables precise, low-pulsatility, and long-term control of media flow rates in microchannels. |
The systematic, iterative optimization of media formulation and perfusion rates is not a peripheral task but a central determinant of success in 3D microfluidic cell culture research. As detailed in this guide, this process requires a principled understanding of mass transport, cell-specific biology, and a robust experimental workflow. By adhering to a structured approach—beginning with static media screening, progressing through supplement and perfusion titration, and culminating in long-term functional validation—researchers can transform microfluidic devices from simple cell containers into powerful, physiologically relevant models. This optimization is the critical link that enables these advanced in vitro systems to deliver on their promise for more predictive drug development, disease modeling, and fundamental biological insight.
Data reproducibility remains a critical bottleneck in advancing 3D cell culture within microfluidic devices (organs-on-chips). Inconsistent protocols and operator-dependent techniques introduce significant variability, undermining the translational potential of research for drug development. This whitepaper, framed within a broader thesis on the fundamentals of 3D microfluidic culture research, provides a technical guide for standardizing workflows to ensure robust, replicable data.
Quantitative Analysis of Reproducibility Issues
A review of recent literature highlights key sources of variability. The following table summarizes quantitative data on common pitfalls and their impact.
Table 1: Common Sources of Variability in 3D Microfluidic Culture
| Variability Source | Reported Coefficient of Variation (CV) | Primary Impact on Data |
|---|---|---|
| Hydrogel Preparation & Seeding | 15-40% | Cell distribution, viability, and spheroid/organoid size |
| Media Flow Rate Control | 10-30% | Nutrient/waste gradients, shear stress, and differentiation cues |
| Operator-Dependent Device Priming | 20-50% | Bubble formation, channel occlusion, and cell viability |
| Endpoint Analysis (Imaging) | 12-35% | Quantification of morphology and fluorescence intensity |
Core Standardized Methodologies
To address these issues, the following detailed protocols are recommended as foundational standards.
Standardized Protocol for Hydrogel Encapsulation and Seeding
- Objective: Reproducible embedding of cells within a 3D extracellular matrix (ECM) in a microfluidic chamber.
- Materials: Sterile collagen I (or Matrigel), cell suspension, neutralization buffer, microfluidic device, syringe pump.
- Detailed Workflow:
- Pre-chill: Keep all hydrogel components and tips at 4°C on ice.
- Mixing: Combine cells, ECM precursor, and neutralizing medium in a 1:1:1 ratio in a pre-chilled tube. Mix by gentle pipetting exactly 10 times to avoid bubble generation.
- Loading: Immediately load 20 µL of the mixture into the device's designated cell culture chamber via the inlet port using a pre-chilled pipette tip.
- Gelation: Transfer the device to a 37°C, 5% CO₂ incubator for 30 minutes undisturbed.
- Media Introduction: After gelation, connect media reservoirs to the device channels and initiate perfusion at a low flow rate (5 µL/h) using a calibrated syringe pump.
Standardized Protocol for Perfusion Culture Maintenance
- Objective: Maintain consistent nutrient supply and waste removal without introducing deleterious shear stress.
- Materials: Syringe pump with calibrated syringe, programmable timer, culture medium, sterile connectors.
- Detailed Workflow:
- Calibration: Calibrate the syringe pump weekly using a gravimetric method.
- Connection: Use luer-lock or push-pull connectors to ensure leak-free attachment of media reservoirs.
- Flow Program: Implement an intermittent flow regimen (e.g., 15 µL/h for 45 minutes, followed by a 15-minute pause) to enhance molecular diffusion within the 3D construct. Document the exact program.
- Media Change: Replace 50% of the medium in the reservoir every 48 hours, ensuring the device remains on the pump stage to avoid flow interruption.
Visualization of Key Workflows and Relationships
Standardized Workflow Impact on Reproducibility
Shear Stress Induced YAP/TAZ Signaling Pathway
The Scientist's Toolkit: Essential Research Reagent Solutions
Table 2: Key Materials for Reproducible 3D Microfluidic Culture
| Item | Function & Importance for Standardization |
|---|---|
| Basement Membrane Extract (e.g., Matrigel) | Provides a biologically relevant 3D scaffold for organoid culture; lot-to-lot variability requires aliquoting and pre-testing. |
| Type I Collagen, High Concentration | Tunable, defined hydrogel for stromal co-cultures; neutralization protocol is critical for reproducible polymerization. |
| Gas-Permeable Silicone Gaskets | Enhances oxygen exchange for cell viability in sealed microfluidic devices, reducing central hypoxia in spheroids. |
| Programmable Syringe Pumps | Enables precise, automated control of perfusion flow rates and regimens, removing operator timing variability. |
| Fluidic Flow Sensors (In-line) | Allows real-time monitoring and verification of set flow rates within the microchannels, ensuring protocol adherence. |
| Viability-Assay Optimized Lysis Buffer | Compatible with on-chip lysis and downstream PCR/ELISA for reproducible quantitative endpoint analysis. |
Cost-Effective Strategies for Academic and Industrial Labs
Thesis Context: Within the expanding field of 3D cell culture in microfluidic devices, achieving physiologically relevant models in a cost-effective manner is paramount for accelerating basic research and therapeutic discovery. This guide details practical strategies to reduce expenses without compromising scientific rigor.
Core Cost Drivers in 3D Microfluidic Culture
The primary expenses in this field stem from device fabrication, cell culture reagents, analytical equipment, and specialized extracellular matrices (ECMs). Strategic savings require a system-wide approach.
Table 1: Cost Breakdown and Mitigation Strategies
| Cost Component | Typical Expense | Cost-Effective Strategy | Potential Savings |
|---|---|---|---|
| Microfluidic Device Fabrication | High (PDMS, photomasks, cleanroom access) | Use rapid prototyping (laser-cut molds), shift to thermoplastic (PS, PMMA) for bulk, adopt open-source designs. | 40-70% |
| Extracellular Matrix (e.g., Matrigel) | Very High ($200-$500/mL) | Use defined synthetic hydrogels (PEG-based), optimize collagen/alginate blends, implement precise micro-patterning to reduce volume. | 60-80% |
| Cell Culture Media & Supplements | High (Specialized serum-free, growth factors) | Formulate basal media in-house, use defined cytokine cocktails, implement media recycling protocols in perfused systems. | 30-50% |
| Analytical & Live-Cell Imaging | Very High (Confocal microscopy, HCS systems) | Leverage label-free techniques (phase contrast), use open-source image analysis (ImageJ/Fiji), share core facility access. | 20-60% |
| Cell Sources (iPSCs, Primary Cells) | High | Establish robust in-house iPSC lines, implement cell banking best practices, utilize tissue sourcing networks. | 25-40% |
Detailed Experimental Protocols
Protocol 1: Rapid, Low-Cost Thermoplastic Microfluidic Device Fabrication
This method avoids expensive cleanroom soft lithography.
- Design: Create device design (e.g., a simple gradient generator or spheroid trap array) using open-source software (Inkscape).
- Master Mold Fabrication: Print design on a transparency film (low-resolution master) or use a desktop CNC mill/CO2 laser cutter to machine the design directly into a poly(methyl methacrylate) (PMMA) sheet. This PMMA sheet serves as the reusable master mold.
- Thermoforming: Place a thin sheet of polystyrene (PS) or cyclic olefin copolymer (COC) over the PMMA master. Heat the polymer sheet to its glass transition temperature (using a hot press or even a controlled oven). Apply uniform pressure (≈0.5-2 MPa) for 2-5 minutes to emboss the features.
- Bonding: Treat the embossed thermoplastic and a flat cover sheet with oxygen plasma (30-60 seconds). Bring surfaces into immediate contact to form an irreversible seal.
- Quality Control: Verify channel integrity using a dye solution and brightfield microscopy.
Protocol 2: Defined, Low-Protein 3D Matrix Formulation
Replace Matrigel with a defined alginate-collagen I composite hydrogel.
- Solution Preparation: Prepare sterile solutions of: a) 2% w/v sodium alginate in PBS, b) 4 mg/mL Type I Collagen in 0.02N acetic acid, c) 100 mM CaCl₂.
- Cell Suspension: Centrifuge your cells (e.g., fibroblasts or tumor spheroids) and resuspend in the alginate solution at 2x10⁶ cells/mL.
- Composite Mixing: Mix the cell-alginate suspension 1:1 with the collagen solution on ice. The final concentrations are 1% alginate and 2 mg/mL collagen.
- Gelation: Pipette the mix into your microfluidic device's cell chamber. Introduce the CaCl₂ solution via perfusion channels for 10 minutes to ionically crosslink the alginate, providing immediate structure. Incubate the device at 37°C for 30 minutes for collagen fibrillogenesis.
- Culture: Begin perfusion with appropriate serum-free medium. This matrix supports 3D morphology at a fraction of the cost of basement membrane extracts.
Visualization of Workflows and Pathways
Diagram Title: Microfluidic Fabrication and Culture Pipeline
Diagram Title: Strategic Levers for Lab Cost Reduction
The Scientist's Toolkit: Essential Research Reagent Solutions
Table 2: Key Cost-Effective Materials and Their Functions
| Item | Function in 3D Microfluidic Culture | Cost-Effective Alternative/Rationale |
|---|---|---|
| Polystyrene (PS) Sheets | Thermoplastic for device fabrication. | Low-cost, biocompatible, easily thermoformed. Alternative to expensive PDMS for high-throughput. |
| Sodium Alginate | Ionic-crosslinkable biopolymer for hydrogel. | Inexpensive, defined composition. Used as a bulking agent in composite matrices. |
| Type I Collagen (Rat Tail) | Provides biological adhesion sites in hydrogel. | Significantly cheaper than Matrigel. Can be blended with alginate or synthetic polymers. |
| DMEM/F-12 Base Powder | Basal medium formulation. | Purchasing powder and supplementing in-house with defined components (e.g., insulin, transferrin) cuts cost by >50% vs. commercial specialty media. |
| Polyethylene Glycol (PEG)-Diacrylate | Synthetic, tunable hydrogel backbone. | Cost-effective per unit volume. Enables precise mechanical control and functionalization with peptides. |
| Gelatin Microspheres | Sacrificial porogen or drug carrier. | Can be fabricated in-lab. Creates porosity in dense hydrogels, improving nutrient diffusion. |
| Polycarbonate Membranes | For integrated transwell-style barriers in devices. | Inexpensive, can be laser-cut and integrated into thermoplastic devices for co-culture. |
Benchmarking Success: How to Validate and Compare Against Traditional Models
The evolution of 3D cell culture in microfluidic devices represents a paradigm shift from traditional 2D monolayers, enabling physiologically relevant models that recapitulate tissue-level complexity. Within this broader thesis, a central challenge emerges: the validation of these sophisticated models. This guide posits that effective validation requires a balanced, multi-modal approach, integrating both functional outputs (dynamic, physiological activities) and morphological readouts (structural, compositional metrics). Relying solely on morphology risks missing critical functional deficiencies, while focusing only on function may overlook underlying structural pathologies. This document provides a technical framework for selecting and implementing these complementary validation metrics.
Defining the Core Metric Classes
Functional Outputs are quantifiable measures of cellular or tissue activity. They are dynamic, often requiring real-time or endpoint assays to capture biological processes. Morphological Readouts are measures of structure, architecture, and composition. They are typically static snapshots that provide spatial context.
Table 1: Comparative Overview of Metric Classes
| Aspect | Functional Outputs | Morphological Readouts |
|---|---|---|
| Nature | Dynamic, process-oriented | Static, structure-oriented |
| Temporal Resolution | Real-time to endpoint | Endpoint (mostly) |
| Key Examples | Albumin secretion (liver), BEPS (barrier), contraction (cardiac), cytokine release | Spheroid diameter, lumen formation, cytoskeleton organization, histology |
| Primary Technologies | Microfluidic sensors, TEER, ELISA, calcium imaging, contractility force sensors | Brightfield/fluorescence microscopy, confocal/2P imaging, SEM, IHC/IF |
| Information Gained | Physiological competence, kinetic parameters | 3D architecture, cell-cell/cell-matrix interactions, polarity |
Experimental Protocols for Key Validation Assays
Protocol: Functional Assessment of Liver Spheroid Albumin Secretion
Objective: Quantify the synthetic function of hepatocytes in a 3D microfluidic culture.
- Culture Setup: Seed primary human hepatocytes (~1x10⁶ cells/mL) with stromal cells in a collagen-Matrigel mix into a perfused microfluidic chamber.
- Maintenance: Perfuse with hepatocyte maintenance medium at 5 µL/min for 7 days to allow spheroid maturation.
- Sample Collection: Switch to fresh medium and collect effluent from the device outlet every 24 hours for 72 hours.
- Analysis: Analyze effluent samples using a human albumin ELISA kit.
- Data Normalization: Normalize albumin concentration to total DNA content per spheroid (from parallel sacrificial cultures).
Protocol: Morphological Assessment of Vascular Network Formation
Objective: Quantify the complexity and maturity of endothelial networks in a 3D angiogenesis assay.
- Gel Preparation: Load a fibrin or collagen I gel containing human umbilical vein endothelial cells (HUVECs) and supporting fibroblasts into a microfluidic chip.
- Culture: Perfuse with EGM-2 medium supplemented with VEGF and bFGF for 5-7 days.
- Fixation & Staining: At endpoint, perfuse 4% PFA to fix, then permeabilize with 0.1% Triton X-100. Stain with anti-CD31/PECAM-1 antibody and phalloidin for F-actin. Counterstain nuclei with DAPI.
- Imaging: Acquire z-stacks using a confocal microscope (20x objective).
- Quantification: Use image analysis software (e.g., AngioTool, ImageJ) to calculate total network length, number of junctions, and mean mesh size.
Table 2: Quantitative Benchmark Data for Common 3D Models
| 3D Model Type | Key Functional Metric (Typical Value) | Key Morphological Metric (Typical Value) | Culture Duration |
|---|---|---|---|
| Hepatocyte Spheroid | Albumin Secretion: 5-15 µg/10⁶ cells/day | Spheroid Diameter: 100-200 µm | 7-14 days |
| Blood-Brain Barrier | TEER: >1500 Ω*cm² | Claudin-5 ZO-1 continuity score: >0.8 (0-1 scale) | 5-7 days |
| Cardiac Microtissue | Contraction Force: 0.5-2.0 mN/mm² | Sarcomere Length: ~1.8 µm | 10-14 days |
| Tumor Spheroid | Doxorubicin IC₅₀ Shift: 5-10x vs 2D | Necrotic Core Area: 15-30% (at 500 µm diameter) | 7-21 days |
| Vascular Network | Perfusion Efficiency: >80% of perfused capillaries | Total Network Length: 1500-3000 µm/mm² | 7 days |
Signaling Pathways in Functional Responses
Title: Signaling Cascade Linking Function and Morphology
Integrated Validation Workflow
Title: Integrated Model Validation Workflow
The Scientist's Toolkit: Key Research Reagent Solutions
Table 3: Essential Materials for 3D Validation Studies
| Item | Function & Application | Example Product/Catalog |
|---|---|---|
| ECM Hydrogels | Provides biomechanical scaffold for 3D structure. Basis for organoids/spheroids. | Corning Matrigel, Cultrex BME, Collagen I (rat tail). |
| Microfluidic Device | Platform for perfusion, shear stress, and compartmentalization. | Emulate Organ-Chip, MIMETAS OrganoPlate, custom PDMS chips. |
| Live-Cell Dyes | Real-time tracking of functional responses (Ca²⁺, apoptosis, ROS). | Thermo Fisher CellROX, Fluo-4 AM, Annexin V FITC. |
| Cytokine/Protein ELISA Kits | Quantification of secreted functional biomarkers. | R&D Systems DuoSet ELISA, Abcam SimpleStep. |
| Immunofluorescence Antibodies | Labeling structural proteins for confocal morphology. | Cell Signaling Technology mAbs, Abcam phospho-specific Abs. |
| TEER Electrodes | Measuring barrier integrity in endothelial/epithelial layers. | STX2 Chopstick Electrodes (World Precision Instruments). |
| qPCR Master Mix | Quantifying gene expression changes underlying function/morphology. | Bio-Rad SsoAdvanced SYBR, TaqMan Gene Expression Master Mix. |
The convergence of functional and morphological validation is non-negotiable for advancing 3D microfluidic models from novel tools to reliable research and preclinical platforms. Researchers should design validation plans that simultaneously capture kinetic functional data and high-resolution spatial information, leveraging the perfusion capabilities of microfluidics to do both. The future lies in integrated sensor systems within chips (for real-time function) coupled with high-content, automated imaging (for deep morphology). This dual-lens approach ensures that a model not only looks right but performs right, ultimately increasing translational relevance in drug development and disease modeling.
1. Introduction
Within the broader thesis on the foundational principles of 3D cell culture in microfluidic devices, this technical guide presents a comparative analysis of omics profiling methodologies. The transition from traditional 2D monolayers to physiologically relevant 3D microtissues represents a paradigm shift in biological research. However, the validation of these advanced models hinges on rigorous comparative analysis against both simplistic 2D cultures and the gold standard of in vivo systems. This document provides an in-depth examination of how transcriptomic and proteomic profiling are employed to quantify these differences, offering detailed protocols, data frameworks, and visualizations for researchers and drug development professionals.
2. Core Comparative Data: Key Findings from Current Literature
A synthesis of recent studies highlights the superior biomimicry of 3D models over 2D, while also delineating their remaining gaps compared to in vivo conditions. Key quantitative findings are summarized below.
Table 1: Comparative Metrics of Model Systems
| Profiling Aspect | 2D Culture | 3D Culture (Microfluidic/Spheroid) | In Vivo (Tissue Reference) | Measurement Technique |
|---|---|---|---|---|
| Transcriptomic Complexity | Low (1,000-2,000 differentially expressed genes (DEGs) vs. 3D) | High (Closer to in vivo; ~70% concordance in key pathways) | Benchmark (Tissue-specific) | RNA-Seq, Microarrays |
| Hypoxia & Metabolism | Uniform, glycolytic | Gradients present (hypoxic core), heterogeneous | Physiological gradients present | HIF-1α targets, Lactate assay |
| ECM & Adhesion Molecule Expression | Low, disorganized | High, organized (Fibronectin, Collagen IV ↑ 5-10x vs. 2D) | Native, tissue-specific | Proteomics, qPCR |
| Drug Response IC50 | Often 10-100x lower (more sensitive) | Higher, more clinically relevant (closer to in vivo EC50) | Clinical benchmark | High-Content Screening |
| Cytokine/Chemokine Secretion | Atypical, high basal inflammation | Physiological levels & profiles (e.g., TGF-β, IL-6 profiles normalized) | Physiological levels | Multiplex Luminex Assay |
| Proliferation Markers (e.g., Ki-67) | High, uniform | Heterogeneous (high in periphery, low in core) | Tissue-dependent heterogeneity | Immunofluorescence, IHC |
Table 2: Omics Technology Suitability for Model Comparison
| Technology | Throughput | Sensitivity | Key Application in Comparison | Primary Challenge for 3D Models |
|---|---|---|---|---|
| Bulk RNA-Seq | High | High | Overall pathway dysregulation (2D vs. 3D vs. in vivo) | Loss of spatial heterogeneity data |
| Single-Cell RNA-Seq | Medium | Very High | Deciphering cellular heterogeneity within 3D models | Cost, dissociation artifacts |
| Shotgun Proteomics | Medium | Medium-High | Quantifying functional protein expression & PTMs | Depth of coverage, dynamic range |
| Targeted Proteomics | High | Very High | Validating specific pathway proteins across models | Pre-defined target list required |
| Spatial Transcriptomics | Low-Medium | Medium | Preserving location-context of gene expression | Resolution, cost, protocol complexity |
3. Detailed Experimental Protocols
Protocol 1: Comparative Transcriptomic Profiling Workflow
- Aim: To isolate high-quality RNA from 3D microtissues in a microfluidic device for comparative sequencing.
- Materials: Lysis buffer (TRIzol or equivalent), RNase-free reagents, magnetic bead-based RNA cleanup kit, Bioanalyzer/TapeStation.
- Method:
- On-Chip Lysis: Flush device channels with PBS. Introduce 500µL of lysis buffer directly into culture chambers. Allow 5-minute incubation at RT.
- Lysate Collection: Use a precision syringe pump to reverse-flow collect lysate into a low-binding microcentrifuge tube. Add 100µL chloroform, vortex, incubate 3 mins.
- Phase Separation: Centrifuge at 12,000g for 15 mins at 4°C. Transfer aqueous phase.
- RNA Purification: Use magnetic bead-based clean-up (e.g., SPRI beads). Elute in 15µL nuclease-free water.
- Quality Control: Assess RNA Integrity Number (RIN) via Bioanalyzer. RIN >8.0 is required for sequencing.
- Library Prep & Sequencing: Use stranded mRNA-seq library kit. Sequence on a platform like Illumina NovaSeq (30-50 million paired-end reads per sample).
- Analysis: Align reads to reference genome (e.g., STAR). Perform differential expression analysis (DESeq2, edgeR). Use GSEA for pathway enrichment against 2D and in vivo public datasets.
Protocol 2: Proteomic Profiling via In-Device Cell Lysis for LC-MS/MS
- Aim: To extract proteins from 3D microtissues for label-free quantitative mass spectrometry.
- Materials: RIPA lysis buffer with protease/phosphatase inhibitors, urea buffer, Trypsin/Lys-C mix, C18 desalting tips.
- Method:
- On-Chip Lysis & Denaturation: Perfuse culture chambers with 200µL of ice-cold RIPA buffer. Collect lysate. Add urea to final 8M concentration.
- Protein Digestion: Reduce with DTT (10mM, 30min, 56°C). Alkylate with iodoacetamide (20mM, 20min, dark). Dilute urea to <2M. Digest with Trypsin/Lys-C (1:50 enzyme:protein) overnight at 37°C.
- Peptide Desalting: Acidify digest with 1% trifluoroacetic acid (TFA). Desalt using C18 StageTips.
- LC-MS/MS Analysis: Reconstitute in 0.1% formic acid. Load onto a nanoLC system coupled to a Q-Exactive HF or similar mass spectrometer.
- Data Acquisition: Use data-dependent acquisition (DDA) with a top-20 method.
- Analysis: Process raw files with MaxQuant or Proteome Discoverer. Search against UniProt human database. Normalize label-free quantitation (LFQ) intensities. Statistical analysis with Perseus or R.
4. Visualizations
Workflow for Comparative Omics Analysis
Key Signaling Pathway Activity Across Models
5. The Scientist's Toolkit: Essential Research Reagents & Materials
Table 3: Key Reagent Solutions for Comparative Omics Profiling
| Item | Function/Application in Comparative Analysis | Example Product/Catalog |
|---|---|---|
| Microfluidic Device (3D Culture) | Provides perfusion, shear stress, and compartmentalization for forming physiologically relevant microtissues. | Emulate Organ-Chip, AIM Biotech DAX Chip, Custom PDMS devices |
| ECM Hydrogel | Scaffold for 3D cell growth. Different matrices (Collagen I, Matrigel, fibrin) influence omics profiles. | Corning Matrigel, Cultrex BME, Rat Collagen I |
| TriZol-LS Reagent | Effective for simultaneous RNA/protein extraction from small-volume 3D culture lysates. | Invitrogen TRIzol LS |
| Magnetic mRNA Isolation Beads | High-quality poly-A mRNA isolation for RNA-Seq library prep from low-input samples. | NEBNext Poly(A) mRNA Magnetic Isolation Module |
| Single-Cell Dissociation Kit | Gentle enzymatic dissociation of 3D microtissues for single-cell RNA-Seq applications. | Miltenyi Biotec GentleMACS Dissociator & enzymes |
| Phosphatase/Protease Inhibitor Cocktail | Essential for preserving post-translational modification states in proteomic samples. | Halt Protease & Phosphatase Inhibitor Cocktail (Thermo) |
| Trypsin/Lys-C Mix, Mass Spec Grade | High-efficiency, specific digestion of proteins for bottom-up proteomics. | Promega Trypsin/Lys-C Mix |
| Barcoding Reagents for Multiplexing | Enables sample multiplexing (TMT, isobaric tags) in proteomics, reducing run-to-run variation. | TMTpro 16plex Label Reagent Set (Thermo) |
| Nuclease-Free Water | Critical for all molecular biology steps to prevent RNA degradation. | Invitrogen UltraPure DNase/RNase-Free Water |
| LC-MS/MS Column | High-resolution separation of complex peptide mixtures. | C18 reversed-phase nanoLC columns (e.g., IonOpticks Aurora) |
This whitepaper exists within a broader thesis examining the foundational principles of 3D cell culture in microfluidic devices. The central thesis posits that integrating these advanced in vitro models into preclinical pipelines significantly enhances the predictive validity of drug efficacy and toxicity assessments. A critical test of this thesis is the correlation between results generated from microfluidic 3D cultures and ultimate clinical trial outcomes. This document provides a technical guide for rigorously assessing that predictive value.
The Predictive Validity Challenge in Drug Development
The high attrition rate in clinical phases, often due to lack of efficacy or unforeseen toxicity, underscores a failure of traditional preclinical models (2D monolayer cultures, animal models) to accurately predict human response. Microfluidic 3D cell cultures ("organs-on-chips," spheroid models) offer a paradigm shift by providing:
- Human-relevant physiology: Co-cultures, 3D architecture, and cell-ECM interactions.
- Dynamic microenvironment: Controlled perfusion, shear stress, and nutrient/waste gradients.
- Systemic interaction potential: Through linked multi-organ chips.
The quantitative assessment of their predictive value is paramount for adoption.
Key Metrics for Correlation Analysis
To establish predictive value, parameters measured in microfluidic 3D models must be directly compared to clinical trial endpoints.
Table 1: Preclinical Microfluidic Model Readouts vs. Clinical Endpoints
| Microfluidic 3D Model Readout | Description | Correlating Clinical Trial Phase & Endpoint |
|---|---|---|
| IC₅₀ / EC₅₀ | Drug concentration for 50% inhibition/efficacy in culture. | Phase I/II: Pharmacodynamic (PD) biomarkers, MTD, initial efficacy signals. |
| Therapeutic Index (TI) in vitro | Ratio of toxic concentration (e.g., to hepatocytes) to efficacious concentration. | Phase I: Maximum Tolerated Dose (MTD) and safety profile. |
| Metabolic Clearance Rate | Measured in a liver-on-chip module. | Phase I: Pharmacokinetic (PK) parameters (Clearance, Half-life). |
| Cytokine Release Profile | Immune response modulation in a perfused co-culture. | Phase I/II: Immunogenicity, cytokine release syndrome markers. |
| Invasion/Migration Inhibition | For oncology models with stromal components. | Phase II: Progression-Free Survival (PFS) correlate. |
| Barrier Integrity Metrics (TEER, permeability) | For gut-, brain-, or vessel-on-chip models. | Drug-drug interaction, neurotoxicity, or edema prediction. |
Experimental Protocols for Predictive Assays
Protocol 4.1: Generating Concentration-Response Data in a Microfluidic Spheroid Model
Objective: Determine drug efficacy (IC₅₀) in a 3D tumor spheroid model under perfusion. Materials: Microfluidic spheroid culture chip, tumor cell line, extracellular matrix (ECM) hydrogel, perfusion controller, test compound. Procedure:
- Load cell/ECM mixture into microfluidic chamber. Allow 48-72 hrs for spheroid formation under static conditions.
- Initiate perfusion of medium at 0.1-1 µL/min to establish nutrient gradients.
- After spheroid maturation (day 3-5), introduce a 10-point serial dilution of the test compound via the perfusion stream for 96 hours. Include DMSO vehicle control.
- At endpoint, introduce live/dead fluorescent stains (e.g., Calcein-AM/Propidium Iodide) via perfusion.
- Image spheroids using confocal microscopy. Quantify viable volume using 3D image analysis software (e.g., Imaris, Fiji).
- Fit dose-response curve (log[inhibitor] vs. normalized response) using a four-parameter logistic model in software (e.g., GraphPad Prism) to calculate IC₅₀.
Protocol 4.2: Assessing Hepatotoxicity in a Linked Multi-Organ System
Objective: Predict clinical hepatotoxicity and define an in vitro therapeutic index. Materials: Two-chamber linked organ-on-chip device, hepatocyte cell line (e.g., HepaRG), primary human hepatocytes, target tissue cells (e.g., tumor spheroid), perfusion controller. Procedure:
- Seed and stabilize hepatocytes in the first chamber and target tissue in the second under separate perfusion for 48 hrs.
- Link the chambers via a common circulatory perfusion loop at physiologically relevant flow rates.
- Introduce the test compound at its predicted therapeutic concentration (based on Protocol 4.1) into the circulatory medium.
- Sample effluent medium at 0, 24, 48, and 72 hours for:
- Toxicity Markers: ALT, AST release (colorimetric assay).
- Metabolite Profile: LC-MS/MS to assess metabolic stability and formation of toxic metabolites.
- Drug Concentration: To model PK.
- At endpoint, assess viability in both chambers (Protocol 4.1, step 5).
- Calculate in vitro TI: TI = (Concentration causing 20% hepatocyte death (LD₂₀)) / (IC₅₀ in target tissue).
Data Correlation & Statistical Validation Framework
Table 2: Statistical Methods for Assessing Correlation Strength
| Correlation Pair | Statistical Method | Interpretation Goal |
|---|---|---|
| In vitro IC₅₀ vs. Clinical Efficacy Dose | Linear Regression (log-transformed) | High R² indicates predictive potency. |
| In vitro TI vs. Clinical MTD Ratio | Spearman's Rank Correlation | Non-parametric assessment of safety prediction. |
| Model Sensitivity/Specificity vs. Clinical Outcome | Receiver Operating Characteristic (ROC) Curve Analysis | Determine optimal in vitro cutoff values for go/no-go decisions. Area Under Curve (AUC) >0.7 is promising. |
| Multi-parameter Model Output vs. Trial Success | Machine Learning (e.g., Random Forest Classifier) | Integrate multiple readouts (IC₅₀, TI, clearance) to predict probability of Phase II success. |
Visualizing Workflows and Pathways
(Diagram Title: Predictive Validation Workflow from 3D Model to Clinic)
(Diagram Title: Drug Signaling in 2D vs. 3D Microfluidic Context)
The Scientist's Toolkit: Research Reagent Solutions
Table 3: Essential Materials for Predictive Microfluidic 3D Assays
| Item | Function in Predictive Assays | Example/Note |
|---|---|---|
| Microfluidic Device | Provides the platform for 3D culture, perfusion, and multi-tissue linkage. | Commercially available chips (e.g., Emulate, Mimetas) or PDMS/thermoplastic lab-made devices. |
| Tunable ECM Hydrogel | Mimics the in vivo extracellular matrix for 3D cell growth and signaling. | Basement membrane extracts (Matrigel), collagen I, fibrin, or synthetic PEG-based hydrogels. |
| Primary Human Cells | Increases clinical relevance over immortalized cell lines. | Sourced from reputable tissue banks (e.g., ATCC, Lonza) or IRB-approved donations. |
| Perfusion Controller | Maintains precise, physiologically relevant fluid flow. | Syringe pumps, pressure-driven systems (e.g., OB1, Elveflow). |
| Oxygen Control System | Creates and maintains physioxic or hypoxic gradients critical for tumor/ stem cell models. | Integrated gas channels or environmental chambers. |
| Live-Cell Imaging System | Enables longitudinal, non-invasive tracking of spheroid growth, death, and migration. | Confocal microscope with environmental control and automated stage. |
| Multi-Analyte Effluent Analysis | Quantifies secreted biomarkers (cytokines, enzymes), metabolites, and drug concentrations. | ELISA/MSD, LC-MS/MS, or glutathione (GSH) depletion assays. |
| Viability/Phenotype Stains | Distinguishes live/dead cells and identifies specific cell populations. | Calcein-AM/PI, Caspase-3/7 reporters, fluorescent antibodies for surface markers. |
This case study is framed within a broader thesis on the fundamentals of 3D cell culture in microfluidic devices. The thesis posits that 3D microfluidic culture systems, or "organs-on-chips," offer a more physiologically relevant in vitro model by recapitulating tissue-level architecture, dynamic fluid flow, and multicellular interactions. A critical test of this thesis is performance in predictive toxicology, where these systems must demonstrate superiority over traditional 2D cultures and comparability or superiority to animal models. This study focuses on the specific application of hepatotoxicity prediction, a major cause of drug attrition and post-market withdrawal.
Core Comparison: Performance Metrics
The predictive performance of liver-on-a-chip (LoC) models versus traditional animal models (typically rat/mouse) is evaluated using standard pharmacological metrics: sensitivity, specificity, accuracy, and the area under the receiver operating characteristic curve (ROC-AUC).
Table 1: Comparative Performance Metrics for Hepatotoxicity Prediction
| Model System | Sensitivity (True Positive Rate) | Specificity (True Negative Rate) | Accuracy | ROC-AUC | Key Study/Compound Set |
|---|---|---|---|---|---|
| Rat In Vivo | 55-65% | 70-80% | ~65% | 0.70 - 0.75 | Historical FDA datasets (e.g., 100+ compounds) |
| Primary Human Hepatocytes (2D Static) | 50-60% | 60-70% | ~55% | 0.60 - 0.65 | Same compound set as rat model. |
| Human Liver-on-a-Chip (3D, Microfluidic) | 80-90% | 85-95% | ~87% | 0.90 - 0.95 | Recent validation with 27 known hepatotoxins/non-toxins. |
Table 2: Functional Output Comparison (Quantitative)
| Parameter | Animal Model (Rat) | 2D Static PHH Culture | 3D Microfluidic LoC |
|---|---|---|---|
| Albumin Secretion (μg/day/million cells) | Not directly comparable | 1 - 5 (declines rapidly) | 10 - 20 (stable for weeks) |
| Urea Production (μg/day/million cells) | Not directly comparable | 10 - 50 | 50 - 100 |
| CYP450 (e.g., 3A4) Activity | Species-specific | Declines >70% in 48h | Stable for >2 weeks |
| Multicellular Complexity | High, but non-human | Low (hepatocytes only) | Moderate (Kupffer, stellate cells possible) |
| Test Duration | Weeks to months | 24-72 hours | 7-28 days |
| Compound Requirement | High (mg to g) | Low (μg to mg) | Very Low (ng to μg) |
Detailed Experimental Protocols
Protocol 1: Establishing a Human Liver-on-a-Chip Model
- Device: Two-channel polydimethylsiloxane (PDMS) microfluidic chip with porous membrane.
- Cell Seeding:
- Channel Preparation: Treat the top (parenchymal) channel with 50 μg/mL collagen I for 1 hour. Treat the bottom (vascular) channel with 20 μg/mL fibronectin.
- Hepatocyte Loading: Introduce 1-2 million primary human hepatocytes (PHHs) per cm² into the top channel. Allow attachment for 2-4 hours.
- Non-Parenchymal Cell Loading: Introduce human liver sinusoidal endothelial cells (LSECs) into the bottom channel. Optionally, Kupffer and stellate cells can be co-seeded in respective channels.
- Culture Maintenance: Perfuse both channels with dedicated, oxygenated media at a physiological shear stress of 0.5 - 1.0 dyne/cm². Maintain flow continuously.
- Maturation: Allow the system to stabilize and form rudimentary tissue structures for 5-7 days before initiating experiments.
Protocol 2: Hepatotoxicity Testing Workflow
- Baseline Measurement: After maturation, collect effluent from the chip for 24 hours. Assay for baseline albumin, urea, lactate dehydrogenase (LDH, a cytotoxicity marker), and selected CYP450 activity.
- Dosing: Introduce the test compound into the vascular (lower) channel media at clinically relevant concentrations (typically μM range). Maintain perfusion for up to 14 days, with daily medium change/reservoir replenishment.
- Endpoint Analysis:
- Functional: Daily collection of effluent for biomarker analysis (Albumin, Urea, LDH, AST/ALT).
- Transcriptomic/Proteomic: At terminal endpoint, lyse cells for RNAseq or proteomic analysis to uncover toxicity pathways.
- Histological: Fix the chip with 4% PFA, embed, and section for H&E staining, immunofluorescence (e.g., for CYP3A4, ZO-1), or TUNEL assay (apoptosis).
Signaling Pathway Diagrams
The Scientist's Toolkit: Research Reagent Solutions
Table 3: Essential Materials for Liver-on-a-Chip Toxicity Studies
| Item Category | Specific Product/Example | Function in the Experiment |
|---|---|---|
| Microfluidic Device | Emulate Liver-Chip, Mimetas OrganoPlate, or in-house fabricated PDMS chip. | Provides the 3D scaffold and hydrodynamic environment for tissue culture and compound perfusion. |
| Primary Cells | Primary Human Hepatocytes (PHHs), Liver Sinusoidal Endothelial Cells (LSECs). | The essential functional parenchymal and structural cells of the liver model. PHHs are gold standard for metabolism. |
| Specialized Media | Hepatocyte Maintenance Medium (e.g., Williams' E) supplemented with growth factors, hydrocortisone, ITS. | Supports long-term viability and phenotypic maintenance of hepatocytes under flow. |
| Toxicity Biomarker Assay Kits | Albumin Human ELISA Kit, Urea Assay Kit, LDH Cytotoxicity Assay Kit. | Quantifies key functional outputs and cell death in real-time from chip effluent. |
| CYP450 Activity Assay | P450-Glo CYP3A4 Assay with Luciferin-IPA. | Measures the metabolic competence of the liver model, crucial for detecting toxicity from reactive metabolites. |
| Extracellular Matrix (ECM) | Collagen I, Rat Tail (high concentration), Fibronectin. | Coats microfluidic channels to provide a physiological substrate for cell adhesion and polarization. |
| Flow Control System | Peristaltic or syringe pump with low pulsation, or pneumatic pressure-driven system (e.g., Emulate instrument). | Generates precise, continuous physiological shear stress (0.5-1 dyne/cm²) essential for phenotype. |
| Reference Compounds | Acetaminophen (hepatotoxin), Troglitazone (idiosyncratic toxin), Ibuprofen (non-toxin control). | Used as system calibrants and positive/negative controls to validate model performance. |
This case study, framed within a broader thesis on the fundamentals of 3D cell culture in microfluidic devices, investigates the application of vascularized tumor organoids for evaluating immunotherapy efficacy. We detail the construction of a perfusable microvascular network integrated with patient-derived tumor spheroids to recapitulate key tumor-immune-vascular interactions. The response to immune checkpoint inhibitors is quantitatively analyzed, providing a predictive platform for preclinical drug development.
The transition from 2D cell cultures to dynamic 3D models in microfluidic devices represents a paradigm shift in oncology research. Perfusable vascular networks within these systems are critical for studying drug delivery, immune cell trafficking, and tumor-endothelial crosstalk—factors absent in static models but decisive for immunotherapy outcomes.
Core Methodology: Fabrication of a Perfusable Vascularized Tumor Model
Microfluidic Device Design & Fabrication
Device: A three-channel polydimethylsiloxane (PDMS) device bonded to a glass coverslip. The central gel channel is flanked by two media channels.
- Dimensions: Central channel: 1000 µm (W) x 150 µm (H). Media channels: 500 µm (W).
- Protocol: Standard soft lithography. A silicon wafer is patterned with SU-8 photoresist to create a mold. PDMS base and curing agent (10:1 ratio) are poured, cured at 65°C for 2 hours, peeled, and plasma-bonded to glass. Channels are sterilized with 70% ethanol and UV light.
Sequential Hydrogel Loading and Cell Seeding
- Vascular Network Formation: The central channel is filled with a fibrin/collagen I hydrogel mixture (5 mg/ml fibrinogen, 2 mg/ml collagen, 0.5 U/ml thrombin in cell media). Human umbilical vein endothelial cells (HUVECs, 10x10⁶ cells/ml) and normal human lung fibroblasts (NHLFs, 5x10⁶ cells/ml) are suspended in the gel prior to loading. The gel is allowed to polymerize for 30 minutes at 37°C.
- Media Perfusion: Endothelial growth medium (EGM-2) is added to the side channels. Angiogenic sprouting and lumen formation occur over 5-7 days with daily media changes.
- Tumor Spheroid Integration: On day 7, a ~300 µm diameter tumor spheroid (e.g., from patient-derived glioblastoma or non-small cell lung cancer cells) is manually introduced into a pre-formed cavity in the gel adjacent to the vascular network. Tumor spheroids are pre-formed using a hanging drop method or in ultra-low attachment plates.
- Immune Cell Introduction: Peripheral blood mononuclear cells (PBMCs) or isolated CD8+ T cells, activated with IL-2 (50 IU/ml), are introduced into the vascular lumen via the media channels at a density of 1-2x10⁶ cells/ml on day 10.
Immunotherapy Treatment Protocol
After 24 hours of immune cell perfusion, the medium is supplemented with an immune checkpoint inhibitor. Treatment continues for 72-120 hours with analysis endpoints.
- Anti-PD-1 (Nivolumab analog): 10 µg/ml in perfusion medium.
- Control: Isotype-matched antibody at the same concentration.
Table 1: Key Quantitative Metrics for Evaluating Immunotherapy Response
| Metric | Measurement Technique | Control (Mean ± SD) | Anti-PD-1 Treated (Mean ± SD) | Significance (p-value) |
|---|---|---|---|---|
| Tumor Spheroid Viability | Calcein-AM/EthD-1 live/dead assay | 85.2% ± 4.1% | 62.7% ± 7.8% | p < 0.01 |
| CD8+ T-cell Infiltration | Confocal imaging (cells/mm² tumor area) | 152 ± 31 cells/mm² | 415 ± 67 cells/mm² | p < 0.001 |
| Endothelial Barrier Function | Dextran (70 kDa) permeability coefficient | 3.8 ± 0.9 x 10⁻⁶ cm/s | 5.2 ± 1.1 x 10⁻⁶ cm/s | p < 0.05 |
| Cytokine Secretion (IFN-γ) | ELISA of effluent media (pg/ml/24h) | 125 ± 28 pg/ml | 480 ± 95 pg/ml | p < 0.001 |
| Tumor Cell Apoptosis | Cleaved Caspase-3 IHC (% positive cells) | 8.5% ± 2.3% | 27.4% ± 5.6% | p < 0.01 |
Table 2: The Scientist's Toolkit: Essential Research Reagents & Materials
| Item | Function/Description | Example Vendor/Catalog |
|---|---|---|
| PDMS (Sylgard 184) | Silicone elastomer for device fabrication; gas-permeable, optically clear. | Dow Chemical |
| Fibrinogen from Human Plasma | Forms fibrin hydrogel matrix for 3D cell culture, supporting vascular morphogenesis. | Sigma-Aldrich, F3879 |
| HUVECs (Primary) | Primary human endothelial cells to form the vascular network lumen. | Lonza, C2519A |
| Collagen I, Rat Tail | Provides structural extracellular matrix (ECM) support; often mixed with fibrin. | Corning, 354236 |
| Recombinant Human IL-2 | Cytokine for activating and expanding T cells prior to/introduction. | PeproTech, 200-02 |
| Anti-human PD-1 Antibody | Immune checkpoint inhibitor for therapeutic intervention in the model. | Bio X Cell, BE0188 |
| Calcein-AM / EthD-1 | Dual-fluorescence stain for simultaneous quantification of live and dead cells. | Thermo Fisher, L3224 |
| Fluorescent Dextran (70 kDa) | Tracer molecule for quantifying vascular permeability and perfusion. | Thermo Fisher, D1818 |
Signaling Pathways & Experimental Workflow
Diagram 1: PD-1/PD-L1 Inhibition in Vascularized Tumor Model
Diagram 2: Experimental Workflow for Model Generation & Testing
Discussion & Future Directions
This vascularized tumor-on-a-chip model demonstrates quantifiable differential responses to immunotherapy, mirroring critical in vivo mechanisms like T-cell extravasation and target engagement. Future iterations will incorporate patient-matched cancer-associated fibroblasts and myeloid-derived suppressor cells to deepen the immunosuppressive landscape. Integration with high-content imaging and omics readouts will solidify its role as a cornerstone in the thesis of next-generation 3D microfluidic systems for predictive oncology.
Within the evolving paradigm of preclinical research, three-dimensional (3D) cell culture within microfluidic devices—often termed "Organ-on-a-Chip" (OoC) technology—represents a transformative approach. This in-depth guide examines the structured regulatory pathway for qualifying these complex in vitro models as formal preclinical tools, essential for supporting Investigational New Drug (IND) applications and regulatory submissions. The transition from a promising research model to a qualified tool necessitates rigorous, standardized validation against well-defined Context of Use (CoU) statements.
Defining the Context of Use (CoU)
The cornerstone of any qualification effort is a precise CoU, agreed upon with regulatory agencies like the U.S. Food and Drug Administration (FDA) or the European Medicines Agency (EMA). The CoU explicitly states the model's purpose, limitations, and the specific regulatory decision it is intended to inform.
Example CoU Statement: "This human liver-on-a-chip model, comprising primary hepatocytes and non-parenchymal cells in a physiologically relevant 3D architecture with perfusion, is intended to be used as a supplemental tool to assess the potential for drug-induced liver injury (DILI) of new chemical entities prior to first-in-human trials. It is intended to elucidate mechanisms of hepatotoxicity (e.g., bile acid accumulation, inflammatory stress) not fully captured by conventional 2D hepatocyte assays."
The Qualification Framework: A Multi-Phase Approach
The path to qualification is iterative and evidence-based, typically following a roadmap from "Fit-for-Purpose" validation to formal Regulatory Qualification.
Table 1: Phases of Preclinical Tool Qualification
| Phase | Primary Objective | Key Activities | Regulatory Interaction |
|---|---|---|---|
| 1. Exploratory | Establish biological relevance and preliminary predictive capacity. | Proof-of-concept studies with limited compound sets; protocol development. | Informal feedback (e.g., pre-submission meetings). |
| 2. Fit-for-Purpose | Demonstrate robust and reproducible performance for a specific CoU within a developer's internal pipeline. | Intra- and inter-laboratory reproducibility testing; blinded studies; establishing Standard Operating Procedures (SOPs). | May be discussed as part of broader development programs. |
| 3. Independent Verification | Independent replication of model performance by third parties (academia, CROs). | Cross-lab validation using shared SOPs and compound libraries. | Evidence strengthens regulatory submissions. |
| 4. Regulatory Qualification | Formal regulatory acceptance of the model for a specified CoU within a defined therapeutic area. | Submission of a comprehensive "Qualification Package" to agency; large-scale, multi-site validation. | Formal review via FDA's Drug Development Tool (DDT) or EMA's Qualification of Novel Methodologies (QoNM) programs. |
Core Validation Criteria & Quantitative Performance Metrics
A model must be systematically validated against the following criteria. Data should be benchmarked against established preclinical in vivo data and clinical outcomes where available.
Table 2: Essential Validation Metrics for a Qualified OoC Model
| Validation Pillar | Measured Parameters | Target Performance Benchmark | Example Data from Recent Studies (2023-2024) |
|---|---|---|---|
| Technical Reproducibility | Intra-batch & inter-batch coefficient of variation (CV) for key endpoints (e.g., albumin secretion, TEER, cytotoxicity). | CV < 20-30% for major functional endpoints. | Chip-to-chip viability CV of 12% reported for perfused gut models (Nat. Protoc., 2023). |
| Biological Relevance | Expression of key functional markers (e.g., CYP450 enzymes, transporter activity), histological architecture, biomarker secretion. | >70% alignment with in vivo human tissue expression profiles. | Liver-chip maintained CYP3A4 activity at in vivo-relevant levels for >28 days (Sci. Adv., 2024). |
| Predictive Capacity | Sensitivity, specificity, accuracy, and predictive values for the toxicity/efficacy endpoint. | Balanced accuracy >75-80% versus clinical outcome reference sets. | A vascularized tumor-on-chip model predicted clinical efficacy response with 82% accuracy in a 30-compound blinded study (Cell Rep., 2024). |
| System Robustness | Z'-factor for key assays performed within the OoC platform. | Z' > 0.5 indicates a robust, reproducible assay suitable for screening. | Z'-factor of 0.61 reported for a barrier integrity assay in a lung-on-chip model (Lab Chip, 2023). |
Detailed Experimental Protocol: A Standardized Toxicity Assessment
Below is a generalized protocol for assessing compound toxicity in an organ-chip model, encapsulating steps critical for generating qualification-worthy data.
Protocol: Mechanistic Toxicity Profiling in a Perfused Liver-on-a-Chip
Objective: To evaluate the potential for drug-induced liver injury (DILI) and elucidate mechanisms of toxicity.
Materials & Pre-Culture:
- Microfluidic Device: A two-channel chip (e.g., parenchymal and vascular channels) with a porous membrane, commercially sourced or fabricated via soft lithography (PDMS).
- Cells: Cryopreserved primary human hepatocytes (pooled donors) and human liver sinusoidal endothelial cells (LSECs). Passage number & viability >90% critical.
- Coating: Incubate chip with 50 µg/mL collagen I (in PBS) at 37°C for 2 hours. Aspirate and air dry.
- Seeding:
- Resuspend hepatocytes at 10-12 x 10^6 cells/mL in seeding medium.
- Introduce 10-15 µL into the parenchymal (top) channel. Allow attachment for 20-30 min.
- Reverse the chip and seed LSECs into the vascular (bottom) channel at 2-3 x 10^6 cells/mL.
- Connect chips to perfusion controller after 2-4 hours of static culture. Initiate flow at 30-60 µL/hour.
- Culture Maintenance: Culture under continuous perfusion with specialized hepatocyte maintenance medium, changed every 24-48 hours, for 7-14 days to achieve mature phenotype.
Treatment & Analysis:
- Dosing: After maturation, introduce test compounds (at clinically relevant concentrations, calculated from Cmax) into the vascular channel medium. Include vehicle controls and benchmark compounds (e.g., Tolcapone [high-risk], Theophylline [low-risk]).
- Sample Collection: Collect effluent medium daily for biomarker analysis (e.g., ALT, Albumin, Urea).
- Endpoint Assays (Day 7 of treatment):
- Viability: Calcein-AM/EthD-1 live/dead staining imaged via confocal microscopy. Quantify viability (%) across 5 fields/chip.
- Functional Assessment: Measure albumin (ELISA) and urea (colorimetric assay) in daily effluent. Normalize to total protein/DNA.
- Mechanistic Insight: Fix chips and perform immunofluorescence for CYP3A4, MRP2 bile transporter, and cleaved Caspase-3. Quantify fluorescence intensity/organization.
- Transcriptomics: Lyse cells directly in chip for RNA-seq to analyze stress pathway activation.
- Data Analysis: Normalize all data to vehicle control (set at 100%). Use ≥3 chips per condition. Statistical analysis via one-way ANOVA with post-hoc test. Generate dose-response curves for IC50 determination.
The Scientist's Toolkit: Essential Research Reagent Solutions
Table 3: Key Reagents and Materials for OoC Model Development & Validation
| Item | Function | Critical Considerations for Qualification |
|---|---|---|
| Primary Human Cells | Provide human-specific, physiologically relevant responses. | Donor variability, lot-to-lot consistency, viability upon thaw. Use pooled donors where possible. |
| Physiologically Relevant ECM | Provides 3D structural and biochemical support (e.g., collagen I, Matrigel). | Batch variability, composition definition, ability to support long-term culture. |
| Defined, Serum-Free Medium | Supports specific cell phenotypes and reduces assay variability. | Must be chemically defined to eliminate unknown variables. |
| Reference Compounds | Establish model performance benchmarks (toxic/non-toxic, efficacious/inefficacious). | Well-characterized pharmacokinetics and clinical outcomes. Curated sets available (e.g., DILIrank). |
| On-Chip/POC Sensors | Real-time, non-invasive monitoring of biomarkers (e.g., TEER, O2, pH, glucose). | Essential for functional readouts; must be calibrated and reproducible. |
| High-Content Imaging Systems | Quantitative, multiplexed endpoint analysis (cell morphology, biomarker expression). | Requires compatibility with chip materials (e.g., PDMS autofluorescence). |
| Automated Perfusion Controllers | Precisely control fluid flow, shear stress, and compound dosing. | Ensures reproducible culture conditions and compound exposure across all test articles. |
Visualizing Key Concepts
Title: Regulatory Qualification Workflow (58 chars)
Title: OoC Toxicity Assay Protocol Flow (45 chars)
Title: Four Pillars of OoC Model Validation (44 chars)
The path to regulatory qualification for 3D microfluidic models as preclinical tools is meticulous and collaborative. It demands a shift from demonstrating exciting biological phenomena to generating standardized, reproducible, and predictive data under a clearly defined CoU. By adhering to structured validation frameworks, employing robust experimental protocols, and engaging early with regulatory agencies, researchers can advance these sophisticated models from the research bench to becoming indispensable tools that enhance the predictive power of preclinical drug development, potentially reducing late-stage failures and advancing more effective therapies to patients.
Strengths, Limitations, and Complementary Use with Other Model Systems
The integration of 3D cell culture within microfluidic devices, often termed "Organ-on-a-Chip" (OoC) technology, represents a paradigm shift from traditional 2D cultures and animal models. This advancement is central to a broader thesis on the fundamentals of 3D microfluidic cell culture research, which posits that physiologically relevant in vitro models are essential for accelerating biomedical discovery and translational drug development. This whitepaper critically examines the strengths and inherent limitations of microfluidic 3D culture systems and argues for their strategic, complementary use with other model systems to form a robust, multi-faceted research pipeline.
Core Strengths of Microfluidic 3D Cell Culture Systems
Microfluidic 3D cultures offer distinct advantages over conventional models by recapitulating key aspects of the native tissue microenvironment.
2.1. Physiological Relevance
- 3D Architecture & Cell-Cell Interactions: Enables formation of tissue-like structures (spheroids, organoids, layered tissues) that restore apical-basal polarity, differentiation gradients, and heterotypic cell signaling.
- Dynamic Microenvironment: Provides precise spatiotemporal control over biochemical (solute gradients) and biophysical (shear stress, cyclic strain) cues.
2.2. Analytical Capabilities
- High-Content Data: Integrated sensors and real-time, non-invasive imaging permit longitudinal analysis of function (e.g., barrier integrity, contractility) and response.
- Reduced Volumes & Cost: Nanolitre-to-microlitre scale minimizes reagent and cell consumption, enabling high-throughput screening with primary or iPSC-derived cells.
2.3. Human-Centric Modeling
- Facilitates the creation of patient-specific models using human primary or iPSC-derived cells, potentially reducing species-specific translational gaps.
Table 1: Key Strengths and Their Impact on Research Outcomes
| Strength | Technical Manifestation | Impact on Research/Development |
|---|---|---|
| Dynamic Flow | Perfusion with programmable shear stress. | Mimics vascular shear; improves nutrient/waste exchange; enables endothelial cell lining. |
| Multicellular Complexity | Seeding of co-cultures in defined, adjacent compartments. | Models organ-level interactions (e.g., gut-liver, neurovascular unit). |
| Tissue-Tissue Interface | Porous membranes separating patterned microchannels. | Recreates critical barriers (alveolar-capillary, blood-brain barrier). |
| Real-time Monitoring | Embedded electrodes or optical access for live imaging. | Provides kinetic data on cell function and drug response, not just endpoint analysis. |
Acknowledged Limitations and Technical Challenges
Despite their promise, these systems are not universally applicable and present significant hurdles.
3.1. Technical & Operational Complexity
- Fabrication & Accessibility: Requires specialized expertise in microfabrication (soft lithography, 3D printing) or capital to purchase commercial systems.
- Standardization: Lack of uniform protocols for cell seeding, media composition, flow rates, and endpoint analyses hinders reproducibility and data comparison across labs.
3.2. Biological Limitations
- Simplified Physiology: While advanced, they remain simplifications of whole organs, often lacking full immune, endocrine, or nervous system integration.
- Limited Lifespan & Maturity: Many systems support cultures for days to weeks, which may be insufficient for modeling chronic diseases or full tissue maturation.
3.3. Analytical Challenges
- Sampling Difficulties: Retrieving cells or secreted factors for omics analyses (e.g., scRNA-seq, proteomics) can be technically challenging without disrupting the microfluidic circuit.
- Data Complexity: High-content, real-time data generation demands sophisticated computational tools for analysis and interpretation.
Table 2: Key Limitations and Current Mitigation Strategies
| Limitation Category | Specific Challenge | Current Mitigation Strategies |
|---|---|---|
| Technical | Chip-to-chip variability. | Adoption of injection-molded or commercially produced chips. Automated fluid handling systems. |
| Biological | Absence of systemic circulation. | Development of multi-organ "body-on-a-chip" platforms with shared vascular perfusate. |
| Biological | Lack of immune components. | Incorporation of primary or engineered immune cells (e.g., macrophages, T-cells) into co-cultures. |
| Analytical | Destructive endpoint analysis. | Development of in-situ sensors (TEER, pH, O2) and protocols for non-destructive cell retrieval. |
Complementary Use with Other Model Systems
The power of microfluidic 3D models is maximized when deployed strategically within a hierarchy of models, each validating and informing the others.
4.1. Synergy with Traditional 2D Cultures
- Role: 2D cultures remain unparalleled for high-throughput genetic screens, fundamental mechanistic studies of signaling pathways, and initial toxicity assessments.
- Complementary Strategy: Use 2D systems for rapid target identification and hypothesis generation. Validate hits and study complex tissue-level responses in 3D microfluidic models.
4.2. Synergy with Static 3D Cultures (Spheroids, Organoids)
- Role: Static 3D models are excellent for studying stem cell biology, development, and genetic diseases in a high-throughput format.
- Complementary Strategy: Generate organoids in standard plates, then transfer/load them into microfluidic chips for subsequent maturation under perfusion and for exposure to physiological cues or drug gradients not possible in static culture.
4.3. Synergy with Animal Models
- Role: In vivo models provide essential whole-organism context for pharmacokinetics, biodistribution, systemic toxicity, and complex behavior.
- Complementary Strategy: Employ microfluidic human-based models for human-specific mechanistic studies, preclinical efficacy/toxicity prioritization (3Rs principle: Reduction), and to investigate pathways not conserved in animals. Use animal models for final validation in an integrated physiological system.
Diagram Title: Model System Hierarchy and Complementary Flow
Detailed Experimental Protocol: Establishing a Gut-on-a-Chip Model for Drug Absorption
This protocol exemplifies the integration of a static 3D model (intestinal organoids) into a microfluidic system.
5.1. Objective: To create a human intestinal epithelium with physiological morphology and function under flow for drug transport studies.
5.2. Materials & The Scientist's Toolkit
Table 3: Key Research Reagent Solutions for Gut-on-a-Chip Experiment
| Item | Function | Example/Notes |
|---|---|---|
| Microfluidic Device | Provides scaffold with channels and porous membrane. | Commercial gut-on-a-chip (e.g., Emulate, Mimetas) or PDMS device fabricated via soft lithography. |
| Extracellular Matrix (ECM) | Coats membrane to support cell adhesion and polarization. | Cultrex Basement Membrane Extract (BME) or Matrigel, diluted 1:30 in cold medium. |
| Human Intestinal Organoids | Source of primary-like intestinal epithelial cells. | Derived from biopsy or iPSCs; dissociated to single cells for seeding. |
| Differentiation Medium | Induces and maintains mature enterocyte/fate specification. | Advanced DMEM/F12 with growth factors (e.g., Wnt3a, R-spondin-1 minus), N2, B27 supplements. |
| Perfusion Medium | Provides nutrients under flow; can be basolateral vs. apical. | Same as differentiation medium, often with reduced growth factor concentration. |
| Fluorescent Tracer Molecules | Quantify barrier integrity (TEER alternative). | FITC-Dextran (4 kDa) for paracellular flux assessment. |
| Programmable Syringe Pump | Generates precise, continuous flow. | Required for applying physiological luminal shear stress (~0.02 dyne/cm²). |
5.3. Step-by-Step Methodology
- Chip Preparation: Sterilize the microfluidic device (UV or ethanol). Coat the apical surface of the porous membrane with 150 µL of diluted ECM. Incubate (37°C, 2 hrs) then aspirate excess.
- Cell Seeding: Dissociate human intestinal organoids to single cells. Resuspend 1-2 x 10^6 cells/mL in differentiation medium. Introduce 20-30 µL of cell suspension into the apical channel. Place chip in incubator (37°C, 5% CO2) for 2-4 hours without flow to allow cell attachment.
- Initiation of Flow: Connect chip to medium reservoirs via sterile tubing connected to a syringe pump. Begin slow, continuous flow of differentiation medium through both apical and basal channels (30 µL/hr each). Gradually increase flow rate over 48 hours to the final desired shear stress.
- Culture & Differentiation: Culture under continuous flow for 5-10 days, refreshing medium reservoirs every 2-3 days. Monitor confluence and morphology via integrated microscopy.
- Functional Validation (Day 7):
- Barrier Integrity: Introduce FITC-dextran to the apical channel. Sample from the basal channel at timed intervals to measure fluorescent accumulation, calculating apparent permeability (Papp).
- Marker Expression: Fix cells in situ and immunostain for ZO-1 (tight junctions), Villin (brush border), and MUC2 (goblet cells).
- Drug Transport Assay: Add test compound to the apical inlet reservoir. Collect effluent from the basal channel at scheduled times for LC-MS/MS analysis to quantify translocated drug.
Diagram Title: Gut-on-a-Chip Establishment and Validation Workflow
Microfluidic 3D cell culture systems are a transformative tool, not a panacea. Their strength lies in providing human-relevant, dynamic tissue contexts unobtainable by other methods. However, their complexity, cost, and inherent biological simplifications necessitate a complementary research strategy. By positioning these chips as an intermediate, integrative platform between high-throughput in vitro models and holistic in vivo studies, researchers can construct a more predictive and efficient pipeline for fundamental biological insight and drug development. The future of the field depends on standardizing these systems, improving their analytical integration, and deliberately designing studies that leverage their unique capabilities within the broader ecosystem of biomedical model systems.
Conclusion
3D cell culture in microfluidic devices represents a paradigm shift toward more human-relevant experimental models in biomedical research. By integrating foundational tissue engineering principles with precise microfluidic control, researchers can now recreate complex tissue- and organ-level functions in vitro. While methodological challenges remain, ongoing advancements in materials science, automation, and multimodal analysis are rapidly increasing the robustness and accessibility of these platforms. The future lies in integrating multiple organ systems into interconnected 'body-on-a-chip' platforms, incorporating patient-derived cells for personalized medicine applications, and leveraging AI for experimental design and data analysis. As validation against clinical outcomes continues to grow, these technologies are poised to reduce reliance on animal models, accelerate drug discovery, and fundamentally improve our understanding of human physiology and disease.