Atomic Force Microscopy in Biomedicine: Visualizing & Measuring Nanoscale Biological Interactions for Drug Discovery
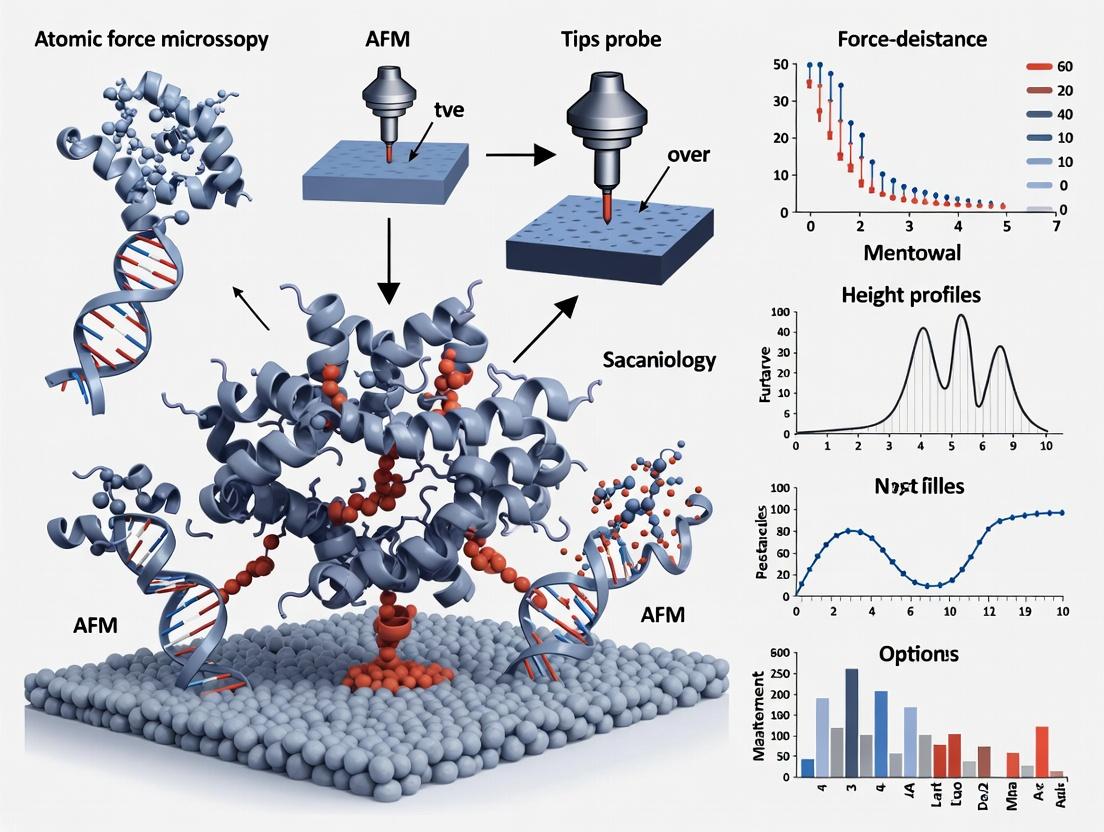
This article provides a comprehensive guide for researchers and drug development professionals on applying Atomic Force Microscopy (AFM) to study nanoscale biological interactions.
Atomic Force Microscopy in Biomedicine: Visualizing & Measuring Nanoscale Biological Interactions for Drug Discovery
Abstract
This article provides a comprehensive guide for researchers and drug development professionals on applying Atomic Force Microscopy (AFM) to study nanoscale biological interactions. We cover foundational principles of AFM as a multifunctional tool, detail advanced methodologies for probing biomolecular forces and live-cell dynamics, address critical troubleshooting for sample preparation and data interpretation, and validate AFM findings through comparison with complementary techniques. The scope extends from basic biophysical characterization to direct applications in mapping receptor-ligand interactions, assessing drug mechanisms, and developing nanomedicines, offering a practical resource for integrating AFM into biomedical research pipelines.
Understanding AFM Fundamentals: From Physics to Biological Imaging at the Nanoscale
Within the broader thesis on atomic force microscopy for nanoscale biological interactions research, the operational core lies in the force-sensing cantilever. This principle is foundational for probing live cell mechanics, protein folding/unfolding, ligand-receptor binding kinetics, and the development of targeted drug delivery systems. The performance of the cantilever—its sensitivity, resonance frequency, and force constant—differs radically between air and liquid environments, directly determining the resolution and biological relevance of acquired data.
Core Principles: Cantilever Dynamics in Air vs. Liquid
The cantilever acts as a Hookean spring. Its deflection, measured by a laser spot reflected onto a photodetector, is proportional to the force applied (F = -k * Δz, where k is the spring constant). The medium (air or liquid) critically affects its dynamical properties.
Table 1: Quantitative Comparison of Cantilever Behavior in Air vs. Liquid Environments
| Parameter | Air Environment | Liquid Environment | Impact on Biological Experiment |
|---|---|---|---|
| Spring Constant (k) | Typical range: 0.01 - 100 N/m | Unchanged intrinsic property. | Softer cantilevers (0.01-0.1 N/m) essential for probing soft cells without damage. |
| Resonance Frequency (f₀) | High (e.g., 10-300 kHz). | Reduced by ~2-4x due to added mass of fluid. | Lower f₀ reduces possible imaging speed; requires fluid-compatible tuning. |
| Quality Factor (Q) | High (100-1000). Provides sharp resonance peak. | Very low (1-10 in water). Broad resonance peak. | High Q in air enables sensitive dynamic modes. Low Q in liquid dampens oscillations, favoring contact or force spectroscopy modes. |
| Thermal Noise Floor | Lower amplitude. | Significantly higher due to fluid bombardment. | Limits force resolution; typical force resolution in liquid is ~10-20 pN, vs. ~1 pN in air. |
| Viscous Damping | Low. | High, dominates dynamics. | Requires adjusted feedback parameters (gains, scan rates) to prevent instability. |
| Typical Application | High-resolution topography of fixed samples, materials science. | In situ measurement of biological interactions, live cell imaging, single-molecule force spectroscopy. |
Experimental Protocols
Protocol 3.1: Cantilever Calibration in Liquid for Force Spectroscopy
Objective: Accurately determine the spring constant (k) and optical lever sensitivity (InvOLS) of a cantilever immersed in fluid for quantitative force measurements.
- Cantilever & Fluid Cell Preparation: Mount a tipless or protein-functionalized cantilever. Clean the fluid cell with 70% ethanol followed by copious deionized water. Inject the desired buffer (e.g., PBS, Tris-HCl) to fully immerse the cantilever.
- Thermal Tune Method for Spring Constant: a. Retract the tip several micrometers from any surface. b. Record the cantilever's thermal fluctuation power spectral density (PSD) over 5-10 seconds. c. Fit the PSD to a simple harmonic oscillator model. The equipartition theorem gives k = kB * T / <Δz^2>, where kB is Boltzmann's constant, T is temperature, and <Δz^2> is the mean squared deflection. d. The fitted resonance frequency provides the damped f₀ in liquid.
- Optical Lever Sensitivity (InvOLS) Calibration: a. Approach the cantilever onto a clean, rigid substrate (e.g., mica or glass). b. Obtain a force-distance curve featuring a region of constant compliance (straight line). c. The slope of this linear region (in nm/V) is the InvOLS. Note: This value differs from the one calibrated in air and must be re-measured in liquid.
- Validation: Perform a force curve on a known, compliant sample (e.g., PEG hydrogel) to verify the calculated force values are within expected range.
Protocol 3.2: Single-Molecule Force Spectroscopy (SMFS) on Membrane Proteins
Objective: Measure the unbinding force of a ligand from its receptor or the unfolding force of a protein in near-physiological conditions.
- Functionalization: a. Cantilever Tip: Incubate with PEG-benzaldehyde linker, then conjugate the protein/receptor of interest via amine chemistry. b. Substrate: Immobilize the complementary ligand/target protein on a glass slide activated with NHS-ester chemistry.
- Liquid Environment Setup: Assemble the fluid cell with the functionalized substrate. Inject appropriate recording buffer.
- Data Acquisition: a. Approach the functionalized tip to the substrate at a controlled velocity (e.g., 500-1000 nm/s). b. Allow for contact/binding for a defined dwell time (0.1-1 s). c. Retract the tip at a constant velocity while recording deflection. d. Repeat 500-1000 times at different locations to gather statistics.
- Data Analysis: Identify rupture events in retraction curves. Plot rupture force vs. loading rate (on a log scale) to extract kinetic parameters (k_off, transition state distance) using Bell-Evans or Dudko-Hummer-Szabo models.
Visualization: AFM Force Spectroscopy Workflow for Biological Interactions
Diagram Title: SMFS Experimental Workflow in Liquid
The Scientist's Toolkit: Key Research Reagent Solutions
Table 2: Essential Materials for Bio-AFM in Liquid
| Item | Function in Experiment |
|---|---|
| Nitride Lever Probes (Si₃N₄) | Gold-standard for liquid. Hydrophilic, biocompatible, with low spring constants (0.01-0.1 N/m) for soft samples. |
| PEG-based Crosslinkers | Heterobifunctional (e.g., NHS-Aldehyde). Provides flexible tether for biomolecule attachment, reducing non-specific adhesion and allowing natural motion. |
| Functionalization Kits | Commercial kits (e.g., for amine, thiol, biotin chemistry) streamline and standardize tip and substrate coating protocols. |
| Physiological Buffers (PBS, HEPES) | Maintain biomolecular structure and activity. May require addition of cations (Mg²⁺, Ca²⁺) for specific binding. |
| Anti-Drift & Temperature Control Systems | Active heating/cooling stages and drift compensation software are critical for stable, long-duration measurements in liquid. |
| BSA or Casein | Used as blocking agents to passivate surfaces and minimize non-specific protein adsorption to cantilever and substrate. |
| Cleaning Solutions (Piranha, Hellmanex) | For rigorous decontamination of substrates (mica, glass) and fluid cell components prior to experiments. |
Within the broader thesis investigating nanoscale biological interactions using atomic force microscopy (AFM), the selection of an appropriate imaging mode is paramount. It dictates the balance between resolution, sample integrity, and the ability to derive quantitative mechanical properties. This application note details the three primary modes used in biological AFM: Contact Mode, Tapping Mode, and PeakForce Tapping Mode, providing protocols and comparative analysis for researchers and drug development professionals.
Contact Mode
The original AFM imaging mode, where the tip is in constant contact with the sample surface. A feedback loop maintains a constant deflection force.
Key Application & Protocol:Topographical Imaging of Fixed Cells
Objective: To obtain high-resolution surface topography of chemically fixed adherent cells. Materials:
- AFM with contact mode capabilities
- Liquid cell (for imaging in buffer if needed)
- Silicon nitride cantilevers (spring constant: ~0.01-0.1 N/m)
- Fixed cell sample on a glass coverslip
- PBS buffer (pH 7.4)
Protocol:
- Cantilever Calibration: Calibrate the cantilever's spring constant using the thermal tune method.
- Sample Mounting: Mount the fixed cell sample on the AFM stage. If imaging in liquid, inject PBS buffer to immerse the tip and sample.
- Engagement: Approach the tip to the surface near the cell periphery using an optical microscope.
- Parameter Setting:
- Setpoint: 0.5-2 nN (to minimize sample deformation).
- Scan Rate: 0.5-1.5 Hz.
- Scan Size: Begin with a 50x50 µm area to locate cells, then reduce to 10x10 µm for detail.
- Feedback Gains: Adjust (Integral and Proportional) to maintain tracking without oscillation.
- Imaging: Acquire images in both height and deflection channels. The deflection image often provides enhanced edge details.
- Retraction: After scanning, retract the tip and rinse if necessary.
Tapping Mode (Intermittent Contact Mode)
The tip oscillates at resonance, intermittently contacting the surface to minimize lateral forces. Essential for imaging soft, adhesive biological samples.
Key Application & Protocol:Imaging Live Bacterial Membranes
Objective: To visualize surface structures of live bacteria in physiological buffer with minimal disturbance. Materials:
- AFM with tapping mode in liquid
- Sharp silicon cantilevers (resonant frequency in liquid: ~20-150 kHz, spring constant: ~0.1-1 N/m)
- Bacterial culture immobilized on a poly-L-lysine coated glass slide or filter membrane
- Appropriate growth medium or imaging buffer
Protocol:
- Cantilever Tuning: In liquid, tune the cantilever to find its resonant frequency and set the oscillation amplitude (typically 5-20 nm free amplitude).
- Sample Preparation: Immobilize a dense lawn of live bacteria on the substrate. Rinse gently and mount in the liquid cell with buffer.
- Engagement & Setpoint: Engage with a high setpoint (~95% of free amplitude). Reduce the setpoint to ~70-80% of free amplitude for stable imaging.
- Parameter Optimization:
- Scan Rate: 0.5-1.0 Hz.
- Scan Size: 1x1 µm to 5x5 µm.
- Drive Frequency: Slightly below the resonant peak for stable phase imaging.
- Use the Phase channel to map variations in sample viscoelasticity.
- Imaging: Acquire height and amplitude/phase images simultaneously. Monitor cell integrity over time.
- Decontamination: After imaging, thoroughly clean the fluid cell and cantilever holder to prevent biofilm formation.
PeakForce Tapping Mode
A force-distance curve-based mode where the tip taps the surface at a frequency below resonance, capturing mechanical properties at each pixel with precise force control.
Key Application & Protocol:Nanomechanical Mapping of Mammalian Cells
Objective: To simultaneously acquire high-resolution topography and quantitative elastic modulus maps of live or fixed mammalian cells. Materials:
- AFM equipped with PeakForce Tapping (e.g., Bruker's PeakForce QNM)
- ScanAsyst-Fluid+ or similar cantilevers (spring constant: ~0.1-1 N/m, sharp tip)
- Live or fixed adherent cells (e.g., HeLa, fibroblasts) in culture medium or buffer
- Calibration sample (e.g., polystyrene or polypropylene with known modulus)
Protocol:
- Cantilever Calibration: Precisely calibrate the spring constant and the optical lever sensitivity (InvOLS). Use the thermal tune method.
- Sample Mounting: Place the cell culture dish on the heated stage (if imaging live cells at 37°C). Ensure immersion in CO2-independent medium or buffer.
- Parameter Configuration:
- PeakForce Setpoint: 50-300 pN (key for minimizing deformation).
- PeakForce Frequency: 0.25-2 kHz.
- Scan Rate: 0.1-0.5 Hz for a 256x256 pixel image.
- Tip Model: Input the correct tip radius (often 2-20 nm for new tips) into the software's Derjaguin–Muller–Toporov (DMT) or Sneddon model.
- Engagement and Scan: Engage automatically using the software's engagement logic. Begin scanning.
- Data Capture: The system simultaneously records Height, PeakForce Error, DMT Modulus, Adhesion, Deformation, and Dissipation maps.
- Data Analysis: Use the accompanying software to segment the modulus map, excluding the substrate, to generate statistics on the cell's Young's modulus.
Quantitative Data Comparison Table
| Parameter | Contact Mode | Tapping Mode | PeakForce Tapping Mode |
|---|---|---|---|
| Tip-Sample Interaction | Continuous contact | Intermittent contact | Transient, controlled-force contact |
| Typical Lateral Forces | High | Very Low | Extremely Low |
| Imaging Force | 0.1 - 10 nN | 10 - 500 pN (amplitude setpoint) | 10 - 500 pN (directly set) |
| Optimal Sample Type | Fixed, hard samples | Live cells, biomolecules | Live cells, delicate structures |
| Quantitative Mechanics | Limited (via force curves) | Qualitative (phase imaging) | Yes (Modulus, Adhesion maps) |
| Typical Resolution in Liquid | ~1-5 nm | ~1-3 nm | ~1-3 nm |
| Imaging Speed | Fast | Medium | Slow to Medium |
| Primary Biological Output | Topography | Topography, Phase contrast | Topography + Nanomechanical Properties |
The Scientist's Toolkit: Key Research Reagent Solutions
| Item | Function & Explanation |
|---|---|
| Silicon Nitride Probes (e.g., Bruker DNP) | For contact mode in liquid. Low spring constant minimizes indentation on soft samples. |
| Sharp Silicon Probes (e.g., Olympus AC40) | For tapping mode in air/liquid. High resonance frequency and sharp tip for high-resolution imaging of biomolecules. |
| PeakForce Tapping Probes (e.g., Bruker ScanAsyst-Fluid+) | Specialized probes with consistent geometry and reflective coating for quantitative nanomechanical mapping in fluid. |
| Poly-L-Lysine Solution | Coating agent for electrostatic immobilization of bacteria, cells, or tissue sections on glass/mica substrates. |
| Aminopropylsilatrane (APS) | Covalent silane coating for robust functionalization of tips for force spectroscopy experiments. |
| PEG Crosslinkers | Polyethylene glycol spacers used in tip functionalization to tether biomolecules (e.g., ligands, antibodies) while reducing non-specific adhesion. |
| CO2-Independent Medium | Buffered cell culture medium for maintaining pH during live-cell AFM imaging outside a CO2 incubator. |
| Glutaraldehyde (2-4%) | Common fixative for preserving cellular architecture for high-resolution contact mode imaging. |
| Polystyrene/Polypropylene Film | Reference samples with known elastic modulus (e.g., ~2-3 GPa) for calibration of nanomechanical measurements in PeakForce Tapping. |
Workflow and Conceptual Diagrams
Decision Workflow for AFM Mode Selection in Biology
PeakForce Tapping Operational Cycle and Data Output
Within the broader context of a thesis on atomic force microscopy (AFM) for nanoscale biological interactions, this document details the application of AFM-based force spectroscopy (AFM-FS). Moving beyond topographical imaging, AFM-FS quantitatively probes the forces, energies, and kinetics of molecular interactions central to biology and drug development, such as receptor-ligand binding, cell adhesion, and protein unfolding.
Key Quantitative Data from AFM Force Spectroscopy
Table 1: Typical Force and Energy Scales in Biological Interactions Measured by AFM-FS
| Interaction Type | Typical Force Range | Energy Scale (kₐT) | Kinetic Off-Rate (kᵒᶠᶠ) | Common Experimental Model |
|---|---|---|---|---|
| Antibody-Antigen | 50 - 200 pN | 10 - 30 | 10⁻² - 10⁻⁴ s⁻¹ | IgG/protein A, biotin/streptavidin |
| Receptor-Ligand (e.g., integrin-RGD) | 50 - 150 pN | 15 - 40 | 10⁻¹ - 10⁻³ s⁻¹ | Cells on patterned substrates |
| Protein Unfolding | 100 - 300 pN | 20 - 100 | N/A | Polyproteins (e.g., titin, ubiquitin) |
| DNA Base Pairing | 50 - 70 pN per pair | ~2 per pair | Varies with sequence | dsDNA unzipping or stretching |
| Lipid Bilayer Extraction | 50 - 150 pN | N/A | N/A | Supported lipid bilayers |
| Single Carbohydrate Binding | 50 - 100 pN | 5 - 20 | 10⁻³ - 10⁻⁵ s⁻¹ | Lectin-mannose interactions |
Table 2: Common AFM Probe Functionalization Methods and Characteristics
| Method | Chemistry | Typical Ligand Density | Stability | Best For |
|---|---|---|---|---|
| PEG Silane Linker | Silane-PEG-NHS | ~100 - 500 molecules/µm² | High (days) | Single-molecule force spectroscopy |
| Avidin-Biotin | Biotinylated silane + Streptavidin | Variable, very high | Very High | Capturing biotinylated molecules |
| Direct Adsorption | Incubation with protein | High, uncontrolled | Moderate (hours) | Cell adhesion force measurements |
| Click Chemistry | Alkyne/Azide-functionalized tips | Medium | High | Specific, oriented coupling |
| Electrostatic Adsorption | Polyelectrolyte layers | Very High | Moderate | Rapid, non-specific coating |
Detailed Experimental Protocols
Protocol 1: Single-Molecule Force Spectroscopy for Receptor-Ligand Binding Kinetics
Objective: To quantify the unbinding force and kinetic parameters of a specific receptor-ligand pair (e.g., integrin α5β1 and fibronectin fragment).
Materials: See "The Scientist's Toolkit" below.
Procedure:
- Probe Functionalization:
- Clean AFM cantilevers (e.g., MLCT-Bio-DC) in piranha solution (3:1 H₂SO₄:H₂O₂) CAUTION: Highly corrosive for 10 minutes. Rinse thoroughly in Milli-Q water and ethanol. Dry under N₂.
- Vapor-phase silanization in APTES (3-aminopropyltriethoxysilane) for 2 hours.
- Incubate tips in 0.5% (v/v) heterobifunctional PEG linker (e.g., NHS-PEG-Aldehyde) in chloroform for 2 hours. Rinse.
- Activate aldehyde groups by incubating in NaCNBH₃ solution (1 mg/mL in PBS) for 10 min.
- Incubate tips with ligand solution (e.g., 50 µg/mL RGD peptide in PBS) for 1 hour. Quench with 1M ethanolamine-HCl (pH 8.5) for 10 minutes.
- Store functionalized tips in PBS at 4°C until use.
Sample Preparation:
- Immobilize receptor protein (e.g., purified integrin) on a clean, PEG-coated glass substrate via similar NHS chemistry to ensure proper orientation and minimize non-specific adhesion.
AFM Force Measurements:
- Mount functionalized tip and substrate in fluid cell with appropriate buffer (e.g., PBS with 1 mM Mn²⁺ to activate integrins).
- Set AFM to Force Spectroscopy mode. Define approach/retract parameters: approach velocity 500 nm/s, retract velocity 1000 nm/s, pause time 0.1-1 s, force trigger ~200 pN.
- Collect a minimum of 1000 force-distance (F-D) curves from random points on the substrate.
Data Analysis:
- Use custom scripts (e.g., in Igor Pro, MATLAB, or open-source tools like ForcePy) to identify adhesion events in retract curves.
- Plot unbinding force histogram. Fit with Gaussian to find most probable unbinding force.
- Perform dynamic force spectroscopy: Repeat measurement at multiple retract velocities (e.g., 50 nm/s to 10,000 nm/s).
- Plot most probable unbinding force vs. logarithm of loading rate. Fit with Bell-Evans model: F* = (kₐT / xᵦ) * ln( r / (kᵒᶠᶠ * kₐT / xᵦ) ), to extract the intrinsic off-rate (kᵒᶠᶠ) and the potential width (xᵦ).
Protocol 2: Mapping Cellular Adhesion Forces on Patterned Surfaces
Objective: To spatially resolve and quantify the adhesion force of living cells at the sub-membrane level.
Procedure:
- Substrate Patterning: Create a substrate with alternating regions of adhesive (e.g., fibronectin) and non-adhesive (e.g., PEG) proteins using microcontact printing.
- Cell Preparation: Culture adherent cells (e.g., fibroblasts). Detach gently using enzyme-free buffer, resuspend in serum-free measurement buffer, and allow to settle on the patterned substrate for 15-30 min.
- AFM Measurement:
- Use a tipless cantilever functionalized with a 5 µm colloidal probe.
- Center a single cell under the optical microscope. Carefully lower the probe onto the cell body using a low force setpoint (< 1 nN).
- Perform a force-volume map: Acquire a grid of F-D curves (e.g., 32x32 points) over a selected area (e.g., 10x10 µm²) at the cell periphery.
- Parameters: extend/retract speed 5-10 µm/s, relative trigger force 1-2 nN.
- Data Analysis:
- For each F-D curve in the map, calculate the adhesion force (minimum force during retraction).
- Generate a 2D adhesion force map overlaying the substrate pattern.
- Statistically compare adhesion forces on patterned vs. non-patterned regions.
Visualization: Pathways and Workflows
Title: Single-Molecule Force Spectroscopy Workflow
Title: AFM Force Spectroscopy Modes and Outputs
The Scientist's Toolkit: Essential Research Reagents & Materials
Table 3: Key Reagents and Materials for AFM Force Spectroscopy
| Item | Function | Example Product/Chemical |
|---|---|---|
| AFM Probes | The sensing element; choice depends on need for sharpness, spring constant, and functionalization. | Bruker MLCT-Bio-DC (for bio-FS), Novascan PNP-TR-TL (tipless for colloid), Olympus RC800PSA (soft for cells). |
| Heterobifunctional PEG Crosslinkers | Spacer molecule to immobilize biomolecules on tip/surface; reduces non-specific binding, provides flexibility. | NHS-PEG-Maleimide, NHS-PEG-Aldehyde, Alkyne-PEG-NHS (e.g., from BroadPharm or Iris Biotech). |
| Surface Chemistry Reagents | Modify tip and substrate surfaces for controlled biomolecule attachment. | (3-Aminopropyl)triethoxysilane (APTES), mPEG-Silane (for passivation), NHS, EDC. |
| Purified Recombinant Proteins / Peptides | The molecules of interest for interaction studies. Must be highly pure and biochemically active. | RGD peptides, recombinant integrins, antibodies, cadherins (e.g., from R&D Systems, Sigma). |
| Biotin-Streptavidin System | High-affinity capture system for orienting biotinylated molecules on tips or surfaces. | Biotinylated silane (Biotin-PEG-Silane), Streptavidin. |
| Measurement Buffer Salts & Cations | Control the physiological and activation state of biomolecules during measurement. | MnCl₂ or MgCl₂ (for integrin activation), CaCl₂, PBS, HEPES, Tris. |
| Cell Culture Reagents | For maintaining and preparing live cells for adhesion or mechanical tests. | Serum-free media (for measurements), enzyme-free cell dissociation buffer, fibronectin. |
| Data Analysis Software | Essential for processing thousands of F-D curves and extracting kinetic parameters. | Custom scripts in Igor Pro, MATLAB, JPK Data Processing, or open-source (ForcePy, AFM Force). |
Thesis Context: Within atomic force microscopy (AFM) research on nanoscale biological interactions, the unique value proposition lies in the ability to visualize dynamic processes, quantify mechanical properties, and map molecular forces in living systems without the need for fixation, staining, or genetic modification. This capability is critical for obtaining physiologically relevant data.
Application Notes
Application 1: Real-Time Visualization of Membrane Pore Formation by Antimicrobial Peptides (AMPs) Live AFM imaging in liquid buffer allows for the direct observation of AMP action on bacterial or model lipid membranes. Researchers can quantify pore size, kinetics of formation, and subsequent membrane remodeling.
Application 2: Single-Molecule Binding Force Spectroscopy of Receptor-Ligand Interactions Using functionalized AFM tips, the unbinding forces between specific molecular pairs (e.g., antibody-antigen, cell adhesion molecules) can be measured under physiological pH and ionic strength, providing kinetic and thermodynamic parameters.
Application 3: Monitoring Dynamic Conformational Changes in Functional Proteins High-speed AFM enables the visualization of proteins like ion channels or molecular motors in action, capturing sub-second conformational shifts that are often lost in ensemble-averaged techniques.
Application 4: Nanomechanical Mapping of Living Cells for Drug Response The stiffness and viscoelasticity of cells, key indicators of state and health, can be spatially mapped before and after drug treatment to assess cytotoxic effects or mechanisms of action.
Protocols
Protocol 1: Imaging Dynamic Protein Assemblies on Mica Supported Lipid Bilayers (SLBs)
Objective: To observe the assembly of proteins (e.g., the pore-forming toxin perforin) on a model cell membrane in real-time.
- SLB Preparation: Prepare small unilamellar vesicles (SUVs) from desired lipids (e.g., DOPC:DOPS 80:20) via extrusion. Deposit 0.5 mg/mL SUV solution on freshly cleaved mica in a fluid cell, incubate for 15 min, then rinse extensively with imaging buffer (e.g., HEPES with Ca²⁺).
- AFM Setup: Mount the fluid cell on the AFM stage. Use a silicon nitride cantilever (k ~ 0.1 N/m). Engage in contact mode under minimal applied force (<100 pN).
- Baseline Imaging: Acquire a 5x5 µm topographical image of the SLB to confirm homogeneity.
- Protein Injection: Introduce the protein of interest (e.g., 50 nM perforin in imaging buffer) into the fluid cell via perfusion system without disengaging the tip.
- Time-Lapse Imaging: Continuously scan a 2x2 µm area at a line rate of 1-2 Hz. Monitor for topographical changes indicative of protein binding and oligomerization.
- Data Analysis: Use image analysis software to track the height and diameter of protein complexes over time.
Protocol 2: Single-Cell Nanomechanics Before and After Drug Treatment
Objective: To quantify changes in the elastic modulus of a live cancer cell in response to a cytoskeletal-targeting drug.
- Cell Preparation: Seed adherent cells (e.g., MCF-7) on a 35 mm glass-bottom dish at 70% confluency 24 hours prior.
- AFM Calibration: Calibrate a pyramidal-tipped, colloidal probe cantilever (k ~ 0.01 N/m, sphere diameter ~5µm) for thermal noise method.
- Pre-Treatment Mapping: Locate a cell nucleus using optical view. Acquire a 50x50 point force map over a 20x20 µm area centered on the nucleus. Use a force trigger of 0.5 nN and a ~1 Hz approach/retract rate. Fit the retraction curve with the Hertz model to derive Young's Modulus (E).
- Drug Administration: Perfuse the dish with media containing the drug (e.g., 1 µM Latrunculin A).
- Post-Treatment Mapping: After 15 minutes, locate the same cell and acquire an identical force map.
- Statistical Analysis: Compare the median E values from pre- and post-treatment maps using a non-parametric test (e.g., Mann-Whitney U test).
Data Tables
Table 1: Comparative Analysis of Imaging Modalities for Live Biological Samples
| Modality | Resolution (Lateral) | Resolution (Axial) | Label Required? | Throughput | Physiological Conditions? |
|---|---|---|---|---|---|
| AFM | 0.5 - 5 nm | 0.1 - 0.5 nm | No | Low | Yes |
| Confocal Fluorescence | ~200 nm | ~500 nm | Yes | Medium | Yes |
| Electron Microscopy | 0.1 - 1 nm | 0.1 - 1 nm | Yes | Low | No (Vacuum) |
| Super-Resolution Fluorescence | 20-50 nm | ~500 nm | Yes | Medium-High | Often compromised |
| DIC/Phase Contrast | ~200 nm | N/A | No | High | Yes |
Table 2: Quantitative Results from AMP Pore Formation Experiment (Example Data)
| Time Point (min) | Average Pore Diameter (nm) | Pore Density (pores/µm²) | Membrane Step Height (nm) |
|---|---|---|---|
| 0 (Baseline) | 0 | 0 | 4.5 ± 0.2 |
| 5 | 12 ± 3 | 8 ± 2 | 4.3 ± 0.3 |
| 15 | 22 ± 5 | 25 ± 4 | 3.8 ± 0.4 |
| 30 | 25 ± 4 | 40 ± 6 | 3.5 ± 0.5 |
Diagrams
Title: AFM Live-Cell Experiment Workflow
Title: Single-Molecule Force Spectroscopy Protocol
The Scientist's Toolkit: Research Reagent & Material Solutions
| Item | Function & Relevance |
|---|---|
| Functionalized AFM Probes (e.g., MLCT-BIO) | Silicon nitride cantilevers with biotinylated tips for specific binding force measurements. |
| Muscovite Mica Discs (V1 Grade) | An atomically flat, negatively charged substrate for preparing supported lipid bilayers or adsorbing biomolecules. |
| Biolever Mini Cantilevers (BL-AC40TS) | Ultra-short, soft cantilevers (k ~0.09 N/m) optimized for high-resolution imaging of soft samples in fluid. |
| Extruder & Polycarbonate Membranes | For generating uniform, large unilamellar vesicles (LUVs) of defined size for SLB formation. |
| Temperature-Controlled Fluid Cell | Maintains sample at 37°C during imaging, crucial for true physiological relevance. |
| Cantilever Coating Kit (e.g., PEG Linker) | Enables covalent attachment of specific ligands or antibodies to the AFM tip for functional assays. |
| Deflection Sensitivity Calibration Sample | A rigid sample (e.g., sapphire) for accurately converting photodiode voltage to cantilever deflection (nm). |
| Phosphate-Free Imaging Buffers (e.g., HEPES) | Prevent calcium phosphate precipitation during long-term live imaging. |
Within the thesis investigating nanoscale biological interactions—such as receptor-ligand binding, cellular membrane mechanics, and protein aggregation—Atomic Force Microscopy (AFM) is indispensable. Its capability to operate in near-physiological conditions provides unprecedented insights into dynamic biomolecular processes. The fidelity of this data is fundamentally governed by three core components: Probes, the Piezoelectric Scanner, and Fluid Cells. This document outlines their application-specific roles, quantitative performance metrics, and detailed protocols for their optimal use in biological AFM research.
Application Notes & Quantitative Data
Probes (Cantilevers & Tips)
The probe is the primary biosensor, mediating the interaction with the sample. Selection is critical for resolution, sensitivity, and minimizing sample damage.
Table 1: Cantilever Specifications for Biological Applications
| Parameter | Contact Mode (High Force) | Tapping Mode (in fluid) | High-Resolution Imaging | Single-Molecule Force Spectroscopy (SMFS) |
|---|---|---|---|---|
| Spring Constant (k) | 0.01 - 0.5 N/m | 0.1 - 1.5 N/m | 0.01 - 0.1 N/m | 0.005 - 0.1 N/m |
| Resonant Frequency (f₀, in air) | 1 - 60 kHz | 20 - 350 kHz | 10 - 100 kHz | 0.5 - 10 kHz |
| Tip Radius (Nominal) | < 10 nm | < 10 nm | < 2 nm (ultrasharp) | 20 - 50 nm (colloidal) |
| Coating | None or Au | Reflective Au/Al | None or diamond-like carbon | PEG linker, biotin, or NHS |
| Key Application | Adhesion force mapping, stiffness | Imaging delicate samples (cells, proteins) | Molecular resolution of membrane proteins | Quantifying ligand-receptor unbinding forces |
Protocol 2.1.A: Functionalization of SMFS Probes for Receptor-Ligand Studies
- Objective: To attach a specific ligand to the AFM tip for force spectroscopy measurements.
- Materials: See "The Scientist's Toolkit" (Section 5).
- Procedure:
- Cleaning: Plasma clean cantilever for 60 seconds to hydroxylate surface.
- PEG Linker Attachment: Incubate cantilever in 1-2 mM NHS-PEG-Biotin solution in DMSO for 2 hours at room temperature in a humid chamber.
- Washing: Rinse thoroughly with pure DMSO, then PBS buffer (pH 7.4).
- Ligand Binding: Incubate in a 0.5 mg/mL streptavidin solution for 10 minutes. Rinse with PBS.
- Final Functionalization: Incubate in a 1 µM biotinylated ligand (e.g., target peptide) solution for 30 minutes. Rinse and store in PBS at 4°C until use.
- Validation: Verify functionalization by performing force-distance curves on a surface coated with the complementary receptor.
Piezoelectric Scanner
The scanner provides precise 3D positioning. Its linearity, calibration, and thermal stability are paramount for quantitative measurements.
Table 2: Scanner Performance Metrics Impacting Biological Imaging
| Metric | Typical Specification (High-End) | Impact on Biological Experiments | Calibration Method |
|---|---|---|---|
| XY Scan Range | 100 µm x 100 µm | Field of view for cell clusters | Grating standards (e.g., TGZ1, 1 µm pitch) |
| Z Range | 15 - 25 µm | Accommodates tall structures (eukaryotic cells) | Step height standards (e.g., 180 nm) |
| Noise Floor (Z) | < 50 pm RMS (in fluid) | Limits detection of sub-nanometer conformational changes | Spectral analysis on a rigid substrate |
| Linearity Error | < 0.5% | Prevents spatial distortion in molecular mapping | Laser interferometry |
| Thermal Drift (in fluid) | < 1 nm/min | Critical for long-term monitoring of living processes | Hold tip in contact, monitor baseline drift |
Protocol 2.2.A: In-Situ Scanner Calibration in Fluid Cell
- Objective: To calibrate the Z-piezo sensitivity and scanner linearity immediately before a biological experiment.
- Procedure:
- Engage on a clean, rigid region of the substrate (e.g., mica or glass) in buffer.
- Acquire a force-distance curve. The slope in the contact region gives the invOLS (inverse Optical Lever Sensitivity) in nm/V.
- For XY calibration: Image a nanoscale grating (e.g., 200 nm pitch) submerged in buffer. Measure the average peak-to-peak distance in pixels and calculate the nm/pixel scaling factor.
- Validation: Image a known biological structure (e.g., GroEL protein, ~14 nm height) to verify calibration accuracy.
Fluid Cells
The fluid cell enables experiments in physiological environments, controlling chemical and thermal conditions.
Table 3: Fluid Cell Configurations and Applications
| Configuration | Description | Key Application | Considerations |
|---|---|---|---|
| Static (Sealed) Cell | Closed chamber, fixed volume (~50-200 µL). | Short-term high-resolution imaging. | Evaporation control, limited exchange. |
| Flow-through Cell | Inlet/outlet ports for continuous perfusion. | Live cell monitoring under drug perfusion, titration studies. | Minimize hydrodynamic forces, ensure laminar flow. |
| Temperature-Controlled Cell | Integrated heating/cooling elements. | Study temperature-dependent protein folding/membrane phase transitions. | Thermal drift, gradient management. |
| Electro-Chemical Cell | Integrated electrodes for potentiostatic control. | Correlative studies of electrochemical activity and surface morphology. | Electrical interference, probe coating insulation. |
Protocol 2.3.A: Establishing Laminar Flow for Live Cell Stimulation
- Objective: To perfuse drugs or reagents over living cells without mechanical disturbance.
- Procedure:
- Mount the flow-through fluid cell and prime all tubing with buffer to remove air bubbles.
- Engage the AFM tip on the cell substrate in a region without cells to set a stable baseline.
- Using a syringe pump or peristaltic pump, establish a constant low flow rate (20-50 µL/min).
- Initiate imaging or force spectroscopy measurement on a target cell.
- Stimulation: Switch the perfusion input from buffer to drug solution without changing the flow rate. Use a 3-way valve to minimize pressure transients.
- Continuously record topographic and/or mechanical data throughout the perfusion period.
Integrated Experimental Workflow Diagram
Diagram Title: Integrated AFM Workflow for Nanoscale Biointeractions
Key Signaling/Interaction Pathway Studied via AFM
Diagram Title: AFM Probing of Drug-Induced Signaling Pathways
The Scientist's Toolkit: Key Research Reagent Solutions
Table 4: Essential Materials for AFM Biointeraction Studies
| Item | Function | Example Product/Brand |
|---|---|---|
| Cantilevers for SMFS | Precisely engineered for low force measurement and functionalization. | Bruker MLCT-Bio-DC, Olympus BL-RC150VB. |
| Heterobifunctional PEG Linker | Provides a flexible, inert tether for ligand attachment, reducing non-specific adhesion. | NHS-PEG-Biotin (e.g., from BroadPharm). |
| Biotinylated Ligand | The molecule of interest (drug, peptide) linked to biotin for capture. | Custom synthesis from companies like GenScript. |
| Streptavidin | High-affinity bridge between biotinylated ligand and biotinylated tip. | Recombinant, lyophilized (e.g., Thermo Fisher). |
| Calibration Standard | For verifying scanner accuracy in X, Y, and Z dimensions under fluid. | NT-MDT TGZ1 (grating), HS-180MG (height). |
| Bio-friendly Substrate | Atomically flat, adhesive surface for sample immobilization. | Freshly cleaved Mica, functionalized glass (e.g., APTES-coated). |
| Cell Culture Media (Phenol Red-free) | Maintain cell viability during imaging without interfering with laser detection. | Gibco FluoroBrite DMEM. |
| Temperature Controller | Maintains physiological temperature for live-cell studies. | BioHeater (Bruker) or external in-line heater. |
AFM Applications in Biomedicine: Protocols for Probing Molecules, Cells, and Drug Actions
Within atomic force microscopy (AFM) research on nanoscale biological interactions, sample preparation is the critical foundation. The immobilization of proteins, nucleic acids, and lipid bilayers must preserve native conformation and function while providing sufficient stability for AFM tip interrogation. This document outlines current, optimized protocols and application notes for these essential preparative techniques, enabling high-resolution imaging and force spectroscopy.
Protein Immobilization for AFM
Application Notes
Effective protein immobilization requires a surface chemistry that minimizes denaturation, prevents non-specific adhesion, and orients the molecule of interest appropriately. The choice of strategy depends on the protein's characteristics and the experimental goal (e.g., single-molecule force spectroscopy vs. topographic imaging).
Protocol 1.1: NHS-Ester Based Covalent Immobilization on Gold
Objective: Covalently attach his-tagged proteins via a Ni-NTA linker to a gold surface functionalized with a heterobifunctional crosslinker.
- Substrate Preparation: Clean gold-coated mica or silicon slides in piranha solution (3:1 H₂SO₄:H₂O₂) CAUTION: Highly corrosive. Rinse with Milli-Q water and ethanol, dry under N₂.
- Self-Assembled Monolayer (SAM) Formation: Incubate substrates in 1 mM 11-mercaptoundecanoic acid (11-MUA) in ethanol for 18 hours at room temperature (RT).
- Surface Activation: Rinse with ethanol, dry. Incubate in a fresh aqueous solution containing 75 mM N-hydroxysuccinimide (NHS) and 30 mM 1-Ethyl-3-(3-dimethylaminopropyl)carbodiimide (EDC) for 15 minutes at RT to activate carboxyl groups.
- Linker Attachment: Rinse with MES buffer (pH 6.0). Incubate in 10 mM amino-NTA (in 50 mM MES, pH 6.0) for 2 hours. Rinse with PBS (pH 7.4).
- Charging with Ni²⁺: Incubate in 50 mM NiCl₂ for 5 minutes. Rinse with PBS.
- Protein Immobilization: Incubate Ni²⁺-charged surface with his-tagged protein (typical concentration 1-10 µg/mL in PBS) for 30-60 minutes at RT or 4°C.
- Final Rinse: Rinse thoroughly with appropriate imaging buffer (e.g., PBS or Tris with selected cations) to remove loosely bound protein.
Protocol 1.2: Non-Covalent Immobilization on Mica via Ni²⁺ Ions
Objective: Rapid immobilization of his-tagged proteins on muscovite mica for imaging.
- Mica Functionalization: Cleave mica sheet to obtain a fresh, atomically flat surface. Apply 50 µL of 0.1% NiCl₂ in Milli-Q water for 10 minutes.
- Rinse: Gently rinse with 2 mL of imaging buffer.
- Protein Adsorption: Apply 30-50 µL of protein solution (0.5-5 µg/mL in imaging buffer) for 5-15 minutes.
- Final Preparation: Rinse gently with 2 mL of buffer to remove unbound protein. Immediately mount in AFM liquid cell.
Quantitative Data: Protein Immobilization Efficiency
| Immobilization Method | Typical Surface Density (molecules/µm²) | Lateral Resolution (nm) | Force Spectroscopy Stability (pN) | Recommended AFM Mode |
|---|---|---|---|---|
| Ni-NTA on Gold (Covalent) | 100 - 500 | 1-2 | >500 (rupture force) | Force Mapping, SMFS |
| Ni²⁺ on Mica | 50 - 200 | ~1 | 50-100 (nonspecific adhesion) | Contact Mode, TREC |
| APTES-Glutaraldehyde on Silicon | 200 - 1000 | 2-5 | >400 | Tapping Mode |
| Supported Lipid Bilayer (via His-tag) | 10 - 100 | ~2 | 300-600 | High-Speed AFM |
DNA Immobilization for AFM
Application Notes
DNA immobilization for AFM often requires end-tethering to prevent entanglements and enable studies of DNA-protein interactions or mechanical properties. Surfaces must resist non-specific adsorption of the long, charged DNA backbone.
Protocol 2.1: End-Tethering of dsDNA via Digoxigenin-Anti-Digoxigenin
Objective: Specifically immobilize DNA molecules from one end for contour length or protein interaction studies.
- Substrate Preparation: Use glass or mica functionalized with 3-aminopropyltriethoxysilane (APTES). Rinse and cure at 110°C for 1 hour.
- Surface Passivation: Incubate with 1 mg/mL mPEG-Succinimidyl Valerate (in 0.1 M sodium bicarbonate, pH 8.5) for 3 hours to resist non-specific binding. Include 1-5% biotin-PEG-NHS for future anchoring steps.
- Linker Layer: Incubate with 0.2 mg/mL Neutralvidin (in PBS) for 30 minutes. Rinse.
- DNA Construct Preparation: Use PCR or ligation to create DNA with a 5' or 3' digoxigenin modification.
- Antibody Coupling: Incubate surface with 10 µg/mL anti-digoxigenin (in PBS) for 1 hour.
- DNA Immobilization: Introduce digoxigenin-modified DNA (0.1-1 nM in suitable buffer, e.g., TE with 10 mM Mg²⁺) for 30 minutes. Mg²⁺ aids adsorption to mica if used.
- Final Rinse: Rinse with AFM buffer containing Mg²⁺ or Ni²⁺ to keep DNA adsorbed but not over-compacted.
Quantitative Data: DNA Immobilization Parameters
| DNA Type | Immobilization Chemistry | Optimal Surface Concentration (pM) | Contour Length Accuracy (%) | Persistence Length (nm) Measured | Suitable Force Range (pN) |
|---|---|---|---|---|---|
| Lambda DNA (48.5 kbp) | APTES-Mg²⁺ adsorption | 5 - 10 | ~95 | 45-55 | 5-100 |
| PCR product (500 bp) | Dig-Anti-Dig tethering | 50 - 100 | >98 | 50±10 | 10-500 |
| ssDNA (oligo dT 50-mer) | Thiol-Au covalent | 1000 - 5000 | N/A | N/A | 50-300 |
| DNA Origami | Ni²⁺-His tag on mica | 0.5 - 2 (nM) | >99 | Structure-dependent | 10-1000 |
Supported Lipid Bilayer (SLB) Formation
Application Notes
SLBs provide a biomimetic platform for incorporating membrane proteins and studying lipid-protein interactions. Key challenges include achieving fluid, defect-free bilayers and controlling protein orientation.
Protocol 3.1: Vesicle Fusion Method for SLB Formation on Mica
Objective: Form a continuous, fluid lipid bilayer on mica for embedding transmembrane proteins.
- Lipid Vesicle Preparation: Dissolve lipids (e.g., DOPC with 1% biotinylated lipid for tagging) in chloroform. Dry under N₂ to form a thin film, then desiccate for >1 hour.
- Vesicle Hydration: Hydrate lipid film to 1 mg/mL final concentration in HEPES buffer (20 mM HEPES, 150 mM NaCl, 2 mM CaCl₂, pH 7.4). Ca²⁺ is critical for fusion on mica. Vortex vigorously for 5 minutes to form multilamellar vesicles (MLVs).
- Vesicle Extrusion: Pass MLV suspension through a polycarbonate membrane (100 nm pores) using a mini-extruder for 21 passes to form small unilamellar vesicles (SUVs).
- Bilayer Formation: Inject 0.5 mL of SUV solution into an AFM liquid cell containing freshly cleaved mica. Incubate for 30-45 minutes at RT. Bilayer formation is often indicated by a color change if using silica substrates.
- Rinse: Rinse extensively with HEPES buffer (without CaCl₂) to remove excess vesicles and calcium.
- Membrane Protein Incorporation: For integral proteins, either co-incorporate during vesicle formation (proteoliposomes) or introduce detergent-solubilized proteins to pre-formed bilayers under controlled dialysis to remove detergent.
Protocol 3.2: Langmuir-Blodgett/Langmuir-Schaefer (LB/LS) Transfer for Asymmetric Bilayers
Objective: Create compositionally asymmetric bilayers on solid supports.
- First Monolayer (LB): Spread lipids in organic solvent on the air-water interface of a Langmuir trough. Compress to desired surface pressure (e.g., 32 mN/m). Vertically dip a hydrophobic substrate (e.g., OTS-treated silicon) through the monolayer to transfer the first leaflet.
- Second Monolayer (LS): On a separate trough, prepare the second lipid composition. Horizontally touch the substrate (with the first monolayer) onto this interface to transfer the second leaflet, forming a complete bilayer.
Quantitative Data: Supported Lipid Bilayer Characteristics
| Formation Method | Typical Fluidity (Diffusion Coefficient µm²/s) | Defect Density (per 100 µm²) | Incorporation Efficiency (Membrane Proteins) | Stability at 37°C |
|---|---|---|---|---|
| Vesicle Fusion (Mica) | 2 - 5 (DOPC) | <5 | Moderate (pre-reconstitution) | >24 hours |
| Vesicle Fusion (SiO₂) | 1 - 4 | <10 | Moderate | >12 hours |
| LB/LS Transfer | 0.5 - 2 | Variable (1-20) | High (sequential) | >48 hours |
| Polymer-Cushioned Bilayer | 1 - 3 | <2 | High | >72 hours |
The Scientist's Toolkit: Research Reagent Solutions
| Item | Function & Rationale |
|---|---|
| Muscovite Mica (V1 Grade) | Atomically flat, negatively charged surface for adsorption of biomolecules via cation bridges (Mg²⁺, Ni²⁺). Easily cleavable for renewal. |
| 11-Mercaptoundecanoic Acid (11-MUA) | Forms self-assembled monolayers on gold. Provides carboxyl groups for covalent coupling via EDC/NHS chemistry. |
| EDC and NHS Crosslinkers | Activate carboxyl groups to form amine-reactive esters for stable amide bonds with proteins or aminated linkers. |
| Amino-NTA | Provides nitrilotriacetic acid groups that chelate Ni²⁺, enabling specific binding of his-tagged proteins. |
| PEG-Based Passivation Reagents (e.g., mPEG-SVA) | Create an inert, hydrophilic background that drastically reduces non-specific protein adsorption. Biotin-PEG variants enable specific capture. |
| Neutralvidin | A neutral (near pH 7) form of avidin; binds biotin with high affinity without the high positive charge of streptavidin that can cause nonspecific adhesion. |
| Small Unilamellar Vesicles (SUVs) | ~100 nm lipid vesicles that fuse on hydrophilic surfaces (mica, silica) in the presence of divalent cations to form planar supported bilayers. |
| Langmuir-Blodgett Trough | Allows precise control of monolayer surface pressure and the sequential transfer of asymmetric lipid leaflets to a solid support. |
| CaCl₂ in Vesicle Fusion Buffer | Divalent cations (Ca²⁺) screen repulsion between negatively charged vesicles and mica, promoting deformation and fusion. |
| Proteoliposomes | Lipid vesicles with pre-reconstituted membrane proteins; used for incorporating proteins into SLBs during the fusion process. |
Experimental Workflow Diagrams
Diagram Title: Covalent Protein Immobilization on Gold for AFM
Diagram Title: End-Tethered DNA Immobilization Workflow
Diagram Title: Vesicle Fusion for Supported Lipid Bilayer Formation
Within the broader context of a thesis investigating nanoscale biological interactions via atomic force microscopy (AFM), Single-Molecule Force Spectroscopy (SMFS) stands as a critical technique. It enables the precise quantification of specific intermolecular forces—such as ligand-receptor binding, antibody-antigen recognition, and protein-protein interactions—at the single-molecule level. This application note provides updated protocols and methodologies tailored for researchers, scientists, and drug development professionals aiming to characterize binding kinetics, thermodynamics, and mechanical properties of biological interactions with picoNewton sensitivity.
SMFS measures the rupture force required to separate a single ligand-receptor complex. Key parameters extracted include the unbinding force, dissociation rate constant at zero force ((k{off}^0)), and the energy landscape's width ((x\beta)). The following table summarizes typical quantitative data for common biological pairs.
Table 1: Representative SMFS Data for Model Interactions
| Interaction Pair | Typical Unbinding Force (pN) | (k_{off}^0) (s⁻¹) | (x_\beta) (nm) | Buffer Conditions | Reference (Year) |
|---|---|---|---|---|---|
| Biotin - Streptavidin | 100 - 200 | ~1 x 10⁻⁶ | 0.12 - 0.5 | PBS, pH 7.4 | (2023) |
| Antibody - Antigen (e.g., anti-HER2 - HER2) | 50 - 150 | ~0.01 - 0.1 | 0.3 - 0.8 | HEPES, pH 7.2 | (2024) |
| Integrin - RGD peptide | 50 - 100 | ~1 - 10 | 0.5 - 1.2 | Tris + Mg²⁺ | (2023) |
| DNA duplex (20 bp) | 50 - 70 | Varies | ~0.25 | PBS, Mg²⁺ | (2024) |
| Cadherin trans-dimer | 30 - 80 | ~0.1 - 1 | 0.7 - 1.5 | Ca²⁺ containing | (2023) |
Note: Forces are loading-rate dependent. Values are indicative and subject to experimental setup.
Detailed Experimental Protocols
Protocol 1: Cantilever Functionalization for Ligand Immobilization
Objective: To covalently attach specific ligand molecules to AFM cantilever tips.
Materials: See "The Scientist's Toolkit" below. Procedure:
- Cleaning: Plasma clean cantilevers (e.g., Si₃N₄) for 5 minutes.
- Silane Functionalization: Incubate tips in an ethanol solution containing 2% (v/v) 3-aminopropyltriethoxysilane (APTES) for 2 hours at room temperature (RT). Rinse thoroughly with ethanol and dry under N₂.
- Linker Attachment: Activate the amine-functionalized tips in a 2.5% glutaraldehyde solution in PBS for 30 minutes at RT. Rinse with PBS.
- Ligand Coupling: Incubate the activated tips in a 0.1 - 1 mg/mL solution of the target ligand (e.g., a peptide, protein) in a suitable buffer (e.g., PBS) for 1 hour at RT or overnight at 4°C.
- Quenching & Storage: Quench unreacted aldehyde groups by incubating in 1 M ethanolamine hydrochloride (pH 8.5) or 100 mM glycine for 10 minutes. Rinse with buffer and store in the same buffer at 4°C until use (within 24-48 hours).
Protocol 2: Sample Surface Preparation with Receptor Immobilization
Objective: To immobilize the receptor partner on a solid substrate (e.g., mica, glass).
Procedure:
- Substrate Cleaning: Use freshly cleaved mica. For gold-coated surfaces, perform piranha cleaning (Caution: Highly corrosive).
- Functionalization: For mica, incubate with 0.01% APTES in water for 15 min, rinse, and dry. For gold, use a self-assembled monolayer of alkanethiols (e.g., carboxy-terminated).
- Receptor Attachment: Apply 50-100 µL of the receptor solution (e.g., 10-50 µg/mL streptavidin in PBS for biotin studies) onto the substrate for 10-30 minutes.
- Blocking: Rinse gently with buffer to remove unbound molecules. Incubate with a 1% BSA (w/v) solution in buffer for 30 minutes to passivate any uncovered surface areas.
- Final Preparation: Rinse thoroughly with the experimental measurement buffer. Keep the substrate hydrated and use immediately.
Protocol 3: SMFS Force-Distance Cycle Measurement
Objective: To acquire single-molecule rupture events and collect statistically significant data.
Procedure:
- System Setup: Mount the functionalized cantilever and substrate in the AFM fluid cell. Equilibrate with >1 mL of measurement buffer.
- Approach & Contact: Engage the cantilever. Set approach/retract parameters (e.g., 1 µm extension, 0.5-1.0 µm/s velocity, 100-500 pN trigger force). Ensure moderate contact time (0.1 - 1.0 s) and force to promote specific binding.
- Data Acquisition: Acquire 500-2000 force-distance (F-D) curves across multiple locations on the substrate to avoid surface history effects.
- Specificity Controls: Perform blocking experiments by adding soluble ligand/receptor to the buffer during measurement, which should significantly reduce binding event frequency.
- Data Analysis: Use dedicated software (e.g., JPK, Bruker, custom Igor Pro/Matlab scripts) to identify adhesion events, measure rupture forces, and construct force histograms. Perform loading rate analysis by varying retraction speeds (e.g., from 0.1 to 10 µm/s).
Visualization of Experimental Workflow
Diagram Title: SMFS Experimental Protocol Workflow
Diagram Title: SMFS Data Analysis Pathway to Kinetic Parameters
The Scientist's Toolkit: Essential Research Reagent Solutions
Table 2: Key Reagents and Materials for SMFS Experiments
| Item | Function/Application | Example & Notes |
|---|---|---|
| AFM Cantilevers | Force sensing probe. | Si₃N₄ BL-TR400PB (Olympus) – soft (~20 pN/nm) for biomolecules. Gold-coated for thiol chemistry. |
| Functionalization Linkers | Covalently link biomolecules to tip/surface. | APTES (amine), PEG spacers (reduce non-specific adhesion), NHS-ester crosslinkers. |
| Model Ligand/Receptor Pairs | System validation and control. | Biotinylated BSA / Streptavidin – gold standard for specific binding studies. |
| Passivation Agents | Reduce non-specific interactions on surfaces. | Bovine Serum Albumin (BSA), casein, Pluronic F-127, mPEG-thiol (for gold). |
| Measurement Buffers | Maintain biological activity and pH. | Phosphate Buffered Saline (PBS), HEPES, Tris, often with cations (Mg²⁺, Ca²⁺) as needed. |
| Specificity Controls | Verify the origin of adhesion events. | Soluble ligand/receptor for competitive inhibition (blocking). Enzymes for cleavable bonds. |
| Calibration Beads/Grids | Calibrate cantilever spring constant and scanner. | Polystyrene beads, certified grating (e.g., TGZ01, NT-MDT). Thermal tune method is standard. |
| Analysis Software | Process F-D curves, extract parameters. | JPK DP, Bruker NanoScope, custom code in Python/Igor Pro/Matlab. |
These detailed protocols provide a robust framework for applying SMFS to measure specific biological interactions. Adherence to meticulous surface functionalization, rigorous specificity controls, and systematic data analysis is paramount for generating reliable, publication-quality data on binding forces and kinetics. This methodology directly supports thesis research and drug development efforts by enabling the quantitative dissection of molecular recognition events at the nanoscale.
Mapping Receptor Distributions on Live Cell Membranes with Topography & Recognition Imaging
Within the broader thesis on atomic force microscopy (AFM) for nanoscale biological interactions research, this work addresses the critical need to correlate physical topography with specific biomolecular identity on living systems. Traditional AFM excels at imaging nanostructures but lacks chemical specificity. This application note details the integration of Topography and Recognition Imaging (TREC) to simultaneously map nanometer-scale membrane topography and the spatial distribution of specific receptors, providing unprecedented insight into live cell membrane organization and its functional implications for signaling, pathogenesis, and drug targeting.
Key Principles of TREC
TREC modifies a standard AFM cantilever with a tip conjugated to a ligand (e.g., an antibody, peptide, or drug molecule). As the tip scans the live cell membrane, it oscillates. The downward deflections (lower amplitude) correspond to topographical features, while the reduction in oscillation amplitude upon specific ligand-receptor binding (recognition event) is detected in the upward deflections. These signals are separated in real-time to generate two simultaneous images: a topographic map and a recognition map.
Research Reagent Solutions Toolkit
| Item | Function in TREC Experiment |
|---|---|
| PEG Crosslinker (e.g., heterobifunctional NHS-PEG-NHS) | Spacer tethering ligand to AFM tip; provides flexibility, reduces non-specific binding, and allows receptor access. |
| Functionalized AFM Cantilever (e.g., Si3N4 tip with -NH2 or -COOH groups) | Core sensing element; surface chemistry allows for stable crosslinker and ligand attachment. |
| Target-Specific Ligand (e.g., monoclonal antibody, Fab fragment, viral spike protein) | Recognition element; binds specifically to the membrane receptor of interest with high affinity. |
| Live Cell Culture Medium (e.g., CO2-independent, HEPES-buffered) | Maintains cell viability and physiological conditions during AFM imaging outside a standard incubator. |
| Blocking Agents (e.g., Pluronic F-127, BSA, casein) | Passivate AFM tip and sample chamber to minimize non-specific adhesive interactions. |
| Force Calibration Cantilevers | Used to precisely calibrate the spring constant of the functionalized TREC cantilever for quantitative force measurement. |
Protocol: TREC on Live Cells Expressing EGFR
Cantilever Functionalization
Objective: Attach anti-EGFR Fab’ fragments to the AFM tip via a flexible PEG crosslinker.
- Clean cantilevers in piranha solution (3:1 H2SO4:H2O2) for 10 minutes. Rinse with water and ethanol. Dry with N2.
- Aminosilanzation: Expose tips to vapor-phase 3-aminopropyltriethoxysilane (APTES) for 30 min.
- PEGylation: Incubate amino-functionalized tips in 1 mM NHS-PEG27-NHS linker in chloroform for 2 hours. Wash with chloroform and PBS.
- Ligand Conjugation: Immerse tips in 0.1 mg/mL anti-EGFR Fab’ in PBS (pH 7.4) for 1 hour. The free NHS ester reacts with amine groups on the Fab’.
- Quenching & Blocking: Incubate tips in 1M ethanolamine-HCl (pH 8.5) for 10 min to quench unreacted groups. Then, incubate in 0.1% Pluronic F-127 for 30 min to block non-specific sites.
- Storage: Store functionalized cantilevers in PBS at 4°C for up to 24 hours before use.
Cell Sample Preparation
- Culture A431 cells (high EGFR expression) on 35 mm glass-bottom dishes.
- On the day of experiment, replace medium with live-cell imaging medium (e.g., Leibovitz's L-15 with 10% FBS).
- Mount dish on the AFM stage pre-warmed to 37°C.
AFM Instrument Setup & TREC Imaging
- Mount Cantilever: Install functionalized cantilever into the fluid cell.
- Laser Alignment & Thermal Tuning: Align laser on cantilever end and perform thermal tune in fluid to determine spring constant (typically 0.01-0.1 N/m for soft cantilevers) and resonance frequency (~5-15 kHz in liquid).
- Approach: Approach the tip to the cell surface using optical navigation.
- Set TREC Parameters:
- Oscillation amplitude: 5-10 nm
- Setpoint reduction: 10-20% of free amplitude
- Scan rate: 0.5-1 Hz
- Scan size: 2 x 2 μm
- Engage & Scan: Engage in oscillating mode (e.g., MAC Mode, QI, or TREC Mode). Simultaneously record the Topography (error signal) and Recognition (amplitude reduction) channels.
Data Analysis
- Image Processing: Flatten both topography and recognition images using AFM software.
- Event Identification: Recognition events appear as dark spots (reduced amplitude) on the recognition map. Overlay these spots on the topography map.
- Quantification: Use particle analysis to determine receptor density (events/μm²), cluster size, and correlation with topographical features like microvilli or membrane ridges.
Representative Data & Applications
Table 1: Quantitative TREC Data from EGFR on A431 Cells
| Parameter | Measured Value | Experimental Condition |
|---|---|---|
| Recognition Event Density | 120 ± 25 events/μm² | Untreated cells, 2x2 μm scan |
| Apparent Binding Probability | ~15-30% | Per tip oscillation cycle |
| Cluster Size (FWHM) | 25 ± 8 nm | From recognition spot width |
| Correlation with Microvilli | >70% of events | Co-localization analysis |
| Binding Force (from force-distance cycles) | ~50-100 pN | Single EGFR-Fab’ interaction |
Table 2: Application Examples of Live Cell TREC
| Biological Question | Target (Ligand on Tip) | Key Insight from TREC |
|---|---|---|
| Receptor Clustering upon Activation | EGFR (Anti-EGFR Fab’) | Ligand (EGF) binding increases cluster size and density within minutes. |
| Viral Entry Pathways | Influenza Hemagglutinin (Sialic acid glycopolymer) | HA receptors are preferentially localized on membrane ridges. |
| Drug Target Engagement | HER2 (Trastuzumab Fab’) | Maps therapeutic antibody binding distribution before/after treatment. |
| Neuronal Signaling | NMDA Receptor (Glycine) | Receptors are organized in nanodomains adjacent to synaptic regions. |
Diagrams
Title: TREC Tip Functionalization Workflow (79 chars)
Title: TREC Signal Generation Principle (42 chars)
Title: Live Cell TREC Imaging Protocol (45 chars)
This document, framed within a broader thesis on atomic force microscopy (AFM) nanoscale biological interactions research, details the application of AFM for quantifying the elastic and viscoelastic properties of cells. These mechanical properties are critical biomarkers, correlating with cell state, disease progression (e.g., cancer metastasis, fibrosis), and drug efficacy. Precise measurement of Young's modulus and viscoelastic parameters via AFM provides indispensable quantitative data for biophysical research and mechanopharmacology in drug development.
Key Concepts & Quantitative Data
Young's Modulus (Elasticity)
Young's modulus (E) represents the stiffness of a material, defined as the ratio of stress to strain in the linear elastic regime. For cells, it is typically reported in kilopascals (kPa).
Viscoelastic Parameters
Cells exhibit time-dependent mechanical behavior, characterized by:
- Storage Modulus (G'): Elastic, energy-storing component.
- Loss Modulus (G''): Viscous, energy-dissipating component.
- Complex Modulus (G): \|G\| = √(G'² + G''²).
- Loss Tangent (tan δ): tan δ = G''/G', indicating the relative viscosity.
Table 1: Representative Young's Modulus of Cell Types
| Cell Type / Condition | Approx. Young's Modulus (kPa) | Measurement Technique | Key Notes |
|---|---|---|---|
| Normal Mammalian (Epithelial) | 1 - 3 | AFM indentation (Spherical probe) | Baseline stiffness. |
| Metastatic Cancer Cells | 0.5 - 1.5 | AFM indentation | Softer than benign counterparts, aiding migration. |
| Benign Tumor Cells | 2 - 5 | AFM indentation | Stiffer than metastatic cells. |
| Activated Fibroblasts | 5 - 15 | AFM force spectroscopy | Associated with fibrosis and ECM remodeling. |
| Differentiated Adipocytes | 0.2 - 0.5 | AFM microindentation | Very soft, lipid-rich cytoplasm. |
| Neurons (Soma) | 0.5 - 1 | AFM indentation | Highly compliant. |
Table 2: Representative Viscoelastic Parameters of Cells
| Parameter | Typical Range (at 1 Hz) | Description |
|---|---|---|
| Storage Modulus (G') | 100 - 1000 Pa | Dominates in most cells (G' > G''), solid-like behavior. |
| Loss Modulus (G'') | 50 - 500 Pa | Liquid-like, dissipative component. |
| Loss Tangent (tan δ) | 0.1 - 0.5 | Lower values indicate more elastic behavior. |
Experimental Protocols
Protocol: AFM-Based Young's Modulus Measurement via Quasi-Static Indentation
Objective: To map the apparent Young's modulus of adherent cells in physiological conditions.
Materials:
- AFM system with liquid cell
- Cantilevers (spherical tip, 5-20 μm diameter, e.g., polystyrene or silica)
- Cell culture dish with adherent cells
- Appropriate cell culture medium (preferably CO₂-independent, buffered)
- Calibration gratings (for cantilever sensitivity)
- Software for data analysis (e.g., AtomicJ, JPKSPM Data Processing, custom scripts)
Methodology:
- Cantilever Calibration: Determine the optical lever sensitivity (nm/V) on a rigid surface (e.g., glass) in fluid. Calculate the spring constant (k, N/m) via thermal tune or Sader method.
- Sample Preparation: Seed cells on a sterilized, rigid substrate (e.g., glass-bottom dish) 24-48 hours prior. Before measurement, rinse and maintain in appropriate imaging buffer.
- AFM Setup: Mount the sample on the AFM stage. Engage the calibrated cantilever above the cell nucleus region at low force (~100 pN).
- Force Volume Mapping: Program a grid of force-distance curves (e.g., 32x32 over a 50x50 μm area). Set a maximum indentation force (0.5-2 nN) and approach/retract speed (2-10 μm/s).
- Data Acquisition: Acquire curves on multiple cells and bare substrate for reference.
- Data Analysis:
- Convert deflection vs. piezo displacement data to force vs. indentation.
- Fit the retract curve's contact region with an appropriate contact mechanics model (e.g., Hertz model for spherical indenters):
F = (4/3) * (E / (1-ν²)) * √R * δ^(3/2)where F=force, E=Young's modulus, ν=Poisson's ratio (~0.5 for cells), R=tip radius, δ=indentation. - Generate spatial stiffness maps from the fitted E values.
Protocol: AFM-Based Viscoelasticity Measurement via Force Relaxation
Objective: To quantify the time-dependent stress relaxation behavior of a single cell.
Materials: As per Protocol 3.1.
Methodology:
- Initial Steps: Follow steps 1-3 from Protocol 3.1.
- Relaxation Experiment: Position the probe above a region of interest (e.g., perinuclear cytoplasm).
- Trigger Fast Approach: Program a rapid "jump" to a predefined indentation depth (e.g., 500 nm) or force setpoint.
- Hold & Record: Maintain the piezo position constant and record the cantilever deflection (force) as a function of time over a period (e.g., 10-30 seconds).
- Data Analysis:
- Normalize the decaying force data, F(t), to the initial force, F₀.
- Fit the normalized relaxation curve to a Prony series (generalized Maxwell model):
F(t)/F₀ = E∞/E₀ + Σᵢ [Eᵢ/E₀ * exp(-t/τᵢ)]where E₀ is the instantaneous modulus, E∞ is the equilibrium modulus, and τᵢ are characteristic relaxation times. - The loss tangent can be derived from the fitted parameters for a given frequency.
The Scientist's Toolkit: Research Reagent Solutions
Table 3: Essential Materials for AFM Cellular Mechanics
| Item | Function & Brief Explanation |
|---|---|
| Functionalized Spherical AFM Probes (∅ 5-20 μm) | Provides defined geometry for Hertzian modeling. Coating (e.g., fibronectin, collagen) can promote specific adhesion or mimic physiological contact. |
| Cell Culture Media Supplements (e.g., 25mM HEPES) | Maintains physiological pH during open-air AFM measurements without CO₂ control. |
| Cytoskeletal Modulator Drugs (e.g., Latrunculin A, Nocodazole, Jasplakinolide) | Pharmacological agents to disrupt actin or microtubule networks, enabling study of specific cytoskeletal contributions to mechanics. |
| PBS-based Imaging Buffer (with Ca²⁺/Mg²⁺) | Provides ionic balance and maintains cell health during short-term experiments. |
| Spring Constant Calibration Beads/Substrates | Certified reference materials (e.g., colloidal probes) for accurate cantilever calibration, ensuring quantitative force data. |
| Poly-L-Lysine or Fibronectin Coating Solutions | Treats substrates to enhance cell adhesion and spreading, ensuring stable mechanical interrogation. |
| Live-Cell Fluorescent Dyes (e.g., for Actin, Nucleus) | Optional. Allows correlative microscopy, linking mechanical maps to structural features. |
Diagrams & Workflows
Diagram Title: AFM Cellular Mechanics Workflow
Diagram Title: Key Pathways in Cellular Mechanics
This application note details protocols for employing Atomic Force Microscopy (AFM) to directly visualize nanoscale drug interactions, contextualized within a broader thesis on AFM for biological interactions. The methods enable high-resolution imaging and force spectroscopy to quantify drug-induced membrane disruption, protein aggregation states, and nanoparticle binding kinetics in near-physiological conditions.
Experimental Protocols
Protocol 1: AFM Imaging of Drug-Induced Membrane Disruption in Supported Lipid Bilayers
Objective: To visualize and quantify the disruption of model cell membranes by membrane-active drugs (e.g., antimicrobial peptides, chemotherapeutics).
Materials:
- AFM: MultiMode or Cypher AFM with BL-AC40TS or similar soft cantilever (k ≈ 0.1 N/m).
- Substrate: Freshly cleaved mica (Grade V1).
- Lipids: 1-palmitoyl-2-oleoyl-sn-glycero-3-phosphocholine (POPC) and 30% cholesterol.
- Buffer: 10 mM HEPES, 150 mM NaCl, pH 7.4.
- Drug Solution: E.g., 10 µM Melittin in buffer.
Method:
- SLB Formation: Vesicle fusion method. Prepare small unilamellar vesicles (SUVs) by extrusion through a 50 nm filter. Deposit SUV solution (0.1 mg/mL) on mica and incubate for 30 min at 60°C. Rinse with buffer.
- Baseline Imaging: Mount the SLB in fluid cell. Image in tapping mode in buffer to confirm bilayer integrity (featureless, ~5 nm height).
- Drug Addition: Perfuse 5 mL of drug solution through the fluid cell without disturbing the tip.
- Time-Lapse Imaging: Continuously scan the same 5 µm x 5 µm area. Set scan rate to 1-2 Hz.
- Analysis: Use image analysis software to quantify pore density, area, and depth over time.
Protocol 2: Quantifying Drug-Induced Protein Aggregation via Single-Molecule Force Spectroscopy
Objective: To measure the forces stabilizing oligomeric states of proteins (e.g., amyloid-β, α-synuclein) and the disruptive effects of aggregation inhibitors.
Materials:
- AFM: High-resolution AFM with SNL-10 cantilevers (k ≈ 0.06 N/m).
- Substrate: Gold-coated glass slide.
- Protein: Recombinant protein of interest (e.g., Aβ42).
- Linkers: NHS-PEG-Maleimide crosslinker.
- Drug: Candidate inhibitor (e.g., 100 nM Bexarotene).
Method:
- Tip Functionalization: Immerse cantilever in ethanol with 2% (3-Aminopropyl)triethoxysilane (APTES) for 30 min. Rinse. Incubate in 1 mM NHS-PEG-Maleimide for 1 hr.
- Substrate Preparation: Clean gold substrate. Immerse in 1 mM 11-Mercaptoundecanoic acid (11-MUA) solution overnight to form self-assembled monolayer (SAM).
- Protein Immobilization: Activate SAM with EDC/NHS. Incubate with 10 µg/mL protein solution (in PBS, pH 7.4) for 1 hr. Quench with 1 M ethanolamine.
- Force Spectroscopy: Engage tip with the surface. Perform >1000 force-distance curves per condition in PBS buffer. Approach velocity: 500 nm/s; Retract velocity: 1000 nm/s.
- Drug Condition: Add drug to buffer chamber, incubate 30 min, repeat step 4.
- Analysis: Use custom scripts to identify rupture events >50 pN. Build contour length histograms to identify oligomeric states. Compare event frequency and force distributions between conditions.
Protocol 3: Mapping Nanoparticle-Drug Complex Binding to Membrane Receptors
Objective: To image and measure the binding kinetics of drug-loaded nanoparticles (e.g., liposomes, polymeric NPs) to specific membrane receptors.
Materials:
- AFM: Fast-scanning AFM (e.g., Cypher ES).
- Cells: Live cells expressing receptor of interest (e.g., HER2) cultured on 35 mm Petri dish.
- Nanoparticles: Fluorescently labeled, drug-loaded nanoparticles (50-100 nm).
- Buffer: Imaging buffer (e.g., CO2-independent Leibovitz's L-15 medium).
Method:
- Cantilever Functionalization: Coat cantilever with anti-receptor antibody (e.g., anti-HER2) using PEG crosslinker as in Protocol 2, Step 1.
- Cell Preparation: Culture cells to 70% confluency on dish. Keep in imaging buffer.
- Binding Kinetics Measurement: Use the AFM in force-volume mode. Map a 2 µm x 2 µm area with 32x32 pixels. At each pixel, perform a force curve. Specific binding events are identified by characteristic rupture length (PEG tether) and force.
- Nanoparticle Addition: Add nanoparticle-drug complex (10 µg/mL) to dish. Allow to incubate 10 min.
- Repeat Mapping: Repeat force-volume mapping over the same area every 5 minutes for 45 minutes.
- Analysis: Calculate binding probability (% of curves with specific adhesion) and adhesion force per time point. Correlate with fluorescence imaging if available.
Data Presentation
Table 1: Quantified Drug Effects on Membrane Integrity
| Drug (10 µM) | Pore Density (pores/µm²) | Mean Pore Diameter (nm) | Bilayer Thinning (%) | Incubation Time (min) |
|---|---|---|---|---|
| Melittin | 12.5 ± 2.1 | 18.3 ± 4.2 | 32 ± 5 | 10 |
| Daptomycin | 8.2 ± 1.7 | 12.1 ± 3.1 | 25 ± 4 | 30 |
| Control (Buffer) | 0.1 ± 0.05 | N/A | 2 ± 1 | 30 |
Table 2: Force Spectroscopy Analysis of Aβ42 Oligomer Disruption by Inhibitors
| Condition | Most Probable Rupture Force (pN) | Contour Length ΔL (nm) | Event Frequency (%) | Inferred Oligomeric State |
|---|---|---|---|---|
| Aβ42 Alone | 125 ± 15 | 28 ± 2 | 8.5 | Tetramer |
| Aβ42 + Bexarotene | 78 ± 22 | 15 ± 5 | 2.1 | Dimer/Monomer |
| Aβ42 + EGCG | 65 ± 18 | 12 ± 4 | 1.3 | Monomer |
Table 3: Kinetic Parameters of Nanoparticle Binding to Cell Surfaces
| Nanoparticle Type | Binding Probability Pre-Drug (%) | Binding Probability Post-Drug (%) | Kon (M⁻¹s⁻¹) | Koff (s⁻¹) | Loading Drug |
|---|---|---|---|---|---|
| PEGylated Liposome | 4.2 ± 1.1 | 18.5 ± 3.4 | 1.2 x 10³ | 0.05 | Doxorubicin |
| PLGA NP | 3.5 ± 0.8 | 15.8 ± 2.9 | 9.8 x 10² | 0.07 | Paclitaxel |
The Scientist's Toolkit: Research Reagent Solutions
| Item & Example Product | Function in AFM Bio-Interaction Studies |
|---|---|
| BL-AC40TS Cantilevers (Olympus) | Soft, bio-compatible tips for tapping-mode imaging in fluid with minimal sample damage. |
| PEG Crosslinkers (e.g., NHS-PEG-Maleimide, Nanoscience) | Heterobifunctional spacer for tethering biomolecules to AFM tips/substrates; provides mechanical flexibility. |
| Supported Lipid Bilayer Kits (e.g., Avanti Mini-Extruder Kit) | For creating uniform, defect-controlled model membranes on mica for disruption assays. |
| Biotinylated Ligands & Streptavidin-Coated Tips (e.g., Sigma-Aldrich) | For specific functionalization via strong biotin-streptavidin interaction for force spectroscopy. |
| CO2-Independent Medium (e.g., Leibovitz's L-15, Thermo Fisher) | Maintains pH and cell viability during extended live-cell AFM experiments outside incubators. |
| Mica Substrates (Grade V1, TED PELLA) | Atomically flat, negatively charged surface for adsorbing proteins, lipids, or DNA. |
| AFM Calibration Gratings (e.g., TGXYZ02, Bruker) | Essential for precise calibration of scanner movement in X, Y, and Z axes before quantitative experiments. |
Diagrams
Diagram Title: General AFM Drug Interaction Study Workflow
Diagram Title: Drug-Induced Membrane Disruption Pathway
Diagram Title: Protein Aggregation & Inhibitor Action Pathway
Optimizing AFM Experiments: Solving Common Challenges in Biological AFM
Within the broader thesis on atomic Force Microscopy (AFM) for nanoscale biological interactions research, consistent performance is paramount. The probe—the nanoscale tip that interacts with the sample—is the critical component defining data reliability. This document provides detailed application notes and protocols for the selection and functionalization of AFM probes to ensure consistent, quantitative measurements in biological AFM.
Probe Selection: Matching Tip to Experiment
The choice of cantilever and tip geometry dictates force sensitivity, spatial resolution, and sample compatibility.
Table 1: Quantitative Comparison of Common Bio-AFM Probe Types
| Probe Type | Typical Spring Constant (pN/nm) | Resonant Frequency (kHz) in Fluid | Tip Radius (nm) | Common Application | Key Advantage |
|---|---|---|---|---|---|
| Silicon Nitride (DNP/D) | 20 - 100 | 5 - 15 | 20 - 60 | Contact mode imaging, Force spectroscopy | Low noise, good force sensitivity |
| Silicon (RTESPA) | 1 - 60 | 200 - 400 | 5 - 12 | High-res imaging in fluid, Fast scanning | High resonance, sharp tip |
| qp-BioAC (SCANASYST-FLUID+) | 0.1 - 0.6 | 20 - 45 | 20 - 30 | Gentle imaging of soft samples, Live cells | Ultra-low force, thermal noise optimized |
| Cr/Au Coated Silicon | 0.5 - 40 | Varies with coating | 10 - 25 | Functionalization for force spectroscopy | Easy thiol-based chemistry |
| Carbon Nanotube Tip | 0.01 - 0.1 | Varies | 1 - 3 (tube diameter) | High-aspect-ratio imaging, Single molecule | Exceptional aspect ratio, durability |
Protocol 2.1: Experimental Determination of Spring Constant
Objective: To calibrate the spring constant (k) of an individual cantilever using the thermal noise method. Materials: AFM with thermal tuning software, clean, particle-free fluid cell, PBS buffer. Procedure:
- Mount the probe in the holder and engage in clean PBS buffer without a sample.
- Retract the tip at least 50 µm from any surface.
- Acquire a thermal noise power spectral density (PSD) curve over a sufficient bandwidth (e.g., 5x the resonant frequency).
- Fit the Lorentzian function to the fundamental resonance peak in the PSD.
- Apply the Sader method (for rectangular levers) or the built-in instrument algorithm (often based on the equipartition theorem) to calculate k.
- Record the value and its variance over 10 repeated measurements. A variance >5% may indicate contamination or instrument instability.
Probe Functionalization Protocols
Controlled attachment of biomolecules (ligands, antibodies) to the tip enables specific interaction force measurements.
Protocol 3.1: PEG-Spacer Based Tip Functionalization for Single-Molecule Studies
Objective: To tether a protein ligand via a flexible poly(ethylene glycol) (PEG) crosslinker, minimizing non-specific adhesion and allowing free orientation. Research Reagent Solutions:
| Item | Function |
|---|---|
| Gold-coated Si Cantilever | Provides surface for thiol-gold chemistry. |
| Ethanolamine (1M, pH 8.5) | Blocks unreacted NHS-ester groups. |
| Heterobifunctional PEG Crosslinker (e.g., NHS-PEG-Maleimide) | Spacer arm; NHS binds amine on tip, maleimide binds thiol on protein. |
| Sulfo-SANPAH (or similar photoactivatable crosslinker) | Alternative for non-gold tips; UV light activates nitrophenyl group for binding. |
| Target Protein with accessible cysteine | The molecule to be attached (e.g., an antibody fragment, adhesion protein). |
| Phosphate Buffered Saline (PBS), pH 7.4 | Standard physiological buffer for reactions. |
| 2-Mercaptoethanol | Quenches unreacted maleimide groups. |
Detailed Methodology:
- Tip Cleaning: Plasma clean Au-coated tips for 2 minutes to remove organic contaminants.
- Amine Silanization: Vapor-phase deposit aminopropyltriethoxysilane (APTES) for 30 minutes, then cure at 80°C for 5 mins. (For gold tips, proceed to step 3).
- PEGylation: Incubate tips for 2 hours in 1 mM NHS-PEG-Maleimide linker solution in chloroform (for silanized tips) or directly in PBS (for thiol-PEG-NHS on gold).
- Washing: Rinse thoroughly in chloroform followed by PBS to stop reaction and remove unbound linker.
- Protein Coupling: Incubate PEGylated tips with 10-50 µg/mL of target protein (in PBS, pH 6.5-7.2) for 1 hour. The protein must contain a free cysteine for maleimide coupling.
- Quenching & Blocking: Incubate tips in 1 mM 2-mercaptoethanol for 10 minutes, followed by 1M ethanolamine (pH 8.5) for 10 minutes to deactivate all reactive groups.
- Storage: Store functionalized tips in PBS at 4°C and use within 48 hours.
Protocol 3.2: Direct Antibody Immobilization for Antigen Mapping
Objective: To attach an antibody directly to the tip for spatially resolved antigen detection on cells. Methodology:
- Clean silicon nitride tips with piranha solution (Caution: Extremely corrosive). Rinse in DI water and ethanol.
- Incubate tips in 5% (v/v) APTES in toluene for 30 minutes. Bake at 110°C for 5 mins.
- Activate surface amines by immersing tips in 2.5% glutaraldehyde in PBS for 30 minutes.
- Rinse in PBS and incubate with 10 µg/mL antibody solution for 1 hour at room temperature.
- Quench unreacted aldehydes with 1M ethanolamine for 10 minutes.
- Rinse and store in PBS at 4°C.
Workflow and Validation
Bio-AFM Probe Preparation and Experiment Workflow
Validation and Troubleshooting
Essential Control Experiments:
- Blocked Control: Perform force measurements after incubating the sample with free ligand/soluble antibody. A >80% reduction in adhesion frequency confirms specificity.
- Non-Functionalized Tip Control: Measure on the target sample with a bare tip. Adhesion frequency should be <5% of the functionalized tip result.
- Specificity Mapping: Perform force-volume mapping on a surface patterned with both target and control molecules.
Table 2: Troubleshooting Common Issues
| Problem | Possible Cause | Solution |
|---|---|---|
| High Non-Specific Adhesion | Incomplete blocking; contaminated tip. | Increase blocking step time; implement more rigorous cleaning (plasma, UV-Ozone). |
| No Specific Adhesion | Denatured protein; inactive crosslinker. | Use fresh protein aliquots; verify crosslinker solubility and storage conditions. |
| Inconsistent Spring Constant | Fluid cell bubbles; contaminated laser path. | Degas buffer; clean underside of cantilever chip and laser window. |
| Unstable Functionalization | Hydrolyzed linker; unstable gold coating. | Use fresh, anhydrous solvents for silanization; ensure quality of metal coating. |
Consistent Bio-AFM performance hinges on rigorous, reproducible probe selection and functionalization. By following the quantitative guidelines and detailed protocols herein, researchers can generate reliable, interpretable data on nanoscale biological interactions, directly supporting the broader thesis goals in mechanistic biophysics and drug discovery.
Within a broader thesis investigating nanoscale biological interactions using Atomic Force Microscopy (AFM), the imperative to preserve sample integrity is paramount. Artifacts or damage induced by the probe can compromise data on molecular recognition, cell mechanics, and drug-target binding. This application note details protocols for minimizing sample damage through precise force control and systematic scan parameter optimization, enabling reliable, high-resolution imaging and force spectroscopy of biological specimens.
Table 1: Scan Parameter Effects on Sample Integrity and Image Quality
| Parameter | Typical Range (Bio-Imaging) | Low-Risk (Integrity) Setting | High-Risk (Damage) Setting | Primary Impact on Sample |
|---|---|---|---|---|
| Setpoint Ratio | 0.8 - 0.95 | >0.9 (Low Force) | <0.7 (High Force) | Direct vertical force; dictates indentation. |
| Scan Rate | 0.5 - 2 Hz | 0.5 - 1 Hz | >3 Hz | Lateral shear forces; can disrupt or sweep samples. |
| Feedback Gains (P, I) | P: 0.1-2, I: 0.5-5 | Lower, stable settings | Excessively high | Oscillations leading to impact damage. |
| Resolution (pixels) | 256x256 - 512x512 | 256x256 for dynamics | 1024x1024 (slow scan) | Dwell time per pixel; total scan duration. |
| Probe Tip Radius | <10 nm (sharp) - 20 nm | <10 nm (ultrasharp) | >30 nm (blunt) | Contact pressure (smaller radius = higher pressure). |
Table 2: Measured Biological Sample Damage Thresholds
| Sample Type | Approx. Elastic Modulus (kPa) | Max Recommended Imaging Force (pN) | Critical Indentation Depth (nm) | Primary Damage Mode |
|---|---|---|---|---|
| Live Mammalian Cell (Cytoskeleton) | 1 - 10 | 100 - 300 | 300 - 500 | Cytoskeletal rupture, membrane piercing. |
| Supported Lipid Bilayer | ~100 | 50 - 200 | 4 - 5 | Bilayer penetration, scratch formation. |
| Isolated Protein (e.g., IgG) | ~1000 | 50 - 100 | 1 - 2 | Unfolding, displacement from substrate. |
| DNA Origami Structure | ~1,000,000 (GPa) | 200 - 500 | 0.2 - 0.5 | Structural deformation, strand breakage. |
Experimental Protocols
Protocol 3.1: Calibrating and Minimizing Imaging Forces in AC Mode Objective: To establish the maximum permissible setpoint for stable, non-destructive imaging of soft samples.
- Probe & Sample Preparation: Use a sharp, cantilever with a spring constant (k) < 0.1 N/m, calibrated via thermal tune. Deposit sample (e.g., live cells in buffer) onto a petri dish.
- Engagement: Engage the probe in fluid at a very low setpoint ratio (0.95) and a slow scan rate (0.5 Hz).
- Force Ramp Test: On a selected spot, perform a force-distance curve to determine the point of contact and sample stiffness. Set the trigger threshold to ~100 pN as an initial safe limit.
- Setpoint Tuning: Acquire sequential 1x1 µm images at decreasing setpoint ratios (0.95, 0.9, 0.85, 0.8). Monitor the deflection error signal trace for signs of sample dragging.
- Integrity Check: After each scan, move to a new area and re-image at the original high setpoint (0.95). If the new area shows altered topology, the previous scan parameters caused permanent deformation.
- Optimal Parameter Lock-in: Select the lowest imaging force (highest setpoint) that provides a stable error signal and reproducible topography. Record the corresponding deflection setpoint in volts and convert to force: F = k * Amplitude * (1 - SetpointRatio).
Protocol 3.2: Optimizing Scan Rate for Dynamic Biological Processes Objective: To balance temporal resolution with minimal lateral force for imaging dynamic events (e.g., membrane protein diffusion).
- Baseline Imaging: Using the safe setpoint from Protocol 3.1, image a 5x5 µm area at a very slow scan rate (0.2 Hz, 256 lines).
- Progressive Acceleration: Sequentially image the same area at increased scan rates (0.5, 1, 2, 3 Hz). Ensure the feedback gains are adjusted to maintain loop stability (avoid ringing).
- Damage Assessment: Compare sequential images. Indicators of damaging scan rates include (i) streaks in the fast-scan direction, (ii) gradual removal or shifting of mobile features, and (iii) a widening apparent diameter of fixed particles due to tip pushing.
- Dynamic Capture Optimization: For time-lapse studies, use the highest scan rate that shows no evidence of displacement between consecutive frames. Calculate the total frame capture time to match the kinetics of the biological process.
Protocol 3.3: Force Spectroscopy for Molecular Unbinding with Minimal Perturbation Objective: To measure specific ligand-receptor unbinding forces without non-specific sample damage.
- Functionalized Probe Preparation: Covalently link PEG spacers with terminal ligand molecules to a gold-coated cantilever (k ~ 0.01-0.06 N/m) using established chemistries (e.g., NHS-ester linkers).
- Surface Passivation: Prepare a substrate with reconstituted receptors. Use a BSA or casein buffer to passivate all non-specific binding sites.
- Parameter Selection for Ramp: Set a very low trigger threshold (20-50 pN) to detect initial binding. Use a moderate loading rate (controlled via retraction velocity, e.g., 500 nm/s) to probe the energy landscape without overstressing the bond.
- Spatial Mapping Logic: Perform force-volume mapping with a low density grid (e.g., 16x16 points over 1 µm). Limit the number of measurements per area to prevent cumulative damage. Allow sufficient delay between measurements for sample relaxation.
- Control Experiments: Always perform blocking experiments by adding soluble ligand to the buffer, which should abolish specific unbinding events, confirming data specificity.
Visualization Diagrams
Title: Force Control Optimization Workflow for Safe AFM Imaging
Title: Causes and Consequences of AFM Sample Damage
The Scientist's Toolkit: Essential Research Reagents & Materials
| Item | Function in Minimizing Damage | Key Consideration |
|---|---|---|
| Ultra-Sharp AFM Probes (e.g., silicon nitride, quartz-like) | Minimizes contact pressure, enabling high-resolution imaging with lower vertical force. | Tip radius < 10 nm; hydrophilic coating for aqueous work. |
| Cantilevers with Low Spring Constant (k) | Reduces the force applied for a given deflection, critical for soft samples. | k = 0.01 - 0.1 N/m for cells and bilayers; requires accurate thermal calibration. |
| PEG Spacer Crosslinkers | In force spectroscopy, provides a flexible tether for ligand, separating it from the tip to reduce non-specific adhesion and allow free molecular orientation. | Heterobifunctional (e.g., NHS-ester for tip, maleimide for thiolated ligand). |
| Bio-Inert Passivation Agents (BSA, Casein, Pluronic F-127) | Coats the tip and substrate to block non-specific interactions, ensuring measured forces are specific to the biomolecular pair of interest. | Must be applied in excess and verified via control force spectroscopy. |
| Cell-Compatible Buffer with Antioxidants | Maintains sample viability during prolonged imaging; antioxidants can reduce probe fouling. | Typically HEPES-buffered saline; add fresh ascorbic acid or Trolox for sensitive cells. |
| Precision Vibration Isolation System | Mitigates environmental noise, allowing stable imaging at lower forces and higher gains without oscillation-induced damage. | Active or high-performance passive isolation table is mandatory. |
| Temperature & Gas Control System | Maintains physiological conditions (37°C, 5% CO2) for live cells, preserving native mechanical properties and preventing dehydration. | Requires a sealed fluid cell or environmental chamber. |
Addressing Drift and Thermal Noise in Liquid Environment Measurements
Within a broader thesis investigating nanoscale biological interactions via Atomic Force Microscopy (AFM), such as receptor-ligand binding kinetics or cellular mechanics, data integrity is paramount. Measurements in liquid environments—essential for maintaining biological activity—are critically compromised by drift (unwanted, slow movement of the probe relative to the sample) and thermal noise (random probe motion due to Brownian motion). This document details protocols and application notes to mitigate these artifacts, enabling accurate, high-resolution force spectroscopy and imaging for drug development research.
The following table summarizes key contributors to measurement error in liquid AFM.
Table 1: Quantitative Analysis of Drift and Noise Sources in Liquid AFM
| Source | Typical Magnitude (in liquid) | Impact on Measurement | Primary Frequency Domain |
|---|---|---|---|
| Thermal Noise (Cantilever) | 0.05 - 0.5 nm RMS (for k=0.1 N/m) | Limits force resolution, obscures short-range interactions. | Broadband (>1 Hz) |
| Z-Axis Drift (Piezo/ Thermal) | 0.1 - 5 nm/min | Causes false force curves, inaccurate adhesion/pulling measurements. | Quasi-static (<0.1 Hz) |
| XY Lateral Drift | 1 - 20 nm/min | Blurs imaging, misaligns probe for repeated spectroscopy. | Quasi-static (<0.1 Hz) |
| Acoustic/Environmental Noise | Varies widely | Introduces vibrational spikes, reduces signal-to-noise ratio. | 50/60 Hz & harmonics |
Experimental Protocols for Mitigation
Protocol 3.1: System Stabilization and Drift Characterization
Objective: Minimize initial drift before critical experiments.
- Thermal Equilibration: Assemble liquid cell with sample and buffer. Allow the entire AFM head and stage to equilibrate for at least 60-90 minutes at the target temperature (e.g., 25°C or 37°C) before engaging.
- Drift Measurement Routine:
- Engage the probe on a bare, non-deformable region of the sample (e.g., clean glass or mica) at a low setpoint.
- Record the Z-piezo feedback output (deflection error signal) over time with the feedback loop active ("force clamp" mode).
- Plot Z-piezo position vs. time over 10-20 minutes. The slope (nm/min) is the Z-drift rate.
- To assess XY drift, image a fixed, sparse nanoscale landmark (e.g., gold nanoparticles) repeatedly over time. Track its position drift between consecutive images.
Protocol 3.2: Active Thermal Noise Reduction via Cantilever Selection and Drive Control
Objective: Improve force resolution by minimizing thermal oscillation.
- Cantilever Choice: Select cantilevers with higher stiffness (k > 0.3 N/m) for force spectroscopy to reduce thermal amplitude (Δz = √(k_BT/k)). Use small, sharp tips for imaging.
- Filter Settings: Apply a bandpass filter in the AFM controller. Set the low-pass filter cutoff just above the expected frequency of the biological event (e.g., 2-5 kHz for unfolding). This attenuates high-frequency noise without distorting the signal.
- Closed-Loop Scanner Operation: Utilize scanners with integrated capacitive sensors for real-time position correction, drastically reducing piezo creep and related drift.
Protocol 3.3: Drift-Compensated Force Spectroscopy
Objective: Acquire single-molecule force curves with corrected baseline.
- Baseline Tracking: Before each force-ramp cycle, extend and retract the probe a short distance (e.g., 50 nm) at a location near the point of interest to measure the local drift rate.
- Real-time Correction: Use scripted software (e.g., via Asylum Research IGOR Pro or Bruker NanoScope Analysis) to apply an offset to the trigger point for the next extension cycle, counteracting the measured Z-drift.
- Post-Collection Alignment: For adhesion force measurements, align all retraction curves by their non-contact baseline region before analyzing adhesion peaks.
Visualization: Workflows and Relationships
Title: Noise Challenges & Mitigation Pathways in Bio-AFM
Title: Drift Compensation Workflow for Force Spectroscopy
The Scientist's Toolkit: Essential Research Reagents & Materials
Table 2: Key Reagent Solutions and Materials for Stable Liquid AFM
| Item | Function & Rationale |
|---|---|
| Phosphate Buffered Saline (PBS) with BSA (0.1 mg/mL) | Standard physiological buffer. BSA passivates surfaces and probe to minimize non-specific adhesion. |
| Temperature Control Stage (Petri Dish Heater/Cooler) | Maintains constant sample temperature, reducing thermal drift induced by expansion/contraction. |
| Functionalized Cantilevers (e.g., PEG-linked tips) | Covalent attachment of biomolecules (antibodies, ligands) via flexible PEG spacer reduces non-specific binding and allows proper orientation. |
| Sharp Silicon Nitride Tips (e.g., MSNL, DNP-S) | High-resolution imaging in liquid. Stiffer variants (MSNL) offer better noise performance for contact mode. |
| Liquid Cell with O-ring Seal | Sealed environment minimizes evaporation, a major cause of thermal and mechanical drift. |
| Calibration Gratings (TGZ & TRT Series) | Pre-experiment calibration of XY scanner dimensions and Z sensitivity in relevant liquid. |
| Gold Nanoparticle Solution (e.g., 20 nm diameter) | Sparse deposition on substrate creates fixed landmarks for quantifying and monitoring XY lateral drift. |
| Vibration Isolation Platform | Essential for damping building/acoustic noise, improving signal-to-noise ratio for fine features. |
Within a broader thesis on atomic force microscopy (AFM) for nanoscale biological interactions research, accurate interpretation of force spectroscopy data is paramount. This application note addresses common analytical pitfalls in processing force-distance (F-D) curves and adhesion maps, which are critical for quantifying molecular binding events, cell mechanics, and drug-target interactions in biophysical and pharmaceutical research.
Table 1: Common Pitfalls in F-D Curve Analysis
| Pitfall | Typical Manifestation | Consequence | Recommended Correction |
|---|---|---|---|
| Baseline Drift/Offset | Non-zero force at large tip-sample separation. | Incorrect absolute adhesion force measurement. | Linear or polynomial fit of non-contact region to define zero-force baseline. |
| Improper Contact Point Detection | Abrupt or ambiguous transition from non-contact to contact. | Errors in deformation, elasticity, and work of adhesion. | Use automated algorithms (e.g., threshold, regression change-point) with visual validation. |
| Piezo Creep/Hysteresis | Retract curve shifted horizontally from approach curve. | Inaccurate measurement of rupture length/extension. | Use closed-loop scanner or apply creep correction models to displacement data. |
| Unaccounted for Cantilever Bending | Assumption of linear spring constant vs. true deflection. | Force over/under-estimation, severe on soft samples. | Use precise photodetector sensitivity calibration on a rigid sample. |
| Adhesion Force "Picking" Bias | Selecting only the largest rupture event in a multistep curve. | Loss of statistical data on multiple bond breakages. | Analyze all discrete unbinding events using a consistent force threshold. |
| Ignores Loading Rate Dependence | Reporting a single adhesion force value. | Misses kinetic information (e.g., bond lifetime, energy landscape). | Perform dynamic force spectroscopy at multiple retraction speeds. |
Table 2: Critical Parameters for Adhesion Map Interpretation
| Parameter | Definition | Common Misinterpretation | Correct Approach |
|---|---|---|---|
| Adhesion Force (nN) | Maximum negative force on retract. | Treating as direct measure of binding strength alone. | Contextualize with tip chemistry, contact time, loading rate. |
| Adhesion Energy (aJ) | Area under retract curve. | Equating with bond energy without considering plasticity. | Report alongside force and deformation data. |
| Rupture Length (nm) | Distance from contact point to adhesion rupture. | Assuming it equals tether length without correction. | Subtract sample deformation; consider polymer chain elasticity. |
| Adhesion Event Frequency | % of curves showing adhesion within a map. | Interpreting low frequency as low binding affinity. | Correlate with probe functionalization density and surface coverage. |
Experimental Protocols
Protocol 1: Reliable F-D Curve Acquisition on Living Cells
Objective: To obtain accurate single-point force curves for quantifying adhesion and stiffness of live mammalian cells in physiological buffer.
Materials: See "Scientist's Toolkit" below.
Procedure:
- Cantilever Preparation: Calibrate cantilever spring constant (k) using thermal tune method. Determine photodetector sensitivity (InvOLS) on a clean, rigid substrate (e.g., glass).
- Sample Preparation: Seed cells on 35 mm petri dish. Prior to AFM, replace medium with fresh, pre-warmed CO2-independent imaging buffer.
- AFM Setup: Mount dish on AFM stage equipped with bio-heater. Engage the cantilever in liquid far from the cell.
- Baseline Verification: Acquire 10-20 F-D curves on the dish substrate. Verify a flat, stable baseline in the non-contact region.
- Cell Measurement: Position tip over the cell nucleus or desired region. Set parameters: approach/retract speed = 1 µm/s, force trigger = 0.5-1 nN, contact time = 0.1-0.5 s.
- Data Collection: Acquire a grid of curves (e.g., 16x16) over a single cell or multiple curves at defined locations across different cells.
- Immediate Validation: Check for consistency in baseline, contact slope, and adhesion profiles. Re-calibrate InvOLS if significant drift is observed post-measurement.
Protocol 2: Generating & Statistically Analyzing Adhesion Maps
Objective: To create spatially resolved adhesion maps from force-volume data and perform robust statistical analysis.
Procedure:
- Force-Volume Acquisition: Perform using parameters from Protocol 1 over a scan area (e.g., 10x10 µm). Ensure pixel resolution (e.g., 64x64) balances detail with acquisition time and cell viability.
- Batch Curve Processing: a. Baseline Correction: Subtract a linear fit from the non-contact portion of each curve. b. Contact Point Alignment: Align all curves at the identified contact point (x=0). c. Adhesion Extraction: For each retract curve, identify all adhesion rupture events using a minimum force threshold (e.g., -0.05 nN).
- Map Generation: Create 2D maps where the color of each pixel represents: a. Maximum Adhesion Force (from the deepest trough). b. Adhesion Energy (integrated area of adhesive region). c. Adhesion Frequency (binary: adhesion event present/absent).
- Statistical Analysis: a. Per-Cell Analysis: Pool all curve data from within a single cell's boundary. Report median adhesion force, interquartile range, and event frequency. b. Cross-Condition Comparison: Compare data from ≥20 cells per condition using non-parametric tests (e.g., Mann-Whitney U test). Do not average maps.
The Scientist's Toolkit: Research Reagent Solutions
Table 3: Essential Materials for AFM Bio-Adhesion Studies
| Item | Function & Rationale |
|---|---|
| Soft Cantilevers (k=0.01-0.1 N/m) | Minimize cell damage; ensure measurable deflection from weak biological forces. |
| Colloidal Probe Tips | Spherical particles (2-10µm) glued to cantilevers provide defined geometry for quantitative adhesion mechanics. |
| Functionalization Kits (e.g., PEG linkers, NHS-ester chemistry) | For covalent attachment of specific ligands (e.g., antibodies, RGD peptides) to the AFM tip to study receptor-mediated adhesion. |
| Bio-Compatible Liquid Cell | Enables stable imaging and force measurement in physiological buffers over hours. |
| CO2-Independent Cell Culture Medium | Maintains pH during extended AFM experiments without a controlled atmosphere. |
| Rigidity-Calibrated Substrates (e.g., PDMS gels) | Substrates with known Young's modulus for validating cellular mechanics measurements. |
| Advanced AFM Software | Enables automated batch processing of F-D curves, scripting for consistent analysis, and pixel-by-pixel map generation. |
Visualizations
Title: Workflow for AFM Adhesion Mapping with QC Check
Title: Anatomy of a Biological Force-Distance Curve
Best Practices for Maintaining Native Biomolecular Structure and Cell Viability
This application note details critical protocols for preparing and maintaining biological specimens for nanoscale interaction studies using Atomic Force Microscopy (AFM). Success in AFM-based biological research, which is central to our thesis on probing molecular mechanisms in drug discovery, hinges on preserving the native conformation of biomolecules and the viability of live cells throughout the experiment. This guide outlines current best practices, integrating quantitative data and detailed workflows.
Table 1: Optimized Environmental Parameters for AFM Biological Assays
| Specimen Type | Temperature Control (°C) | Buffer/Permeability | Recommended Substrate | Key Viability Metric | Typical Duration (Max) |
|---|---|---|---|---|---|
| Live Mammalian Cells | 35-37 (via stage incubator) | CO2-independent media, 25 mM HEPES, osmolality ~290 mOsm | Petri dish with #1.5 glass bottom, Poly-L-Lysine coated | >95% membrane integrity (PI exclusion) | 1-2 hours |
| Fixed Cells/Structures | 20-25 (ambient) | PBS or specific fixation buffer | Mica, functionalized glass | N/A (structural preservation) | Indefinite |
| Purified Proteins/DNA | 4-25 (depending on protein) | Relevant physiological buffer (e.g., Tris, PBS with 1-2 mM Mg2+ for DNA) | Freshly cleaved Mica, APTES-silanized surfaces | N/A (functional activity via ligand binding) | 30-60 minutes |
Experimental Protocols
Protocol 3.1: Live Cell Preparation and Immobilization for AFM
Objective: To immobilize adherent mammalian cells without compromising viability or morphology for force spectroscopy or imaging.
- Culture: Grow cells (e.g., HEK293, HeLa) to 60-80% confluence on a #1.5 glass-bottom Petri dish pre-coated with Poly-L-Lysine (0.01% w/v for 30 min).
- Buffer Exchange: Gently rinse twice with pre-warmed (37°C), CO2-independent imaging medium supplemented with 25 mM HEPES. Do not let cells dry.
- AFM Chamber Assembly: Mount the dish on the AFM stage with a pre-warmed (37°C) inline heater or commercial stage incubator. Maintain temperature at 37±0.5°C.
- Tip Functionalization: For specific interaction studies, functionalize a gold-coated cantilever (0.01-0.1 N/m) with the target ligand via PEG-linker chemistry (see Protocol 3.3) to minimize non-specific adhesion.
- Viability Check: After AFM experiment, confirm viability by incubating cells with 1 µg/mL Propidium Iodide (PI) for 5 min. Image using fluorescence microscopy; >95% should be PI-negative.
Protocol 3.2: Sample Preparation for High-Resolution Imaging of Membrane Proteins
Objective: To isolate and image native membrane protein complexes (e.g., GPCRs) in near-native lipid environments.
- Membrane Extraction: Treat cells with a gentle detergent (e.g., 0.5-1% Digitonin) or use mechanical shearing in a hypo-osmotic buffer to produce membrane fragments.
- Adsorption: Deposit 10-20 µL of the membrane suspension onto freshly cleaved mica for 10 minutes.
- Washing: Gently rinse with 2 mL of imaging buffer (e.g., 150 mM KCl, 20 mM HEPES, pH 7.4) to remove unbound material and detergent.
- Imaging: Perform AFM in the same buffer using tapping mode in liquid with an ultra-sharp tip (k ~ 0.1 N/m, f0 ~ 30 kHz in liquid).
Protocol 3.3: Cantilever Functionalization for Single-Molecule Force Spectroscopy
Objective: To attach a specific biomolecular probe (e.g., an antibody, RGD peptide) to the AFM tip via a flexible PEG linker.
- Cleaning: Clean gold-coated cantilevers in piranha solution (3:1 H2SO4:H2O2) CAUTION: Highly corrosive for 10 seconds, rinse in ethanol and Milli-Q water, dry under N2.
- SAM Formation: Incubate tips in 1 mM HS-(CH2)11-EG6-COOH solution in ethanol for 12-18 hours to form a self-assembled monolayer (SAM).
- Activation: Activate terminal carboxyl groups by immersing tips for 15 min in a solution of 50 mg/mL N-Hydroxysuccinimide (NHS) and 200 mg/mL 1-Ethyl-3-(3-dimethylaminopropyl)carbodiimide (EDC) in MES buffer.
- Ligand Coupling: Immediately transfer the tip to a 10-100 µg/mL solution of the target ligand (e.g., in PBS) for 1 hour.
- Quenching: Deactivate remaining active esters by immersing in 1 M ethanolamine-HCl (pH 8.5) for 10 minutes.
- Storage & Use: Rinse with buffer and use immediately. Keep in buffer at 4°C if not used within 1 hour.
The Scientist's Toolkit: Key Research Reagent Solutions
Table 2: Essential Materials for AFM Bio-Sample Preparation
| Item | Function & Rationale |
|---|---|
| Poly-L-Lysine | Promotes electrostatic adhesion of cells to glass/mica, preventing detachment during scanning. |
| #1.5 Glass-bottom Dishes | Optimal thickness (170 µm) for combined AFM and high-resolution optical microscopy (e.g., TIRF). |
| Freshly Cleaved Mica | Provides an atomically flat, negatively charged surface for adsorption of membranes, proteins, or DNA. |
| PEG-based Crosslinkers | Spacer molecule (e.g., NHS-PEG-Aldehyde) for tip functionalization; provides flexibility, reduces non-specific binding. |
| HEPES-buffered Media | Maintains physiological pH outside a CO2 incubator during AFM measurements. |
| Digitonin | Mild, cholesterol-selective detergent for permeabilizing cell membranes while preserving protein complexes. |
| Propidium Iodide (PI) | Cell-impermeant DNA stain used as a post-assay viability control; only enters cells with compromised membranes. |
| APTES (Aminopropyltriethoxysilane) | Silane used to functionalize glass/mica with amine groups for covalent protein attachment. |
Visualization of Methodologies and Pathways
Diagram 1: Core Workflows for AFM Bio-Experiments (98 chars)
Diagram 2: Threats to Sample Integrity & Mitigation Strategies (99 chars)
Validating AFM Data: Correlative Microscopy and Complementary Technique Integration
Within the broader thesis on "Atomic Force Microscopy Nanoscale Biological Interactions Research," a central challenge is the integration of high-resolution structural/mechanical data with specific biomolecular identification. Atomic Force Microscopy (AFM) provides exquisite nanoscale topographical and force measurements but lacks inherent chemical or fluorescent specificity. Conversely, fluorescence optical microscopy (e.g., epifluorescence, confocal, TIRF) offers targeted molecular localization via fluorescent tags but is diffraction-limited. Fluorescence-AFM (Fluo-AFM) correlative imaging directly addresses this gap, enabling the cross-validation of functional states (via fluorescence) with structural and nanomechanical properties (via AFM). This Application Note details protocols for robust Fluo-AFM correlative imaging, critical for research in membrane biophysics, cell adhesion, receptor-ligand interactions, and the mechanism of action of therapeutic agents.
Application Notes
2.1 Key Advantages and Applications
- Direct Cross-Validation: A fluorescent signal (e.g., from a labeled receptor, cytoskeletal component, or drug target) can be directly correlated with nanoscale features (e.g., clustering, protrusions) or mechanical properties (e.g., stiffness, adhesion) measured at the same location.
- Guided Nanomechanics: Specific regions of interest (ROIs) identified by fluorescence (e.g., a fluorescently tagged focal adhesion) can be targeted for subsequent AFM force spectroscopy, ensuring data is collected from biologically relevant sites.
- Dynamic Process Monitoring: Combining live-cell fluorescence imaging with intermittent or simultaneous AFM scanning allows for the investigation of dynamic processes like cytoskeletal remodeling or drug-induced morphological changes in real time.
2.2 System Configuration and Calibration Successful correlation requires precise spatial alignment of the optical and AFM images. This necessitates an integrated system where both microscopes share a common sample stage and objective/scan head. Critical calibration steps include:
- Pixel-to-Nanometer Calibration: A calibration grid (e.g., 10 µm pitch) is imaged with both modalities. A coordinate transformation matrix is calculated to map any pixel in the optical image to coordinates in the AFM scanner frame.
- Focus Co-planarity: Ensuring the focal plane of the optical microscope and the AFM tip engagement plane are coincident to maintain focus and correlation across the scan area.
- Minimizing Optical Interference: Using AFM probes with low autofluorescence (e.g., tipless silicon nitride cantilevers for bio-applications) and appropriate filter sets to avoid AFM laser interference in fluorescence channels.
Experimental Protocols
Protocol 1: Sample Preparation for Correlative Imaging of Live Mammalian Cells
- Objective: To correlate actin cytoskeleton dynamics with local nanomechanics.
- Materials: See "The Scientist's Toolkit" below.
- Procedure:
- Seed cells onto a 35 mm glass-bottom dish (No. 1.5 coverglass) 24-48 hours prior.
- Transfer cells using a standard protocol (e.g., CellLight Actin-RFP, BacMam 2.0). Incubate according to manufacturer instructions (typically 16-24 hrs).
- Prior to imaging, replace medium with pre-warmed, phenol-free imaging medium.
- Mount dish on the integrated Fluo-AFM stage. Allow system to thermally equilibrate for 20 min.
- Optical Identification: Using the fluorescence channel, locate a cell of interest and acquire a high-contrast image of the actin network. Define specific ROIs (e.g., cell body vs. periphery).
- AFM Engagement: Retract the optical objective, engage the AFM tip in a bare glass region adjacent to the cell using standard contact mode engagement parameters (setpoint ~0.5 nN, engage velocity 1 µm/s).
- Correlative Imaging: Navigate the AFM tip to the coordinates of the fluorescent ROI using the calibrated transformation. Perform a contact-mode topography scan (512x512 pixels, 1 Hz scan rate).
- Targeted Force Spectroscopy: In a defined fluorescent region (e.g., actin-rich stress fiber), perform a force-volume map or single-point force curves (approach/retract velocity 1 µm/s, trigger threshold 0.5 nN, 1024 data points/curve).
- Post-processing: Align images using cross-correlation of common features (e.g., cell edge) in both topographic and fluorescence images. Analyze Young's modulus from force curves using a Hertzian contact model.
Protocol 2: Fixed Cell Imaging for Receptor Clustering Analysis
- Objective: To validate the nanoscale organization of immuno-labeled membrane receptors with topography.
- Procedure:
- Culture and fix cells (4% PFA, 15 min) on a glass substrate.
- Perform standard immunofluorescence staining: permeabilize (0.1% Triton X-100, 5 min), block (5% BSA, 1 hr), incubate with primary antibody (1 hr), incubate with fluorescent secondary antibody (1 hr). Include AFM-compatible buffers (avoid glycerol).
- Mount in PBS. Acquire a high-resolution fluorescence image (e.g., using confocal or super-resolution modality if available).
- Gently rinse with Milli-Q water and dry under a gentle nitrogen stream. Note: This is for dry AFM imaging. For liquid imaging, do not dry.
- Engage the AFM tip and scan the identical ROI in tapping mode in air to prevent sample damage (scan size 10x10 µm, resolution 512x512, moderate amplitude setpoint).
- Correlate topographic clusters (nanoscale protrusions) with fluorescent puncta to confirm receptor aggregates.
Data Presentation
Table 1: Representative Quantitative Data from Fluo-AFM Studies on Biological Systems
| Biological System | Fluorescence Target | AFM Mode | Key Correlative Finding | Quantitative AFM Data (Mean ± SD) |
|---|---|---|---|---|
| Live HeLa Cell | Actin-RFP | Force Mapping | Perinuclear actin cortex is ~3x stiffer than lamellipodia. | Cortex: Elastic Modulus = 12.5 ± 3.1 kPa; Lamellipodia: 4.2 ± 1.7 kPa |
| Fixed Neuron | MAP2 (Microtubules) | Tapping Mode | High microtubule density correlates with elevated ridge structures (height 50-80 nm). | Ridge Height: 65 ± 15 nm; Width: 300 ± 50 nm |
| Lipid Bilayer | GM1 Ganglioside (BODIPY-FL labeled) | Force Spectroscopy | Lipid domains (lipid rafts) enriched in GM1 show 2x higher adhesion force. | Adhesion in GM1-rich domain: 250 ± 45 pN; Outside domain: 120 ± 30 pN |
| Drug-Treated Cancer Cell | Apoptosis Marker (Annexin V-FITC) | Contact Mode | Early apoptotic cells (Annexin V+) show ~50% reduction in Young's modulus. | Untreated: 3.8 ± 0.9 kPa; Treated (Apoptotic): 1.9 ± 0.6 kPa |
Diagrams
Diagram 1: Fluo-AFM Correlative Workflow
Diagram 2: Cross-Validation Logic of Fluo-AFM
The Scientist's Toolkit
Table 2: Essential Research Reagent Solutions for Fluo-AFM Correlative Imaging
| Item | Function & Explanation | Example/Recommendation |
|---|---|---|
| Glass-Bottom Culture Dishes | Provide optimal optical clarity for high-resolution fluorescence and a flat, rigid substrate for stable AFM imaging. | 35 mm dish, No. 1.5 (0.17 mm thick) coverglass. |
| Live-Cell Fluorescent Probes | Enable specific labeling of cellular structures (actin, tubulin, membranes, organelles) for dynamic imaging. | BacMam-based CellLight reagents, SiR-actin/tubulin dyes, lipophilic membrane dyes (DiI). |
| Immunofluorescence Kits | Allow for specific protein targeting in fixed samples. Choose kits compatible with AFM. | Cross-linker fixatives (PFA), AFM-compatible mounting media (PBS, low-autofluorescence buffer). |
| Low Autofluorescence AFM Probes | Critical to minimize background noise in the fluorescence channel during simultaneous imaging. | Tipless silicon nitride cantilevers (for force mapping), low-reflectivity silicon probes. |
| Phenol-Free Imaging Medium | Maintains cell health during live experiments without interfering with fluorescence detection. | CO2-independent medium, supplemented with fetal bovine serum and glutamine. |
| Calibration Grids | Essential for initial spatial alignment and pixel-to-nanometer coordinate transformation. | Grids with precise, lithographic patterns (e.g., 10 µm squares, 2 µm pitch). |
| Alignment Software | Specialized image analysis software to perform rigid/affine transformation and overlay AFM & fluorescence data. | Open-source (Fiji/ImageJ with plugins) or commercial correlative microscopy software. |
This application note, framed within a thesis on atomic force microscopy (AFM) nanoscale biological interactions, provides a comparative analysis of AFM with Scanning Electron Microscopy (SEM) and Transmission Electron Microscopy (TEM). The focus is on their application in elucidating biological structures and drug-target interactions at the nanoscale. AFM offers exceptional topographical data and force measurements under near-physiological conditions, while electron microscopies provide high-resolution structural imaging, often requiring extensive sample preparation. The integration of these techniques is powerful for correlative nanoscale analysis in biophysics and drug development.
Quantitative Comparison of Core Techniques
The table below summarizes the key quantitative parameters for AFM, SEM, and TEM relevant to biological research.
Table 1: Comparative Technical Specifications for Nanoscale Biological Imaging
| Parameter | Atomic Force Microscopy (AFM) | Scanning Electron Microscopy (SEM) | Transmission Electron Microscopy (TEM) |
|---|---|---|---|
| Resolution (Lateral) | ~0.5 nm (in air/liquid) | 0.5 - 4 nm (typically 1-3 nm for bio) | < 0.1 nm (theoretical), ~0.2 nm (practical) |
| Resolution (Vertical) | ~0.1 nm | N/A (surface technique) | N/A (projection technique) |
| Max Sample Height | 10-20 µm (typical) | Virtually unlimited with stage | < 100 nm (for 100 kV TEM) |
| Imaging Environment | Air, Liquid, Vacuum | High Vacuum (typically) | High Vacuum |
| Sample Preparation | Minimal (often none) | Fixation, Dehydration, Drying, Sputter Coating | Fixation, Dehydration, Resin Embedding, Sectioning, Staining |
| Key Measurable | Topography, Mechanical Properties (Elasticity, Adhesion), Forces | Surface Topography, Composition (with EDX) | Internal Ultrastructure, Morphology, Crystallography |
| Throughput | Low (single point/area) | Medium-High | Low-Medium |
| Live Cell Imaging | Yes (in fluid) | No (except ESEM) | No |
The Scientist's Toolkit: Essential Research Reagent Solutions
Table 2: Key Reagents and Materials for Correlative AFM-EM Studies
| Item | Primary Function | Example Application |
|---|---|---|
| Glutaraldehyde | Chemical fixative; crosslinks proteins to preserve structure. | Primary fixation for TEM and SEM sample preparation. |
| Osmium Tetroxide | Secondary fixative & stain; stabilizes lipids and adds electron density. | Post-fixation for TEM; provides membrane contrast. |
| Uranyl Acetate | Heavy metal stain; binds to nucleic acids and proteins for contrast. | TEM sample en bloc or section staining. |
| Lead Citrate | Heavy metal stain; binds to various cellular components. | TEM section staining (post-uranyl). |
| Poly-L-Lysine | Adhesive coating; promotes cell and tissue adhesion to substrates. | Pretreatment of mica or glass for AFM or TEM grid attachment. |
| Cantilevers (e.g., SNL, MLCT) | AFM probe; measures force and topography via deflection. | AFM imaging and force spectroscopy on fixed or live cells. |
| Conductive Coats (Au/Pd, Cr) | Thin metal layer; prevents charging in SEM. | Sputter coating of non-conductive biological samples for SEM. |
| LR White/Spurr's Resin | Embedding medium; infiltrates and supports tissue for sectioning. | TEM sample embedding prior to ultramicrotomy. |
| Functionalized Beads | Ligand carriers; enable specific force measurements. | AFM single-molecule force spectroscopy (e.g., drug-receptor binding). |
| Phosphate Buffered Saline (PBS) | Isotonic buffer; maintains pH and osmolarity. | Rinsing and preparation of biological samples across all techniques. |
Detailed Experimental Protocols
Protocol 4.1: Correlative AFM and TEM for Membrane Protein Analysis
Aim: To correlate the nanoscale surface morphology and mechanical properties of a cell membrane (via AFM) with the detailed ultrastructure of membrane proteins (via TEM).
Materials: Cell culture, glutaraldehyde (2.5% in PBS), cacodylate buffer, osmium tetroxide (1%), ethanol series, LR White resin, poly-L-lysine coated mica, ultramicrotome, AFM with fluid cell, TEM.
Procedure:
- Sample Preparation: Grow cells on poly-L-lysine coated mica discs. Fix cells with 2.5% glutaraldehyde in 0.1M cacodylate buffer for 1 hour at 4°C.
- Correlative AFM Imaging: Rinse fixed cells gently with PBS. Mount the mica disc in the AFM liquid cell filled with PBS. Acquire topography and PeakForce QNM (Quantitative Nanomechanical Mapping) data in buffer to map elasticity and adhesion.
- Post-Fixation for EM: Following AFM, immediately transfer samples to 1% osmium tetroxide in cacodylate buffer for 1 hour on ice.
- Dehydration & Embedding: Dehydrate through a graded ethanol series (50%, 70%, 90%, 100%, 100%), 10 minutes each. Infiltrate with LR White resin (ethanol:resin 1:1 for 1h, then pure resin overnight). Polymerize resin at 60°C for 24h.
- Sectioning: Using an ultramicrotome, trim the resin block to the region of interest (guided by AFM scan location maps). Cut 70-90 nm thin sections and collect on TEM grids.
- TEM Imaging: Stain grids with uranyl acetate and lead citrate. Image the sections in TEM to visualize the internal membrane and protein organization corresponding to the AFM-scanned area.
Protocol 4.2: High-Resolution Surface Topography Comparison: AFM vs. SEM
Aim: To directly compare the surface topography of a nanoparticle drug delivery vehicle using AFM (in liquid) and high-resolution SEM.
Materials: Lipid nanoparticles (LNPs), silicon wafer, filter paper, glutaraldehyde (2%), osmium tetroxide (1%), graded ethanol, critical point dryer, sputter coater, conductive tape.
Procedure:
- Sample Deposition: Dilute LNP suspension. Deposit 10 µL onto a clean silicon wafer. Allow to adsorb for 15 minutes.
- AFM Analysis: Gently rinse wafer with DI water to remove unbound particles. Blot edge with filter paper. Image immediately in tapping mode in air or under a thin layer of buffer to assess native topography and size distribution.
- Fixation & Drying for SEM: Fix the same wafer with 2% glutaraldehyde for 30 min. Rinse. Post-fix with 1% osmium tetroxide for 30 min. Dehydrate through an ethanol series (30%, 50%, 70%, 90%, 100%). Process through critical point drying to preserve morphology.
- SEM Preparation & Imaging: Mount wafer on SEM stub with conductive tape. Sputter coat with a 5 nm layer of gold/palladium. Image using a high-resolution SEM at 5-15 kV. Compare particle size, shape, and surface texture data with AFM results.
Visualized Workflows and Logical Relationships
Decision Workflow for AFM vs. EM Technique Selection
Correlative AFM-EM Workflow for Biological Samples
Relating AFM Force Measurements to Bulk Biophysical Assays (SPR, ITC).
Within a thesis exploring nanoscale biological interactions via atomic force microscopy (AFM), a core challenge is correlating single-molecule binding events with ensemble-averaged thermodynamic and kinetic data. AFM provides piconewton force resolution and sub-nanometer spatial detail, revealing interaction pathways, energy landscapes, and heterogeneities invisible to bulk methods. Surface Plasmon Resonance (SPR) and Isothermal Titration Calorimetry (ITC) offer complementary, solution-phase measurements of affinity, kinetics, and enthalpy. This Application Note provides protocols for designing orthogonal experiments to validate and enrich AFM findings with SPR and ITC data, creating a multi-scale understanding of biomolecular interactions.
Table 1: Comparative Overview of Biophysical Techniques
| Parameter | Atomic Force Microscopy (AFM) | Surface Plasmon Resonance (SPR) | Isothermal Titration Calorimetry (ITC) |
|---|---|---|---|
| Primary Measured Quantity | Force (pN), Distance (nm) | Resonance Units (RU) vs. Time | Heat (µcal) per time |
| Key Derived Parameters | Rupture force, Unbinding length, Energy landscape, Stiffness | Association/dissociation rate constants (ka, kd), Equilibrium constant (KD) | Equilibrium constant (KD), Enthalpy (ΔH), Stoichiometry (n), Entropy (ΔS) |
| Sample Consumption | Very low (µg) | Low (µg-mg) | Moderate-High (mg) |
| Throughput | Low (10s-100s of events) | Medium-High | Low |
| Core Advantage | Single-molecule force spectroscopy under physiological conditions; maps heterogeneity. | Label-free, real-time kinetics. | Direct measurement of full thermodynamic profile. |
| Limitation for Correlation | Cannot directly provide solution-phase ka, kd, ΔH. | Assumes homogeneous binding; no force data. | No kinetic or spatial resolution; requires solubility. |
Table 2: Example Correlation Data for a Model Protein-Ligand Interaction
| Assay | Reported KD | Kinetics (ka / kd) | Thermodynamics (ΔH / TΔS) | AFM Correlate |
|---|---|---|---|---|
| SPR | 5.2 ± 0.8 nM | ka: 1.1e5 M-1s-1, kd: 5.7e-4 s-1 | N/A | Most probable rupture force at loading rate predicted by kd. |
| ITC | 4.8 ± 1.1 nM | N/A | ΔH: -12.5 kcal/mol, TΔS: -3.2 kcal/mol | Total energy of interaction (area under force curve). |
| AFM-SMFS | N/A (dynamic force spectroscopy) | Extracted kd(0): ~6.2e-4 s-1 | Interaction length scale (xβ): ~0.5 nm | Primary data: Force-distance curves. |
Experimental Protocols
Protocol 1: AFM Single-Molecule Force Spectroscopy (SMFS)
Objective: To measure specific unbinding forces and reconstruct the energy landscape of a receptor-ligand pair. Materials: AFM with liquid cell, cantilevers (spring constant 10-100 pN/nm), substrate (e.g., mica, gold), PBS buffer. Functionalization: 1. Cantilever Tip: Incubate with PEG-benzaldehyde linker, then with aminooxy-functionalized ligand (20 µM, 1 hr). Quench with ethanolamine. 2. Substrate: Incubate with receptor protein (5-50 µg/mL, 30 min). Block with 1% BSA. Measurement: 1. Approach surface at 1 µm/s, 1s contact at 200pN, retract at 0.5-2 µm/s. 2. Collect >1000 force-distance curves across multiple locations. 3. Analyze specific unbinding events (≥ baseline rupture distance) using Worm-like Chain model. Perform Dynamic Force Spectroscopy at multiple loading rates. Data Correlation: Extract intrinsic dissociation rate kd(0) and barrier width xβ from loading rate vs. rupture force plot (Bell-Evans model). Compare kd(0) to SPR-derived kd.
Protocol 2: Surface Plasmon Resonance (SPR) Kinetics
Objective: To measure the real-time association and dissociation kinetics of the same interaction in solution. Materials: SPR instrument, CMS sensor chip, running buffer (e.g., HBS-EP+), receptor and ligand in identical buffer. Immobilization: Use amine coupling to immobilize receptor (~50-100 RU) on flow cell. Kinetic Titration: 1. Inject ligand at 5-6 concentrations (e.g., 0.5x to 10x estimated KD) for 120s association, 300s dissociation. 2. Use a reference flow cell for double-referencing. 3. Fit sensorgrams globally to a 1:1 Langmuir binding model to extract ka and kd. Data Correlation: Compare SPR-derived kd to the zero-force extrapolation kd(0) from AFM. Significant discrepancies may indicate force-induced pathway alterations.
Protocol 3: Isothermal Titration Calorimetry (ITC)
Objective: To determine the complete thermodynamic profile of the binding interaction in solution. Materials: ITC instrument, degassed buffer, receptor and ligand solutions dialyzed identically. Titration Setup: 1. Load cell with receptor (e.g., 50 µM). Fill syringe with ligand (e.g., 500 µM). 2. Perform titration: 1 initial 0.4 µL injection followed by 18 injections of 2 µL each, 150s spacing, constant stirring. Data Analysis: 1. Integrate heat peaks, subtract dilution heats. 2. Fit binding isotherm to a single-site model to obtain KD, ΔH, and stoichiometry (n). Calculate ΔG and TΔS. Data Correlation: The total energy (ΔH) from ITC provides context for the mechanical work (∫Fdx) measured in AFM. A highly exothermic interaction (large |ΔH|) often correlates with a steep, deep energy well probed by AFM.
The Scientist's Toolkit: Essential Research Reagents & Materials
| Item | Function in Correlation Studies |
|---|---|
| PEG Crosslinkers (e.g., NHS-PEG-Aldehyde) | Spacer for AFM tip functionalization; decouples specific binding from non-specific surface adhesion. |
| CMS Sensor Chips | Gold SPR sensor surface with carboxylated dextran matrix for controlled protein immobilization. |
| ITC Buffer Matching Kit | Assists in perfect buffer matching via dialysis to minimize artifactual heats from mismatched buffers. |
| BSA or Casein | Universal blocking agent for AFM substrates and SPR reference surfaces to minimize non-specific binding. |
| High-Precision AFM Cantilevers | Calibrated springs (e.g., silicon nitride) with defined force constants for quantitative force measurement. |
| Analytical Size-Exclusion Columns | For pre-purification of protein samples for ITC and SPR to ensure monodispersity and accurate concentration. |
Visualization of Workflow and Relationships
Title: Correlative Biophysical Assay Workflow
Title: Correlating AFM Dynamics with SPR Kinetics
Benchmarking Single-Molecule AFM against Optical Tweezers and Magnetic Tweezers
This application note provides a comparative analysis of three leading single-molecule force spectroscopy (SMFS) techniques—Atomic Force Microscopy (AFM), Optical Tweezers (OT), and Magnetic Tweezers (MT)—within the broader thesis research on probing nanoscale biological interactions for drug discovery. Each technique offers unique capabilities in force range, resolution, and environmental control, making them suitable for distinct biological questions. The objective is to guide researchers in selecting and applying the optimal method for their specific investigation of biomolecular mechanics, folding, and ligand interactions.
Quantitative Technique Comparison
The core operational parameters of the three techniques are summarized below.
Table 1: Core Performance Parameters of SMFS Techniques
| Parameter | Atomic Force Microscopy (AFM) | Optical Tweezers (OT) | Magnetic Tweezers (MT) |
|---|---|---|---|
| Force Range | 10 pN – 10 nN | 0.1 pN – 100 pN | 0.01 pN – 100 pN |
| Spatial Resolution | ~0.1-1 nm (vertical) | ~0.1-1 nm (Hz > 10 kHz) | ~1-10 nm |
| Temporal Resolution | ~0.1-1 ms | ~1-100 µs | ~1-10 ms |
| Stiffness (k) | 0.01 – 1 N/m | 0.0001 – 0.1 pN/nm | 0.00001 – 0.001 pN/nm |
| Working Distance | ~0.5 µm (in liquid) | ~100 µm | ~10 µm – mm |
| Typical Handle/Bead Size | ~2-20 µm (cantilever) | 0.5 – 5 µm (dielectric bead) | 0.5 – 5 µm (magnetic bead) |
| Parallelization | Low (typically single molecule) | Moderate (via multiplexed traps) | High (dozens of molecules simultaneously) |
| Force-Clamp Capability | Active feedback possible | Excellent (fast feedback) | Passive (constant force via magnet gradient) |
| Topography Imaging | Yes (high-resolution) | No | No |
| Sample Environment | Liquid/Air, temperature control | Liquid, precise temperature control | Liquid, compatible with high-throughput flow cells |
Experimental Protocols
Protocol 2.1: Single-Molecule AFM Force Spectroscopy on Membrane Proteins This protocol details the measurement of unfolding forces for a receptor (e.g., a GPCR) in a near-native lipid bilayer.
A. Sample Preparation:
- Substrate & Cantilever Functionalization: Incubate a gold-coated coverslip and a silicon nitride AFM cantilever (k ≈ 0.06 N/m) in an ethanol solution of 1 mM PEG linker terminated with NHS ester and maleimide groups for 1 hour. Rinse with ethanol and dry under N₂.
- Protein Reconstitution: Purify the target membrane protein and reconstitute it into proteoliposomes using a lipid mixture mimicking the native membrane (e.g., POPC:Cholesterol).
- Surface & Tip Attachment: Spot the proteoliposomes onto the functionalized substrate for 15 minutes. Passivate the surface with 1% BSA for 10 minutes to prevent non-specific adhesion. Functionalize the cantilever tip with the specific ligand or antibody for the protein's extracellular domain via maleimide chemistry.
- Mounting: Assemble the AFM liquid cell with the substrate and cantilever. Fill the cell with the appropriate physiological buffer (e.g., PBS with 1 mM Ca²⁺/Mg²⁺).
B. Measurement:
- Engage the cantilever onto the surface at a low force (<100 pN).
- Approach and retract the tip from the surface at a constant velocity (e.g., 400-1000 nm/s) over a distance of 200-400 nm.
- Record the force-distance (F-D) curve. Specific, sawtooth-like patterns in the retraction curve indicate sequential unfolding of protein domains.
- Repeat thousands of times across the surface to gather statistics.
C. Data Analysis:
- Filter F-D curves for specific binding events using a force threshold (e.g., >20 pN).
- Fit the last rupture event of the sawtooth pattern with the Worm-Like Chain (WLC) model to extract contour length increments (ΔLc), corresponding to unfolded domains.
- Plot rupture force histograms to determine characteristic unfolding forces.
Protocol 2.2: Optical Tweezers Assay for Nucleic Acid Processing Enzymes This protocol measures the step size and force dependence of a translocating enzyme (e.g., a helicase or polymerase).
A. Sample Preparation:
- DNA/RNA Construct: Create a double-stranded nucleic acid construct with long single-stranded overhangs or specific handles (e.g., digoxigenin and biotin) at each end.
- Bead Attachment: Incubate anti-digoxigenin coated polystyrene beads (1 µm) with one handle and streptavidin-coated beads with the other handle for 15 minutes in separate chambers.
- Flow Cell Assembly: Introduce the beads into a passivated microfluidic flow cell. Introduce the enzyme and required nucleotides (ATP, dNTPs) via the flow system.
B. Measurement:
- Trap two beads in two independent, closely spaced optical traps.
- Move the traps to tether a single nucleic acid molecule between the beads.
- Apply a constant force or force clamp using active feedback on one trap.
- Initiate the reaction by flowing in the enzyme and nucleotides. Record the bead positions in both traps at high bandwidth (≥ 10 kHz).
C. Data Analysis:
- Calculate the extension change (Δx) of the tether from the bead positions.
- Convert displacement data to steps using step-finding algorithms (e.g., hidden Markov modeling).
- Analyze the distribution of step sizes and dwell times between steps as a function of applied force.
Protocol 2.3: Magnetic Tweezers for High-Throughput Ligand Binding Studies This protocol measures DNA twist and extension changes upon small molecule (drug) intercalation.
A. Sample Preparation:
- DNA Tethering: Use a ~3 kbp DNA fragment with multiple specific modification sites (e.g., digoxigenin at one end, multiple biotins at the other). Bind the digoxigenin end to an anti-digoxigenin functionalized glass surface in a flow cell.
- Bead Attachment: Introduce streptavidin-coated superparamagnetic beads (1 µm) to bind to the biotinylated end.
- Passivation: Flush with a buffer containing BSA and casein to prevent non-specific surface interactions.
B. Measurement:
- Use permanent magnets or electromagnets above the flow cell to apply a constant vertical force (e.g., 0.5 pN) to the bead.
- Rotate the magnets to introduce supercoils (twist) into the DNA tether.
- Track the bead's (x, y, z) position in real-time using video microscopy.
- Flow in the intercalating drug candidate (e.g., doxorubicin) at varying concentrations. Monitor the change in the tether's extension as the drug binds and alters the supercoiling state.
C. Data Analysis:
- For each tether, plot extension vs. number of rotations to generate a "hat curve."
- Quantify the shift in the hat curve's minimum (plectoneme formation point) upon drug addition.
- Plot the change in extension at a fixed supercoiling level vs. drug concentration to determine binding affinity (Kd).
The Scientist's Toolkit: Essential Research Reagent Solutions
Table 2: Key Reagents and Materials for SMFS Experiments
| Item | Function in Experiment | Example/Notes |
|---|---|---|
| PEG Crosslinkers | Spacer molecule to tether molecules to surfaces/tips; reduces non-specific binding, provides mechanical flexibility. | Heterobifunctional NH2-PEG-NHS, SH-PEG-NHS. 25-60 nm length typical. |
| Functionalized Beads | Act as handles for force application and measurement in OT and MT. | Streptavidin-coated polystyrene (OT), superparamagnetic (MT). Diameter critical for force range. |
| Passivation Agents | Block non-specific adhesion to surfaces and beads. | BSA, casein, Pluronic F-127, PEG-silane. Essential for signal-to-noise ratio. |
| Biolinkers | For specific, covalent attachment of biomolecules. | Sulfo-SMCC (thiol-maleimide), EDC/NHS (carboxyl-amine). |
| Supported Lipid Bilayers | Provides a near-native environment for membrane protein studies in AFM. | Formed from vesicles of POPC, DOPC, or native lipid extracts on mica/silica. |
| High-Purity Nucleotides | Fuel for enzymatic reactions studied in OT (e.g., helicase, polymerase). | ATP, GTP, dNTPs. Nucleotide analogs used for kinetic trapping. |
| Tethered DNA/RNA Constructs | The polymer substrate for nucleic acid-interacting proteins and drugs. | Designed with specific handles (biotin, digoxigenin) and sequences (hairpins, repeats). |
Visualized Workflows and Concepts
Title: Single-Molecule AFM Force Spectroscopy Protocol
Title: Technique Selection Logic for SMFS
Title: Multi-Technique Study of a Signaling Pathway
Within a broader thesis on atomic force microscopy (AFM) for nanoscale biological interactions research, the integration of spectroscopic techniques has become paramount. Combining AFM's superior spatial resolution with the chemical specificity of Infrared (IR) and Raman spectroscopy enables correlative topographical and chemical mapping at the nanoscale. This is critical for researchers and drug development professionals studying complex biological systems, such as protein aggregation, cellular membrane domains, or drug-particle interactions, where understanding structure-function relationships at the molecular level is essential. This document provides current application notes and detailed protocols for these hybrid modalities.
Core Principles & Instrumentation
IR-AFM (also known as AFM-IR or Photothermal AFM): A pulsed, tunable IR laser illuminates the sample. When the laser wavelength matches a molecular vibrational resonance, the sample absorbs light, undergoes rapid thermal expansion, and induces a transient oscillation in an AFM cantilever in contact mode. The amplitude of this oscillation is proportional to the IR absorption. This allows for the creation of chemical maps at spatial resolutions beyond the optical diffraction limit (~10-100 nm).
Raman-AFM (Tip-Enhanced Raman Spectroscopy - TERS): A laser focused on a metal-coated AFM tip (typically Ag or Au) generates a highly localized surface plasmon at the tip apex. This plasmon dramatically enhances the Raman scattering signal from molecules directly beneath the tip, providing chemical fingerprinting with spatial resolution dictated by the tip radius (~1-20 nm). The AFM simultaneously records nanoscale topography.
Key Quantitative Comparison:
Table 1: Comparative Performance Metrics of IR-AFM and Raman-AFM
| Parameter | IR-AFM (AFM-IR) | Raman-AFM (TERS) |
|---|---|---|
| Spatial Resolution | 10 - 100 nm | 1 - 20 nm |
| Chemical Sensitivity | ~100 molecules (for strong absorbers) | Single molecule (under ideal conditions) |
| Spectral Range | Typically Mid-IR (e.g., 800 - 4000 cm⁻¹) | Typically Visible to NIR (e.g., 400 - 4000 cm⁻¹) |
| Key Advantage | Direct correlation to FTIR databases; robust for polymers, biological films. | Higher spatial resolution; rich vibrational fingerprint; works in aqueous environments. |
| Primary Limitation | Resolution limited by thermal diffusion; generally requires thin samples. | Enhancement depends critically on tip quality and stability; can cause photo-damage. |
| Typical Acquisition Time per Spectrum | ~1 ms - 1 s | 0.1 - 10 s |
Detailed Experimental Protocols
Protocol 3.1: Correlative Nanoscale Chemical Mapping of Amyloid Fibrils Using AFM-IR
Objective: To correlate the topography of protein amyloid fibrils with their secondary structure composition (β-sheet content) on a single-fibril level.
Materials & Reagents: See "The Scientist's Toolkit" (Section 5).
Procedure:
- Sample Preparation:
- Prepare a 10 µM solution of lysozyme in 20 mM HCl (pH ~2.0) and incubate at 57°C for 24 hours to form fibrils.
- Dilute the fibril suspension 1:100 in deionized water.
- Deposit 20 µL onto a clean, gold-coated glass slide or IR-transparent substrate (e.g., ZnSe).
- Allow to adsorb for 5 minutes, then gently rinse with deionized water and dry under a gentle stream of nitrogen.
AFM Topographical Imaging:
- Mount the sample on the AFM-IR stage.
- Engage a conductive diamond-coated cantilever (k ~0.2 N/m) in tapping mode.
- Acquire a 5 µm x 5 µm topographic image to locate isolated fibrils.
AFM-IR Chemical Mapping:
- Switch the instrument to AFM-IR contact mode.
- Tune the IR laser to the amide I band (≈1620-1660 cm⁻¹, specific for β-sheet).
- Perform a point spectrum on a selected fibril by sweeping the laser across the amide I range (e.g., 1600-1700 cm⁻¹, 2 cm⁻¹ steps).
- For chemical mapping, fix the laser at the resonant peak (e.g., 1628 cm⁻¹) and perform a scan over a 1 µm x 1 µm region. The IR absorption signal at each pixel generates the chemical map.
- Optionally, map at a reference wavelength (e.g., 1680 cm⁻¹) for background subtraction.
Data Analysis:
- Overlay the chemical map (β-sheet distribution) onto the high-resolution topography.
- Analyze spectra from different points along the fibril (e.g., core vs. end) to assess structural heterogeneity.
Protocol 3.2: Nanoscale Compositional Analysis of a Drug Delivery Liposome Using TERS
Objective: To visualize the distribution of a drug molecule within a single liposome at nanoscale resolution.
Materials & Reagents: See "The Scientist's Toolkit" (Section 5).
Procedure:
- Tip Preparation: Use a commercially available TERS probe (Ag-coated, resonance-tuned for the excitation laser) or fabricate in-house via thermal evaporation. Check enhancement factor daily using a standard like benzenethiol.
Sample Preparation:
- Prepare DPPC liposomes incorporating a Raman-active drug (e.g., Doxorubicin) via thin-film hydration and extrusion.
- Deposit 5 µL of liposome solution onto a clean, atomically flat Au(111) substrate.
- Incubate for 10 minutes in a humidity chamber to allow for vesicle adsorption, then gently rinse with buffer to remove excess material.
Correlative AFM and TERS Analysis:
- Mount the sample. Locate an isolated liposome using AFM tapping mode in liquid or after gentle drying.
- Switch to TERS contact mode. Bring the tip into gentle contact.
- Focus the excitation laser (e.g., 532 nm) precisely onto the tip apex.
- On a selected area of the liposome, acquire a TERS point spectrum (integration time 1-5 s). The characteristic Raman peaks of DPPC (e.g., ~1440 cm⁻¹ for CH₂ deformation) and Doxorubicin (e.g., ~1250 cm⁻¹) will be present.
- To create a chemical map, perform a raster scan while continuously acquiring spectra (or at discrete points) over a 500 nm x 500 nm area.
- Generate maps by integrating the intensity of specific Raman peaks (DPPC vs. drug) at each pixel.
Data Analysis:
- Use multivariate analysis (e.g., Principal Component Analysis) to deconvolute spectral maps and identify pure component distributions.
- Correlate drug signal intensity maps with topographical features of the liposome.
Visualization of Workflows and Concepts
Diagram Title: AFM-IR (Photothermal) Core Mechanism Workflow
Diagram Title: Hybrid AFM Spectral Technique Selection Guide
The Scientist's Toolkit
Table 2: Essential Research Reagents & Materials for AFM-Spectral Experiments
| Item | Function / Explanation |
|---|---|
| Gold-coated Substrates | Provides an atomically flat, reflective, and chemically inert surface essential for TERS (plasmonic enhancement) and clean AFM-IR background. |
| IR-transparent Substrates (ZnSe, Ge) | Allows transmission of IR light in AFM-IR, crucial for studying thin biological samples on these windows. |
| TERS Probes (Ag/Au-coated) | Specialized AFM probes with a plasmonically active metal coating to generate the localized enhanced field for Raman scattering. |
| Conductive Diamond-coated Probes | Used for AFM-IR in contact mode; diamond coating resists wear and conducts heat rapidly, improving sensitivity. |
| Benzenethiol | A standard molecule used for daily calibration and verification of TERS enhancement factor due to its strong, known Raman spectrum. |
| Model Lipid Systems (e.g., DPPC) | Well-characterized lipids used to create biomimetic membranes (liposomes, supported bilayers) as simplified interaction platforms. |
| Protein Aggregation Kits (Lysozyme, Aβ42) | Provide reproducible protocols and materials for generating amyloid fibrils, a key model for neurodegenerative disease research. |
| Anhydrous Ethanol & Piranha Solution | For ultra-cleaning substrates and tips to remove organic contaminants, which is critical for reproducible TERS signals. |
Conclusion
Atomic Force Microscopy has evolved from a high-resolution imaging tool into a indispensable quantitative platform for interrogating nanoscale biological interactions directly under physiologically relevant conditions. By mastering its foundational principles, applying robust methodologies, systematically troubleshooting experimental challenges, and validating findings through correlative approaches, researchers can unlock profound insights into molecular mechanisms, cellular mechanics, and drug-target interactions. The future of AFM in biomedicine points toward increased automation, higher-speed imaging for dynamic processes, and deeper integration with molecular labeling and omics technologies. This convergence will further solidify AFM's role in accelerating drug discovery, characterizing biopharmaceuticals, and providing mechanistic understanding in areas from neurodegenerative diseases to cancer immunotherapy, bridging the critical gap between nanoscale biophysics and clinical translation.