Breaking Barriers: Harnessing Adsorptive-Mediated Transcytosis for Next-Generation CNS Drug Delivery
This comprehensive review explores the mechanisms, methodologies, and applications of adsorptive-mediated transcytosis (AMT), a critical pathway for delivering therapeutics across biological barriers, notably the blood-brain barrier (BBB).
Breaking Barriers: Harnessing Adsorptive-Mediated Transcytosis for Next-Generation CNS Drug Delivery
Abstract
This comprehensive review explores the mechanisms, methodologies, and applications of adsorptive-mediated transcytosis (AMT), a critical pathway for delivering therapeutics across biological barriers, notably the blood-brain barrier (BBB). We begin by establishing the foundational principles, distinguishing AMT from receptor-mediated transcytosis and detailing its reliance on electrostatic interactions with cell-surface proteoglycans. The article then progresses to state-of-the-art methodological approaches for designing and characterizing AMT-based delivery systems, highlighting current applications in CNS and peripheral drug targeting. We address common challenges and optimization strategies, including mitigation of non-specific uptake and enhancement of transcytosis efficiency. Finally, we present a comparative analysis with other delivery platforms and discuss validation frameworks using in vitro, in vivo, and clinical models. This article serves as an essential resource for researchers and drug developers aiming to leverage AMT for enhancing the bioavailability and efficacy of biologics and nanomedicines.
The Electrostatic Highway: Core Principles and Mechanisms of Adsorptive-Mediated Transcytosis (AMT)
Adsorptive-mediated transcytosis (AMT) is a critical pathway for the non-receptor-mediated transport of macromolecules, particularly cationic substances, across the continuous endothelial and epithelial barriers that line various organs, including the brain (blood-brain barrier, BBB) and the intestine. Within the broader thesis of advancing adsorptive-mediated transcytosis mechanisms research, this primer elucidates the fundamental charge-driven principles, quantitative parameters, and experimental methodologies that define this transport pathway. AMT capitalizes on the electrostatic interaction between positively charged motifs on cargo (e.g., cell-penetrating peptides, cationic proteins) and the negatively charged membrane components (e.g., heparan sulfate proteoglycans) on the luminal surface of barrier cells. This initiates invagination and vesicle formation, leading to cargo internalization, trafficking through the endosomal system, and eventual exocytosis on the abluminal side. Understanding and harnessing AMT is of paramount importance in drug development for enabling the delivery of biologics and nanoparticles to otherwise inaccessible tissues.
Core Quantitative Parameters of AMT
The efficiency and kinetics of AMT are governed by several measurable physicochemical and biological parameters. The following tables summarize key quantitative data from recent research.
Table 1: Physicochemical Determinants of AMT Efficiency
| Parameter | Typical Optimal Range for AMT | Impact on AMT | Measurement Technique |
|---|---|---|---|
| Isoelectric Point (pI) / Net Charge | Cargo pI > 8.5 (Strongly cationic) | Primary driver of initial adsorption. Excessive charge can cause lysosomal trapping. | Isoelectric focusing, Zeta potential measurement. |
| Cationic Charge Density | > 1.5 mmol/g polymer | Higher density increases binding affinity but may reduce transcytosis efficiency beyond an optimum. | Elemental analysis, NMR. |
| Hydrophobicity | Moderate increase beneficial | Enhances membrane perturbation and endosomal escape but can increase non-specific binding. | Log P calculation, HPLC retention time. |
| Molecular Weight/Size | < 20 kDa for peptides; Nanoparticles: 20-150 nm | Larger sizes show reduced transcytosis rates but can carry more payload. | Size-exclusion chromatography, DLS (nanoparticles). |
| Heparan Sulfate Binding Affinity (Kd) | 10 - 100 nM | Stronger binding correlates with uptake but may hinder release and complete transcytosis. | Surface plasmon resonance (SPR). |
Table 2: Key Kinetic and Pharmacokinetic Metrics in AMT Studies
| Metric | Typical Value/Description | Experimental Model | Significance |
|---|---|---|---|
| Apparent Permeability (Papp) | 1-10 x 10⁻⁶ cm/s for efficient AMT candidates | In vitro BBB (e.g., hCMEC/D3 monolayers) | Measures rate of transport across a cellular barrier. |
| Transcytosis Efficiency (%) | 0.1-5% of applied dose (highly variable) | In vitro transwell systems, in vivo brain uptake | Percentage of internalized cargo that undergoes complete transcytosis. |
| Volume of Distribution (Vd) | Increased for tissues with target barriers (e.g., brain) | In vivo rodent pharmacokinetics | Suggests extravasation and tissue penetration via AMT. |
| Blood-Brain Barrier Permeability-Surface Area (PS) Product | Can increase 2-10 fold with cationic modifiers | In situ brain perfusion in rodents | Direct measure of unidirectional brain uptake clearance. |
Experimental Protocols for Investigating AMT
Protocol 1:In VitroTranscytosis Assay Using a Human BBB Model
Objective: To quantify the permeability and transcytosis of a cationic candidate molecule across a monolayer of brain endothelial cells. Materials:
- Transwell inserts (polycarbonate membrane, 0.4 µm pores).
- Human cerebral microvascular endothelial cell line (e.g., hCMEC/D3).
- Cationic test molecule (e.g., TAT peptide-conjugated cargo) and anionic/neutral control.
- Radioactive (e.g., ¹²⁵I) or fluorescent label.
- Assay buffer (HBSS with 10 mM HEPES, pH 7.4).
- LC-MS/MS or plate reader for quantification. Method:
- Culture hCMEC/D3 cells on collagen-coated transwell inserts until a tight monolayer forms (TEER > 40 Ω·cm²).
- Pre-warm assay buffer. Add buffer to the acceptor (basolateral) compartment.
- Apply the radiolabeled/fluorescent test compound in buffer to the donor (apical) compartment.
- Incubate at 37°C with gentle agitation. Sample from the acceptor compartment at regular intervals (e.g., 15, 30, 60, 90 min).
- Replenish the acceptor compartment with fresh buffer after each sampling.
- At experiment end, sample from the donor compartment and lyse cells to determine intracellular accumulation.
- Analyze samples for compound concentration. Calculate Papp using the formula: Papp = (dQ/dt) / (A * C₀), where dQ/dt is the steady-state flux, A is the membrane area, and C₀ is the initial donor concentration.
- Inhibition Control: Repeat in the presence of 10-100 µM polycationic inhibitor (e.g., protamine) or heparinase pre-treatment to confirm charge-mediated mechanism.
Protocol 2:In SituBrain Perfusion to Assess Unidirectional Uptake
Objective: To measure the initial rate of brain uptake of a compound via AMT, eliminating confounding systemic factors. Materials:
- Anesthetized rodent (rat or mouse).
- Perfusion pump and tubing.
- Oxygenated, warmed perfusion fluid (Krebs-bicarbonate buffer with electrolytes and dextran).
- Test compound labeled with a radioactive (e.g., ¹⁴C-sucrose as vascular space marker, ³H-test compound) or stable isotope.
- Scintillation counter or mass spectrometer. Method:
- Cannulate the common carotid artery of the anesthetized animal.
- Immediately start perfusion with the oxygenated buffer containing the radiolabeled test compound and vascular marker at a constant flow rate (~2.5 mL/min for rat).
- Perfuse for a short, fixed time (15-120 seconds) to measure initial uptake.
- Terminate perfusion by decapitation. Rapidly remove the ipsilateral hemisphere of the brain.
- Homogenize the brain tissue and solubilize. Separate the vascular (pellet) and parenchymal (supernatant) fractions if needed.
- Measure radioactivity in the brain homogenate and perfusion fluid samples.
- Calculate the Brain Uptake Index (BUI) or Permeability-Surface Area (PS) product, correcting for vascular volume using the co-perfused marker.
- Competition Studies: Include excess unlabeled cationic polymer (e.g., 1 mM poly-L-lysine) in the perfusate to competitively inhibit AMT and confirm specificity.
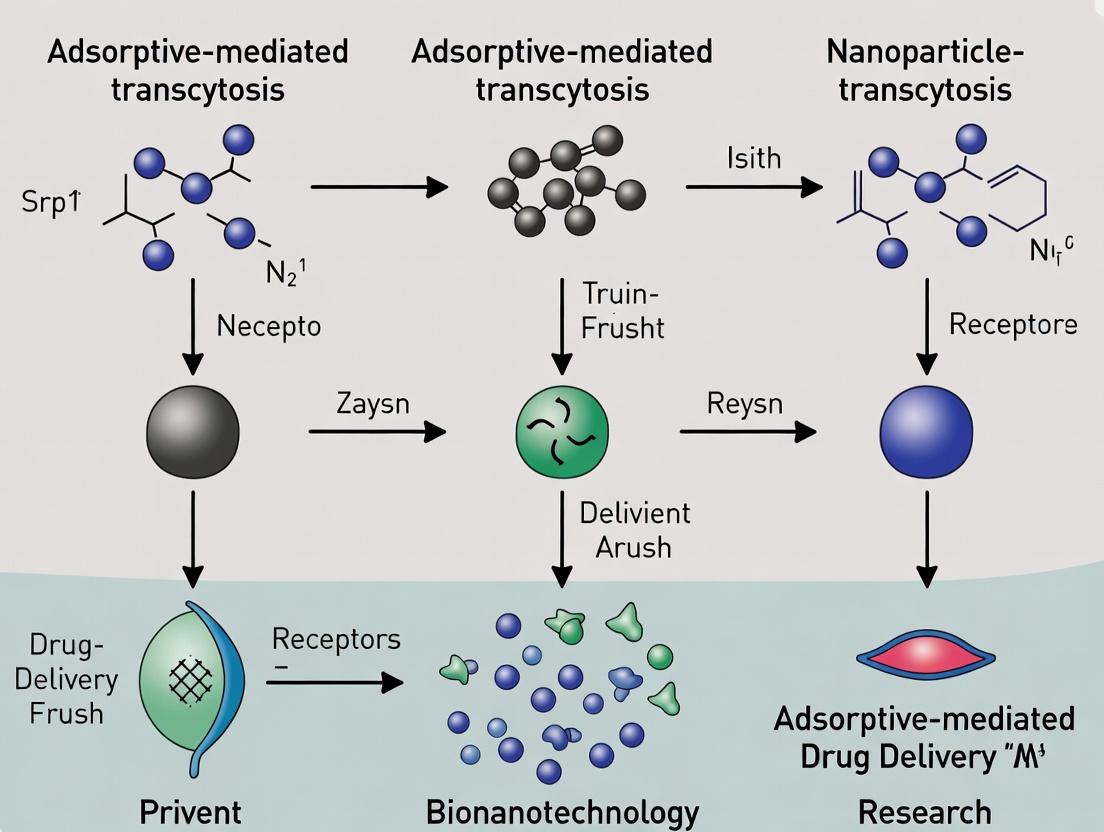
Visualizing AMT Pathways and Workflows
The Scientist's Toolkit: Key Research Reagent Solutions
Table 3: Essential Reagents for AMT Mechanism and Inhibition Studies
| Reagent / Material | Function in AMT Research | Example Product / Target |
|---|---|---|
| Heparinase I, II, III | Enzymatically cleaves heparan sulfate chains on cell surface proteoglycans. Used to confirm HSPG involvement in cationic cargo binding. | Pseudomonas heparinus enzymes. |
| Polycationic Inhibitors (Protamine, Poly-L-Lysine) | Competitively binds anionic membrane sites, blocking adsorption of the test cationic cargo. Serves as a classic AMT inhibition control. | Protamine sulfate, P7890 (Sigma). |
| Chlorpromazine | Inhibits clathrin-mediated endocytosis by preventing clathrin coat assembly. Used to delineate the primary endocytic pathway. | Endocytosis inhibitor. |
| Genistein / Methyl-β-Cyclodextrin | Inhibits caveolae-mediated endocytosis (Genistein via tyrosine kinases; MβCD by cholesterol depletion). Used for pathway discrimination. | Caveolae pathway inhibitors. |
| Bafilomycin A1 | V-ATPase inhibitor that blocks endosomal acidification. Used to assess pH-dependence of trafficking and endosomal escape. | Lysosomotropic agent. |
| Fluorescent Dextrans (Lysotracker, pHrodo) | Markers for endosomal/lysosomal compartments. Used in co-localization studies to track cargo intracellular fate. | Thermo Fisher Scientific probes. |
| hCMEC/D3 Cell Line | A well-characterized, conditionally immortalized human brain endothelial cell line for modeling the BBB in vitro. | Merck, SCC066. |
| In Situ Brain Perfusion Kit (Rodent) | Specialized cannulae and buffers standardized for the brain perfusion technique. | Adapted from custom lab setups or commercial surgical suppliers. |
Within the field of targeted drug delivery, adsorptive-mediated transcytosis (AMT) has emerged as a critical mechanism for the transport of macromolecules across biological barriers, most notably the blood-brain barrier (BBB). This whitepaper dissects the core molecular triad governing AMT initiation and efficiency: cationic ligands, cell-surface proteoglycans (CSPGs), and phosphatidylserine (PS). Understanding their interplay is fundamental for advancing brain-targeting therapeutics and nanoparticle design.
Core Molecular Mechanisms
Cationic Ligands
Cationic ligands are molecules or domains with a net positive charge at physiological pH. They facilitate the initial electrostatic interaction with negatively charged cell surfaces.
| Ligand Type | Isoelectric Point (pI) | Binding Affinity (Kd, nM) Range | Common Conjugation Target |
|---|---|---|---|
| Cationic Proteins (e.g., Histones) | >10.0 | 50 - 200 | Nanoparticle surface adsorption |
| Cationic Peptides (e.g., TAT, penetratin) | 9.5 - 12.5 | 100 - 500 | Covalent linkage to cargo |
| Cationic Polymers (e.g., PEI, Chitosan) | N/A (Polycationic) | 10 - 1000 (highly variable) | Complexation/encapsulation |
| Cationic Lipids (e.g., DOTAP) | N/A | N/A (forms bilayer) | Liposomal membrane component |
Cell-Surface Proteoglycans (CSPGs)
CSPGs are glycoproteins bearing one or more covalently attached glycosaminoglycan (GAG) chains. Their sulfate and carboxyl groups confer a strong negative charge, making them primary anchors for cationic ligands.
| Proteoglycan | Core Protein Size (kDa) | Primary GAG Chain(s) | Relative Abundance on BBB Endothelium |
|---|---|---|---|
| Syndecan-1 | ~32 | Heparan Sulfate (HS), Chondroitin Sulfate (CS) | Medium |
| Syndecan-4 | ~22 | Heparan Sulfate (HS) | High |
| Glypican-1 | ~62 | Heparan Sulfate (HS) | Medium |
| Perlecan | ~400 | Heparan Sulfate (HS) | Low |
Phosphatidylserine (PS)
PS is a phospholipid normally restricted to the inner leaflet of the plasma membrane. Its externalization serves as an "eat-me" signal and a secondary anionic docking site for certain cationic ligands, particularly during stress or apoptosis-mimicry strategies.
| Membrane Context | % PS in Outer Leaflet | Translocation Mechanism | Role in AMT |
|---|---|---|---|
| Healthy Cell | < 1% | ATP-dependent flippase activity | Negligible |
| Apoptotic Cell | > 15% | Scramblase activation, flippase inhibition | Primary ligand target |
| Engineered Liposome | ~30% (designable) | Incorporated during formulation | Enhances uptake and downstream processing |
Experimental Protocols for AMT Investigation
Protocol: Quantifying Cationic Ligand Binding to CSPGs
Objective: To measure the binding affinity and specificity of a cationic ligand to heparan sulfate proteoglycans. Materials: Recombinant syndecan-4 extracellular domain, cationic ligand (e.g., TAT-Cy5), heparinase III, surface plasmon resonance (SPR) chip (CM5). Procedure:
- Immobilize recombinant syndecan-4 core protein onto a CM5 chip via amine coupling (~5000 RU).
- For the test channel, treat the immobilized protein with Heparan Sulfate (HS) chains enzymatically in situ using heparanase (if studying intact GAGs, pre-bind HS to the core protein).
- Prime the SPR system with HEPES-buffered saline (HBS-EP, pH 7.4).
- Inject increasing concentrations (0, 10, 50, 100, 250, 500 nM) of the cationic ligand over both the syndecan-4 and a reference control channel at a flow rate of 30 µL/min.
- Monitor association for 180s and dissociation for 300s.
- Regenerate the surface with a 30s pulse of 2M NaCl.
- Analyze sensograms using a 1:1 Langmuir binding model to calculate kinetic constants (ka, kd) and equilibrium dissociation constant (Kd).
Protocol: Visualizing AMT via PS-Exposing Carriers
Objective: To track the transcytosis of PS-exposing liposomes across an in vitro BBB model. Materials: hCMEC/D3 cell line, Transwell inserts (0.4 µm pore), liposomes (DOTAP:Cholesterol:PS:Rh-PE at 40:50:9:1 mol%), confocal microscopy. Procedure:
- Culture hCMEC/D3 cells on collagen-coated Transwell inserts until a tight monolayer is formed (TEER > 40 Ω·cm²).
- Add fluorescently tagged (Rh-PE) PS-exposing liposomes to the apical chamber.
- Incubate at 37°C. At time points (0.5, 1, 2, 4 h), sample from the basolateral chamber to quantify fluorescence (ex/em 560/590 nm) as a measure of transcytosis.
- For imaging, at 2h, wash cells, fix with 4% PFA, and stain for actin (Phalloidin-488) and nuclei (DAPI).
- Acquire Z-stack images using a confocal microscope. Co-localization analysis (e.g., with early endosome antigen 1 (EEA1) antibody) can be performed to confirm vesicular trafficking.
Visualization of AMT Pathways
Title: Core AMT Initiation and Trafficking Pathway
Title: Key Experimental Workflow for AMT Research
The Scientist's Toolkit: Key Research Reagent Solutions
| Reagent / Material | Supplier Examples | Primary Function in AMT Research |
|---|---|---|
| Recombinant Human Syndecan-4 (ECD) | R&D Systems, Sino Biological | Provides pure CSPG core protein for in vitro binding studies without full cellular complexity. |
| Heparinase I/III | Merck, Thermo Fisher | Enzymatically cleaves heparan sulfate chains; critical for confirming GAG-dependent binding. |
| hCMEC/D3 Cell Line | Merck | A well-characterized human BBB endothelial model for in vitro transcytosis assays. |
| DOTAP (Cationic Lipid) | Avanti Polar Lipids, Cayman Chemical | Key component for formulating cationic liposomes to study charge-based interactions. |
| 1,2-dioleoyl-sn-glycero-3-phospho-L-serine (DOPS) | Avanti Polar Lipids | Source of phosphatidylserine for creating PS-exposing membranes in liposomes. |
| Chlorpromazine hydrochloride | Merck, Tocris | Inhibitor of clathrin-mediated endocytosis; used to probe the internalization pathway. |
| Receptor-Associated Protein (RAP) | Bio-Techné, R&D Systems | Inhibits binding to LRP and other LDLR family members; tests for receptor specificity. |
| Cell-Based Heparan Sulfate Array | Glycan Therapeutics | Allows high-throughput screening of ligand binding to specific HS sequences. |
| Annexin V-FITC | BioLegend, Invitrogen | Binds externalized PS; used to confirm and quantify PS exposure on carriers or cells. |
Within the broader thesis of adsorptive-mediated transcytosis (AMT) mechanisms research, it is critical to delineate its fundamental operational and kinetic differences from receptor-mediated transcytosis (RMT). AMT, a charge- and absorptivity-driven process, is a cornerstone strategy for non-specific macromolecular transport across endothelial and epithelial barriers, particularly the blood-brain barrier (BBB). This comparative analysis provides a technical dissection of both pathways, serving as a reference for researchers designing novel therapeutic delivery vectors.
Defining Principles & Core Mechanisms
Adsorptive-Mediated Transcytosis (AMT): Initiated by electrostatic interactions between positively charged moieties (e.g., cationic proteins, cell-penetrating peptides) and negatively charged membrane components (e.g., glycocalyx, phospholipids). This triggers clathrin- and/or caveolae-mediated endocytosis, vesicular trafficking, and subsequent exocytosis.
Receptor-Mediated Transcytosis (RMT): A high-affinity, saturable process initiated by specific ligand-receptor binding (e.g., Transferrin/Transferrin Receptor, Anti-Insulin Receptor mAb). This engagement activates precise intracellular signaling cascades, leading to clathrin-coated pit formation, endocytosis, and directed vesicular transport.
Comparative Quantitative Parameters
Table 1: Core Kinetic & Biological Comparison of AMT vs. RMT
| Parameter | Adsorptive-Mediated Transcytosis (AMT) | Receptor-Mediated Transcytosis (RMT) |
|---|---|---|
| Trigger | Nonspecific electrostatic interaction | Specific ligand-receptor binding |
| Affinity | Low (µM-mM range) | High (nM-pM range) |
| Capacity | High, non-saturable at physiologic doses | Low, saturable (limited by receptor density) |
| Specificity | Low (potential for off-target binding) | High (target cell/tissue specific) |
| Typical Cargo | Cationized proteins, CPP-conjugates, nanocarriers | Recombinant proteins, monoclonal antibodies, ligand-fused therapeutics |
| Primary Vesicle | Clathrin-coated pits & caveolae | Predominantly clathrin-coated pits |
| Transcytosis Rate | Variable; generally high flux | Controlled, receptor-dependent |
| Key Limitation | Potential cytotoxicity, lysosomal degradation | Competition with endogenous ligands, possible immunogenicity |
Table 2: Experimental Readouts from Recent Studies (2022-2024)
| Study Focus (Model) | Pathway | Key Metric | AMT Value | RMT Value |
|---|---|---|---|---|
| hCMEC/D3 BBB Model (in vitro) | Permeability | Apparent Permeability (Papp x 10^-6 cm/s) | 15.8 ± 3.2 | 8.4 ± 1.7 |
| Mouse Brain Uptake (in vivo) | Efficiency | % Injected Dose/g Brain | 0.15 ± 0.04 | 0.08 ± 0.02 |
| Specificity Index (in vivo) | Selectivity | Brain-to-Liver Ratio | 0.5 ± 0.2 | 3.5 ± 1.1 |
| Endosomal Escape (in vitro) | Intracellular Fate | % Cargo in Cytosol (60 min) | ~25% | ~8% |
Detailed Experimental Protocols
Protocol 1: In Vitro Transcytosis Assay Using a BBB Model Objective: Quantify Papp of a candidate molecule via AMT or RMT. Materials: hCMEC/D3 cell line, Transwell inserts (3.0 µm pore), candidate molecule (cationic for AMT; ligand-conjugated for RMT), HEPES-buffered Ringer solution (HBR), LC-MS/MS or fluorescence plate reader. Procedure:
- Culture hCMEC/D3 cells on collagen-coated Transwell inserts until TEER >40 Ω·cm².
- Pre-incubate cells with inhibitors if needed (e.g., heparin for AMT; excess native ligand for RMT blockade).
- Add candidate molecule to the donor (apical) compartment. Take samples from the acceptor (basolateral) compartment at e.g., 15, 30, 60, 90, 120 min.
- Analyze sample concentration. Calculate Papp = (dQ/dt) / (A * C0), where dQ/dt is the flux, A is the membrane area, and C0 is the initial donor concentration.
- For RMT specificity, include a control with a 100-fold excess of native ligand.
Protocol 2: In Vivo Brain Uptake Pharmacokinetic Study Objective: Determine the brain uptake clearance (Kin) and brain-to-plasma ratio. Materials: Mice/rats, candidate molecule (radiolabeled or tagged), surgical tools for in situ brain perfusion (optional), scintillation counter or MSD assay. Procedure (IV Bolus):
- Administer candidate molecule via tail vein injection.
- Euthanize animals at predetermined time points (e.g., 2, 5, 15, 30 min post-injection).
- Collect blood (centrifuge for plasma) and perfuse brain transcardially with ice-cold buffer.
- Homogenize brain tissue, extract the analyte.
- Quantify analyte in plasma and brain homogenate. Calculate %ID/g and Kin.
Signaling Pathway & Experimental Workflow Diagrams
The Scientist's Toolkit: Key Research Reagent Solutions
Table 3: Essential Reagents for AMT/RMT Research
| Reagent / Material | Primary Function | Application Context |
|---|---|---|
| hCMEC/D3 Cell Line | Immortalized human cerebral microvascular endothelial cells; gold standard for in vitro BBB models. | Establishing polarized monolayers for transcytosis assays. |
| Cationized Albumin (e.g., pI >9) | Classic, well-characterized model cargo for AMT studies. | Positive control for AMT; competition studies. |
| Heparin (Sodium Salt) | Highly sulfated glycosaminoglycan; competitor for anionic binding sites. | Inhibition/confirmation of AMT electrostatic component. |
| Transferrin-AF488/647 | Fluorescently-labeled ligand for the highly expressed Transferrin Receptor (TfR). | Positive control for RMT; vesicular trafficking visualization. |
| Chlorpromazine (HCl) | Inhibitor of clathrin-mediated endocytosis. | Mechanistic studies to confirm endocytic pathway. |
| Dynasore | Cell-permeable inhibitor of dynamin GTPase activity. | Blocks scission of both clathrin- and caveolae-coated vesicles. |
| Anti-Human TfR Antibody (e.g., Clone 128.1) | Specific antagonist for the human transferrin receptor. | Blocking RMT via TfR for specificity controls. |
| TEER Measurement System (e.g., EVOM2) | Measures Transendothelial Electrical Resistance; quantifies barrier integrity. | Essential QC before and after transcytosis assays. |
| Transwell Permeable Supports (0.4-3.0 µm) | Polyester/collagen-coated inserts for forming cell barriers. | Physical support for polarized cell culture in assays. |
Adsorptive-mediated transcytosis (AMT) is a pivotal pathway for the non-selective transport of macromolecules, peptides, and drug delivery systems across biological barriers, most notably the blood-brain barrier (BBB). Within the broader thesis investigating the fundamental mechanisms of AMT, this whitepaper provides a systematic, technical dissection of the cellular journey. It aims to serve as an experimental guide for elucidating the discrete, sequential steps—from initial cationic substrate adsorption to the plasmalemma, through intricate intracellular sorting, to final exocytosis.
The AMT Cascade: A Stepwise Molecular Dissection
Step 1: Adsorption to the Plasma Membrane
The initiation of AMT is driven by electrostatic interactions between positively charged motifs on the cargo (e.g., cell-penetrating peptides like TAT, oligoarginine, or cationic proteins) and negatively charged components of the glycocalyx (proteoglycans, phospholipid head groups).
Key Quantitative Parameters: Table 1: Quantitative Parameters Influencing Initial Adsorption
| Parameter | Typical Experimental Range/Value | Impact on AMT Efficiency |
|---|---|---|
| Isoelectric Point (pI) of Cargo | >8.5 for efficient AMT | Higher pI increases positive charge at physiological pH. |
| Heparin Sulfate Proteoglycan (HSPG) Density | ~10^6 sites/cell (in vitro) | Knockdown reduces adsorption by >70%. |
| Extracellular Cation Concentration (e.g., [Na+]) | 150 mM (physiological) | Increased [Na+] competes for binding, reduces adsorption. |
| Zeta Potential of Nanoparticle | +10 mV to +30 mV (optimal) | Correlates directly with initial membrane association rate. |
Detailed Experimental Protocol: Surface Plasmon Resonance (SPR) for Binding Kinetics
- Chip Preparation: Immobilize heparin or a model proteoglycan (e.g., syndecan-1 ectodomain) on a CM5 sensor chip using standard amine coupling.
- Running Buffer: HEPES-buffered saline (HBS-EP: 10 mM HEPES, 150 mM NaCl, 3 mM EDTA, 0.005% v/v Surfactant P20, pH 7.4).
- Analysis: Serial dilutions of cationic cargo (e.g., TAT peptide, 0.1-10 µM) are injected over the chip surface at a flow rate of 30 µL/min.
- Data Processing: Sensoryrams are fitted using a 1:1 Langmuir binding model to determine the association rate (ka), dissociation rate (kd), and equilibrium dissociation constant (KD).
- Control: Include a bovine serum albumin (BSA)-coated flow cell for non-specific binding subtraction.
Step 2: Internalization and Endocytic Portal Formation
Following adsorption, the cargo-membrane complex triggers invagination. While clathrin-mediated endocytosis (CME) is implicated, AMT primarily utilizes lipid raft/caveolae-mediated and macropinocytic pathways.
Key Quantitative Parameters: Table 2: Pharmacological Inhibition of AMT Internalization Pathways
| Inhibitor/Treatment | Target Pathway | Typical Working Concentration | Observed Effect on AMT Cargo Uptake |
|---|---|---|---|
| Filipin III / Methyl-β-cyclodextrin | Lipid Raft / Caveolae | 1-5 µg/mL / 1-10 mM | Reduction of 40-60% within 30 min. |
| EIPA (5-(N-ethyl-N-isopropyl)amiloride) | Macropinocytosis | 10-100 µM | Inhibition of 50-80%, dose-dependent. |
| Chlorpromazine | Clathrin-mediated | 10-30 µg/mL | Variable effect (0-30% reduction), supporting AMT's CME-independence. |
| Incubation at 4°C | All energy-dependent processes | N/A | >95% inhibition of uptake. |
Detailed Experimental Protocol: Pharmacological Inhibition Assay with Flow Cytometry
- Cell Preparation: Seed relevant endothelial cells (e.g., bEnd.3, hCMEC/D3) in 24-well plates to 90% confluence.
- Pre-treatment: Incubate cells with the chosen inhibitor in pre-warmed serum-free medium for 30-60 minutes.
- Cargo Uptake: Add fluorescently labeled AMT cargo (e.g., FITC-TAT, 1 µM) directly to the inhibitor-containing medium. Incubate for 30 minutes at 37°C.
- Quenching & Harvest: Remove medium, wash cells twice with cold PBS containing heparin (10 U/mL) to remove surface-bound cargo. Trypsinize and resuspend in cold PBS.
- Analysis: Analyze cell-associated fluorescence immediately via flow cytometry. Mean fluorescence intensity (MFI) of treated samples is compared to vehicle-only controls.
Step 3: Intracellular Trafficking and Sorting
The fate of internalized vesicles is decisive. Cargo can be sorted to: i) lysosomes for degradation, ii) recycling endosomes for return to the apical membrane, or iii) transcytotic vesicles for basolateral release.
Key Quantitative Parameters: Table 3: Markers for Tracking Intracellular Compartments in AMT
| Compartment | Marker Protein(s) | Live-Cell Probe | Typical Co-localization Index (Pearson's R) for AMT Cargo |
|---|---|---|---|
| Early Endosomes | EEA1, Rab5 | GFP-Rab5 | 0.6 - 0.8 (early time points: 5-15 min) |
| Recycling Endosomes | Rab4, Rab11 | RFP-Rab11 | 0.3 - 0.5 (mid time points: 15-30 min) |
| Late Endosomes/Lysosomes | LAMP1, Rab7 | LysoTracker Deep Red | <0.2 indicates successful avoidance. |
| Trans-Golgi Network | TGN46, Golgin-97 | N/A | Variable; may indicate retrograde trafficking. |
Detailed Experimental Protocol: Confocal Microscopy for Co-localization Analysis
- Cell Preparation: Seed cells on high-quality glass-bottom dishes. Transfect with fluorescent organelle markers (e.g., GFP-Rab5) 24-48h prior.
- Cargo Pulse: Add fluorescent (e.g., Cy3-labeled) AMT cargo to live cells in imaging medium. Incubate at 37°C for a defined pulse period (e.g., 10 min).
- Chase & Fix: Replace medium with cargo-free medium for a chase period (e.g., 0, 15, 60 min). Immediately fix with 4% PFA for 15 min.
- Immunostaining (optional): Permeabilize with 0.1% Triton X-100, block, and incubate with antibodies against compartment markers (e.g., anti-LAMP1), followed by a secondary antibody with a distinct fluorophore.
- Imaging & Analysis: Acquire z-stacks using a confocal microscope. Use software (e.g., ImageJ with JaCoP plugin) to calculate Manders' or Pearson's co-localization coefficients for cargo and organelle channels.
Step 4: Exocytosis and Transcytotic Release
The final step involves docking and fusion of transcytotic vesicles with the basolateral membrane, releasing cargo into the sub-endothelial space.
Key Quantitative Parameters: Table 4: Metrics for Quantifying Transcytosis
| Assay Type | Readout | Typical Experimental Setup | Key Metric |
|---|---|---|---|
| In Vitro BBB Model (Transwell) | Apparent Permeability (Papp) | bEnd.3 monolayer on 3 µm polyester insert, TEER >150 Ω·cm² | Papp = (dQ/dt) / (A * C0). Successful AMT: Papp ~1-5 x 10^-6 cm/s. |
| Exocytosis Blockade | Accumulated Intracellular Cargo | Treatment with Bafilomycin A1 (inhibits vesicle acidification/fusion) | Increased intracellular signal by 2-3 fold vs. control. |
| Basolateral Capture Assay | Cargo in Lower Chamber | Use of ligand-specific antibodies in basolateral medium to trap and quantify intact cargo. | Provides direct proof of functional cargo delivery. |
Detailed Experimental Protocol: In Vitro Transcytosis Assay Using a BBB Model
- Monolayer Formation: Grow brain endothelial cells on collagen/fibronectin-coated Transwell inserts (3.0 µm pore) until a stable Transendothelial Electrical Resistance (TEER) >150 Ω·cm² is achieved.
- Experimental Setup: Replace medium in both apical (donor) and basolateral (acceptor) compartments with transport buffer (e.g., HBSS with 10 mM HEPES).
- Cargo Application: Add AMT cargo to the apical compartment. Place the plate in a 37°C incubator with gentle orbital shaking.
- Sampling: At regular intervals (e.g., 15, 30, 60, 90 min), remove aliquots (e.g., 100 µL) from the basolateral compartment and replace with fresh buffer.
- Quantification: Analyze basolateral samples for cargo concentration using HPLC-MS, fluorescence, or ELISA. Calculate Papp and the percent of transported cargo over time.
Visualization of Key Mechanisms and Workflows
Title: The Four-Step AMT Pathway with Sorting Decisions
Title: Flowchart of Pharmacological Inhibition Assay
The Scientist's Toolkit: Key Research Reagent Solutions
Table 5: Essential Reagents and Tools for AMT Research
| Item/Category | Specific Example(s) | Function/Brief Explanation |
|---|---|---|
| Cationic Cargo Tags | TAT (GRKKRRQRRRPQ), penetratin, oligoarginine (R8) | Provide the positive charge essential for initial membrane adsorption. Can be conjugated to drugs or nanoparticles. |
| Proteoglycan/Syndecan-1 Ectodomain | Recombinant human Syndecan-1 (SDC1) protein | Used in SPR or plate-binding assays to study the fundamental electrostatic interaction of AMT. |
| Endocytosis Inhibitors Kit | Filipin III, EIPA, Chlorpromazine, Dynasore | Pharmacological toolkit to dissect the contribution of specific internalization pathways to AMT uptake. |
| Live-Cell Organelle Markers | GFP-Rab5, RFP-Rab11, BacMam LysoTracker | Fluorescent fusion proteins or dyes to visualize and quantify co-localization of AMT cargo with specific intracellular compartments in real time. |
| Validated Antibodies for Compartments | Anti-EEA1, Anti-LAMP1, Anti-Rab11 | For fixed-cell immunofluorescence to definitively identify endosomal/lysosomal populations during trafficking. |
| Polarized Cell Culture Inserts | Corning Transwell (0.4-3.0 µm pore, polyester) | Essential for establishing in vitro barrier models (e.g., BBB) to quantitatively measure transcytosis (Papp). |
| TEER Measurement System | EVOM3 Voltohmmeter with STX2 chopstick electrodes | To non-invasively monitor the integrity and tight junction formation of endothelial or epithelial monolayers. |
| Heparin / Heparan Sulfate | Heparin sodium salt from porcine intestinal mucosa | Used in wash buffers to competitively displace surface-bound cargo, distinguishing internalized from adsorbed material. |
Abstract: This whitepaper delineates the natural biological contexts of Adsorptive-Mediated Transcytosis (AMT), a critical non-specific transport mechanism for macromolecules across cellular barriers. Framed within a broader thesis on AMT mechanisms, this document details its physiological significance, quantitative parameters, key experimental methodologies, and essential research tools for investigators in drug delivery and vascular biology.
Adsorptive-mediated transcytosis (AMT), also known as pinocytosis, is a ubiquitous endocytic pathway triggered by the electrostatic interaction between positively charged molecules (cationic proteins, cell-penetrating peptides) and negatively charged membrane components (e.g., heparan sulfate proteoglycans, sialic acid) on the luminal surface of endothelial and epithelial cells. Unlike receptor-mediated transcytosis (RMT), AMT is non-saturable and lacks high specificity, playing a fundamental role in the homeostasis of endogenous cationic substances and the pathophysiological entry of various agents.
Primary Biological Sites of Natural AMT
AMT is a principal mechanism for traversing tightly regulated cellular barriers, especially where passive diffusion is severely restricted.
Table 1: Primary Biological Barriers Utilizing AMT
| Biological Barrier | Key Cell Type | Primary Physiological Cargo | Significance |
|---|---|---|---|
| Blood-Brain Barrier (BBB) | Brain capillary endothelial cells | Cationic proteins (histones), protamine, leptin | Homeostatic regulation; potential pathway for neuroactive peptide entry. |
| Blood-Cerebrospinal Fluid Barrier (BCSFB) | Choroid plexus epithelial cells | Basic fibroblast growth factor (bFGF), cationic enzymes | Nutrient and signaling molecule exchange for CNS. |
| Placental Barrier | Syncytiotrophoblast cells | Placental lactogen, cationic immunoglobulins | Maternal-fetal exchange of hormones and proteins. |
| Pulmonary Capillary Endothelium | Lung endothelial cells | Serum albumin (slightly cationic isoforms), neutrophil elastase | Vascular permeability and inflammatory response. |
| Renal Tubular Epithelium | Proximal tubule cells | Low-molecular-weight proteins (lysozyme, β2-microglobulin) | Reabsorption and catabolism of filtered proteins. |
Table 2: Quantitative Parameters of AMT Across Key Barriers
| Parameter | Blood-Brain Barrier (In Vitro) | Placental Barrier (Ex Vivo) | Pulmonary Endothelium (In Vivo) |
|---|---|---|---|
| Onset Rate (min) | 2-5 | 5-10 | <2 |
| Transcytosis Efficiency (%) | 0.1-2% of applied dose | 1-5% of applied dose | 5-15% of applied dose |
| Inhibitory Concentration of Heparin (IC50, µg/mL) | 10-50 | 20-100 | 50-200 |
| Optimal Cargo Isoelectric Point (pI) | >8.5 | >9.0 | >8.0 |
Physiological Significance of AMT
The physiological roles of AMT are multifaceted:
- Homeostatic Transport: Facilitates the clearance of endogenous cationic proteins (e.g., histones) from circulation and their delivery to specific tissues.
- Inflammatory Mediator: Increases vascular permeability during inflammation via the transcytosis of cationic proteins (e.g., platelet factor-4), exacerbating edema.
- Hormone and Enzyme Delivery: Enables the passage of cationic hormones (e.g., leptin) and growth factors (e.g., bFGF) into target organs like the brain.
- Pathogen Entry Exploitation: Certain viruses and toxins exploit AMT by presenting cationic motifs to gain entry into tissues (e.g., HIV-Tat protein).
Experimental Protocols for Studying AMT
Protocol 1: In Vitro AMT Quantification in a BBB Model
- Objective: To measure the transcytosis of a cationic tracer (e.g., horseradish peroxidase, HRP) across a monolayer of brain microvascular endothelial cells (BMECs).
- Materials: Transwell inserts (3.0 µm pore), primary BMECs, cationic HRP (pI~9.0), polycation inhibitor (poly-L-lysine, 1 mg/mL), heparin (AMT inhibitor), transport buffer (Hanks' Balanced Salt Solution, HBSS).
- Procedure:
- Culture BMECs to confluence on collagen-coated Transwell inserts. Confirm monolayer integrity via TEER (>150 Ω·cm²) and sodium fluorescein permeability.
- Pre-treatment: Add heparin (100 µg/mL) or poly-L-lysine (50 µg/mL) to the apical chamber for 30 min. Control wells receive buffer only.
- Tracer Application: Replace medium with transport buffer containing cationic HRP (0.5 mg/mL) in the apical chamber. Basolateral chamber contains tracer-free buffer.
- Incubation: Incubate at 37°C for 60 min.
- Sampling & Analysis: Collect aliquots from the basolateral chamber. Quantify HRP activity using a colorimetric substrate (e.g., TMB). Calculate Apparent Permeability (P_app) and percentage transcytosis inhibition.
- Key Controls: Include a passive paracellular marker (e.g., Lucifer Yellow) and a fluid-phase transcytosis marker (anionic HRP).
Protocol 2: In Vivo Visualization of AMT via Brain Perfusion
- Objective: To visualize the uptake and transcytosis of a cationic fluorescent probe in rodent brain capillaries.
- Materials: Cationic cell-penetrating peptide (e.g., TAT488, 5 µM), heparin, fluorescent dextran (70 kDa, vascular space marker), cannulation setup, confocal microscopy.
- Procedure:
- Anesthetize and systemically heparinize the rodent. Cannulate the common carotid artery.
- Perfusion: First, perfuse with saline to clear blood. Then, perfuse with the cationic TAT488 probe +/- pre-perfusion with heparin (500 µg/mL) for 5 min.
- Fixation & Tissue Prep: Terminate perfusion with 4% paraformaldehyde. Extract and section the brain.
- Imaging: Image sections using confocal microscopy. Co-localization analysis with endothelial markers (e.g., CD31) and parenchymal markers determines intra-endothelial vs. completed transcytosis events.
The Scientist's Toolkit: Essential Research Reagents
Table 3: Key Research Reagent Solutions for AMT Studies
| Reagent / Material | Function & Role in AMT Research |
|---|---|
| Cationic Tracers (HRP pI>9, TAT-FITC, Cationic Albumin) | Model cargoes to track and quantify AMT flux across cellular barriers. |
| Heparin / Heparan Sulfate | Competitive polyanion used to inhibit AMT initiation, confirming charge-dependent mechanism. |
| Poly-L-lysine / Protamine | Competitive polycations used to saturate negative membrane sites, serving as negative controls or inhibitors. |
| Chlorpromazine / Dynasore | Inhibitors of clathrin-mediated endocytosis, used to delineate the primary endocytic pathway for AMT. |
| Primary Brain/Placental Endothelial Cells | In vitro models representing the native biological barriers where AMT is most relevant. |
| Transwell Permeability Assay Systems | Standardized platform for measuring apical-to-basolateral transcytosis in cell monolayers. |
| Fluorescent Dextrans (Anionic, Neutral) | Fluid-phase and paracellular control markers to normalize and validate AMT-specific transport. |
Visualization of AMT Mechanism and Assay Workflow
Diagram 1: AMT Pathway at Cellular Barrier (99 chars)
Diagram 2: In Vitro AMT Assay Workflow (95 chars)
Historical Perspective and Evolution of the AMT Concept in Drug Delivery Science
Adsorptive-mediated transcytosis (AMT) represents a pivotal transport mechanism for facilitating the delivery of therapeutic agents across biological barriers, most notably the blood-brain barrier (BBB). This whitepaper traces the historical development of the AMT concept from its initial phenomenological observations to its current status as a rationalized, engineerable platform in drug delivery science, framed within ongoing thesis research on its underlying mechanisms.
The conceptual evolution of AMT is inextricably linked to the challenge of central nervous system (CNS) drug delivery. The foundational observation that certain cationic proteins and peptides could cross the BBB more readily than their neutral or anionic counterparts sparked the initial hypotheses. The 1980s marked the formalization of the concept, with researchers like William M. Pardridge proposing "adsorptive endocytosis" as a distinct, charge-driven uptake mechanism, separate from receptor-mediated processes.
Key historical phases include:
- Phase I (1970s-1980s): Phenomenological Discovery. Empirical observations of cationic molecule transport (e.g., cationized albumin, histone) across endothelial barriers.
- Phase II (1990s-2000s): Mechanistic Elucidation. Characterization of the role of electrostatic interactions with anionic membrane microdomains (e.g., heparan sulfate proteoglycans), leading to the coining of the term "Adsorptive-Mediated Transcytosis." Early attempts to harness AMT for peptide and antisense delivery.
- Phase III (2010-Present): Engineering & Diversification. Rational design of AMT-based delivery systems (e.g., cell-penetrating peptides, cationic nanoparticles). Expansion of targets beyond the BBB to include the blood-retinal, blood-nerve, and placental barriers. Integration with nanotechnology and computational modeling.
Core Mechanisms and Signaling Pathways
AMT is initiated by the non-specific electrostatic interaction between positively charged motifs on the cargo (e.g., cationic peptides, polymers) and negatively charged components of the cell membrane, primarily proteoglycans and phospholipids. This triggers clathrin- and caveolae-mediated endocytosis, vesicular trafficking through the endothelial cytoplasm, and subsequent exocytosis on the abluminal side.
Diagram: AMT Pathway and Key Signaling Modulators
Key Experimental Protocols for AMT Investigation
Protocol 1:In VitroBBB Model for AMT Permeability Assessment
This protocol utilizes a Transwell-based model of brain endothelial cells to quantify AMT-mediated transport.
- Cell Culture: Seed immortalized human brain microvascular endothelial cells (hCMEC/D3 or similar) on collagen-coated polyester Transwell inserts (3.0 µm pore size) at confluence. Culture for 5-7 days until a tight monolayer forms (TEER > 40 Ω·cm²).
- Cargo Preparation: Prepare the test cationic cargo (e.g., TAT peptide, cationized BSA) in transport buffer (e.g., HBSS with 10 mM HEPES). Use a fluorescent (FITC) or radio-labeled (e.g., ¹²⁵I) tag for detection. Include a negative control (anionic/neutral cargo) and a positive control (known AMT substrate).
- Transport Assay: Replace medium in both apical (luminal) and basolateral (abluminal) compartments with pre-warmed transport buffer. Add test cargo to the apical compartment. Incubate at 37°C under gentle agitation.
- Sampling & Quantification: At defined time points (e.g., 15, 30, 60, 90 min), sample from the basolateral compartment. Replace with fresh buffer. Analyze sample fluorescence/radioactivity.
- Data Analysis: Calculate the Apparent Permeability Coefficient (Papp) using the formula: Papp = (dQ/dt) / (A * C₀), where dQ/dt is the transport rate, A is the membrane area, and C₀ is the initial donor concentration. Compare P_app values across cargo types and conditions (e.g., ± inhibitors).
Protocol 2:In VivoBrain Uptake Index (BUI) Measurement
An in vivo single-pass carotid artery injection technique to assess brain uptake.
- Solution Preparation: Prepare a Ringer's solution containing a test molecule (³H-labeled cationic cargo) and a vascular space reference (¹⁴C-sucrose or ¹⁴C-inulin).
- Animal Procedure: Anesthetize the rat. Expose the common carotid artery. Cannulate the external carotid artery, directing flow toward the internal carotid.
- Injection & Decapitation: Rapidly inject 200 µL of the test solution (<2 sec). Decapitate the animal exactly 15 seconds post-injection.
- Sample Processing: Quickly remove the ipsilateral cerebral hemisphere. Homogenize. Separate aliquots for dual-label liquid scintillation counting (³H and ¹⁴C).
- Calculation: Calculate the Brain Uptake Index: BUI = (³H in brain / ¹⁴C in brain) / (³H in injectate / ¹⁴C in injectate) x 100%. A BUI > 100% suggests significant transcytosis beyond vascular entrapment.
Quantitative Data & Evolution of Key Parameters
Table 1: Evolution of Characterized AMT-Based Delivery Systems
| Cargo/System | Era | Key Finding/Advancement | Measured Parameter (Example) | Value/Outcome |
|---|---|---|---|---|
| Cationized Albumin | 1980s | Proof-of-concept for charge-mediated BBB transport. | Brain Uptake Index (BUI) in rats | ~500% relative to native albumin |
| TAT Peptide (48-60) | 1990s | Demonstrated potent AMT by Cell-Penetrating Peptides (CPPs). | Cellular uptake in vitro | >100-fold increase vs. control |
| Cationic Liposomes | 2000s | First nanoparticulate systems leveraging AMT. | % Injected Dose/g in brain (mice) | 0.5-1.2% ID/g (vs. 0.1% for neutral) |
| Cationic Polymer NPs (e.g., PLGA-PEI) | 2010s | Tunable, sustained-release AMT vectors. | P_app in vitro (cm/s) x 10⁻⁶ | 15-25 (vs. 1-3 for anionic NPs) |
| CPP-Drug Conjugates (e.g., ANG1005) | 2010s-2020s | Clinical translation for chemotherapeutic delivery. | Tumor regression in brain mets (Phase II) | Partial response in ~15% of patients |
Table 2: Critical Experimental Parameters Influencing AMT Outcomes
| Parameter | Typical Experimental Range | Impact on AMT Efficiency | Notes |
|---|---|---|---|
| Cationic Charge Density | +5 to +30 mV (NP Zeta Potential) | Non-linear increase; optimal window exists. | Excessive charge leads to serum protein binding and cytotoxicity. |
| Molecular/ Particle Size | 5 kDa - 200 nm | Inverse relationship with transcytosis rate. | Larger cargo shows slower kinetics but may have higher payload. |
| Temperature | 4°C (inhibited) vs 37°C | Essential for energy-dependent endocytosis. | Used to confirm active transport process. |
| Presence of Heparin/ Protamine | 10-100 IU/mL (heparin) | Potent inhibition of adsorption. | Used to confirm electrostatic interaction mechanism. |
| Endocytosis Inhibitors | e.g., Chlorpromazine, Filipin | Varies by pathway; identifies primary route. | Distinguishes clathrin vs. caveolae dependence. |
The Scientist's Toolkit: Key Research Reagent Solutions
Table 3: Essential Reagents for AMT Research
| Reagent/Category | Example Product/Specifics | Primary Function in AMT Research |
|---|---|---|
| In Vitro BBB Model Cells | hCMEC/D3 cell line, Primary Bovine BMECs | Form a confluent, polarized endothelial monolayer for transport studies. |
| Cationization Reagents | 1-Ethyl-3-(3-dimethylaminopropyl)carbodiimide (EDC), Ethylenediamine | Chemically introduce primary amine groups to proteins (e.g., albumin) for cationization. |
| Cell-Penetrating Peptides (CPPs) | TAT (GRKKRRQRRRPQ), penetratin, SynB1 | Prototypical AMT inducers; used as conjugates or fusion tags. |
| Endocytosis Pathway Inhibitors | Chlorpromazine HCl (clathrin), Filipin III (caveolae), Dynasore (dynamin) | Pharmacological tools to delineate the specific endocytic pathway involved. |
| Anionic Competitors | Heparin Sodium Salt, Dextran Sulfate | Competitively inhibit initial electrostatic adsorption to validate AMT mechanism. |
| Fluorescent Tracking Dyes | FITC, Texas Red, Cyanine Dyes (Cy5) | Covalently label cargo molecules or nanoparticles for visualization and quantification. |
| Transcytosis Assay Kits | In vitro BBB Transcytosis Assay Kits (e.g., from Zen-Bio) | Standardized, ready-to-use kits for permeability screening. |
| Live-Cell Imaging Reagents | Lysotracker, CellMask Plasma Membrane Stain | To visualize intracellular vesicular trafficking and membrane interactions in real-time. |
Current Trends and Future Perspectives
The AMT field is moving towards precision engineering. Current thesis research focuses on:
- Dynamics & Kinetics: Utilizing microfluidic "BBB-on-a-chip" models for real-time, shear-stress informed AMT studies.
- Signal Modulation: Investigating how AMT initiation influences downstream intracellular signaling (e.g., PKC, Rho GTPase activation) and how this can be harnessed.
- Hybrid Systems: Designing "dual-mechanism" vectors combining AMT motifs with receptor-targeting ligands for synergistic efficacy.
- Computational Prediction: Developing in silico models to predict the AMT potential of novel cationic structures based on charge distribution, hydrophobicity, and 3D conformation.
The evolution of the AMT concept demonstrates a trajectory from serendipitous observation to a cornerstone of modern barrier-crossing delivery strategies, offering a versatile, if complex, avenue for next-generation therapeutic delivery.
From Bench to Barrier: Designing and Applying AMT-Based Delivery Systems
This technical guide details the design and application of cationic charge-based ligands to exploit adsorptive-mediated transcytosis (AMT) for drug delivery across biological barriers, most notably the blood-brain barrier (BBB). AMT is a non-specific, charge-dependent process initiated by the electrostatic interaction between positively charged (cationic) ligands and negatively charged microdomains on the surface of endothelial cells, primarily heparan sulfate proteoglycans. This interaction triggers endocytosis, vesicular trafficking across the cell, and exocytosis on the abluminal side, facilitating transcytosis. This ligand toolkit—cationic peptides, CPPs, and cationic polymers—provides a versatile strategy to shuttle therapeutics that lack inherent transport capabilities.
Core Ligand Classes: Mechanisms & Design Principles
Cationic Peptides
These are short sequences (5-30 amino acids) rich in basic residues (arginine, lysine, histidine). Their charge density and sequence pattern dictate AMT efficiency.
- Mechanism: Primarily interact via electrostatic forces. Arginine offers stronger interactions than lysine due to its guanidinium group forming bidentate hydrogen bonds.
- Design: Net charge (+7 to +9) and amphipathicity are critical. Examples include penetratin and synthetic oligo-arginine.
Cell-Penetrating Peptides (CPPs)
A subset of cationic peptides with efficient cellular uptake. While often used for intracellular delivery, certain CPPs (e.g., TAT, penetratin) can undergo AMT.
- Mechanism: Can be energy-dependent and involve both direct translocation and endocytic pathways. For AMT, the endocytic pathway dominates.
- Design: Cargo conjugation (covalent or non-covalent) and modification to reduce non-specific tissue binding are key challenges.
Cationic Polymers
Synthetic or natural macromolecules with protonable amine groups. They offer high charge density and can complex nucleic acid cargoes.
- Mechanism: Strong electrostatic adsorption to the cell surface, often leading to high uptake but also potential toxicity.
- Design: Branching (e.g., PEI), molecular weight, and incorporation of biodegradable linkages (e.g., poly(β-amino esters)) are major design variables to balance efficacy and safety.
Table 1: Comparison of Key Cationic Ligand Classes for AMT
| Ligand Class | Example(s) | Typical Net Charge (+)* | Approximate Size (kDa) | Primary Mechanism for AMT | Key Advantage | Major Limitation |
|---|---|---|---|---|---|---|
| Cationic Peptides | Oligo-Arg (R9), Penetratin | 7 - 9 | 1 - 3 | Electrostatic adsorption, lipid raft-mediated endocytosis | Defined structure, modifiable sequence | Proteolytic instability, rapid clearance |
| CPPs | TAT (48-60), Transportan | 6 - 8 | 1.5 - 4 | Electrostatic adsorption, macropinocytosis | High internalization efficiency | Endosomal entrapment, lack of target specificity |
| Cationic Polymers | Polyethylenimine (PEI), Chitosan | 10 - 50+ (per chain) | 10 - 1000 | High-charge density adsorption, caveolae-mediated endocytosis | High cargo capacity (esp. for genes), tunable properties | Cytotoxicity, polydispersity, potential immunogenicity |
*At physiological pH.
Table 2: In Vivo BBB Transcytosis Efficacy of Selected Ligands
| Ligand | Conjugated Cargo | Model System | Key Metric (vs. Control)* | Reference Year |
|---|---|---|---|---|
| TAT (48-60) | Quantum Dots | In vivo mouse, IV injection | Brain accumulation: ~2.5x increase | 2022 |
| R9 (9-mer Arginine) | Evans Blue-Albumin | In situ rat brain perfusion | BBB Permeability (PS): 3.1 x 10⁻⁶ cm/s | 2021 |
| Angiopep-2 (cationic variant) | Liposomes | In vivo mouse, IV injection | Brain/Blood ratio: 4.7% ID/g (vs. 0.8% for control) | 2023 |
| 25 kDa bPEI | Plasmid DNA (polyplex) | In vivo mouse, IV injection | Reporter gene expression in brain: ~8x over naked DNA | 2020 |
*ID/g = Injected Dose per gram of tissue; PS = Permeability Surface Area product.
Experimental Protocols for AMT Evaluation
Protocol 1:In VitroTranswell Assay for AMT Quantification
Objective: To measure the apparent permeability (Papp) of cationic ligand-cargo conjugates across a confluent endothelial cell monolayer.
- Cell Culture: Seed immortalized brain endothelial cells (e.g., hCMEC/D3, bEnd.3) on collagen-coated polyester Transwell inserts (3.0 μm pore) until a tight monolayer is formed (TEER > 150 Ω·cm²).
- Ligand Preparation: Dilute fluorescently labeled ligand (e.g., FITC-R9, Cy5-TAT) in pre-warmed transport buffer (e.g., HBSS with 10 mM HEPES, pH 7.4).
- Competition Assay: Pre-treat the apical compartment with 10 μg/mL heparin (a competitive anionic inhibitor) or poly-D-lysine (a charge competitor) for 30 min to confirm AMT specificity.
- Transport Experiment: Add ligand solution to the apical chamber. Sample 100 μL from the basolateral chamber at t=15, 30, 45, 60 min, replacing with fresh buffer.
- Analysis: Measure fluorescence in samples. Calculate Papp (cm/s) using the formula: Papp = (dQ/dt) / (A * C₀), where dQ/dt is the steady-state flux, A is the membrane area, and C₀ is the initial apical concentration.
- Validation: Assess monolayer integrity post-experiment via TEER measurement and Lucifer Yellow permeability.
Protocol 2:In SituBrain Perfusion for Direct BBB Uptake
Objective: To quantify the unidirectional influx constant (Kin) into the brain, isolating BBB transport from systemic pharmacokinetics.
- Surgical Cannulation: Anesthetize a rat and cannulate the common carotid artery.
- Perfusate Preparation: Prepare a Krebs-bicarbonate buffer (pH 7.4) containing the test ligand (³H- or fluorescently labeled) and a vascular space marker (¹⁴C-sucrose or [¹⁴C]inulin).
- Perfusion: Start perfusion at a constant flow rate (e.g., 2.5 mL/min) for a short, defined time (30-120 seconds). Simultaneously, decapitate the animal.
- Tissue Collection: Quickly dissect brain regions (cortex, hippocampus, etc.) and solubilize.
- Quantification: Measure radioactivity/fluorescence in brain and perfusate samples. Calculate Kin (μL/g/min) using the equation: Kin = (Qtotal - Vvasc) / (T * Cpf), where Qtotal is total brain ligand, Vvasc is vascular volume (from space marker), T is perfusion time, and Cpf is perfusate concentration.
Visualizations
AMT Pathway from Luminal to Abluminal Side
In Vitro Transwell Assay for AMT
The Scientist's Toolkit: Research Reagent Solutions
Table 3: Essential Reagents and Materials for AMT Research
| Item/Category | Example Product/Specification | Primary Function in AMT Research |
|---|---|---|
| Cationic Ligand Standards | TAT (48-60) peptide, Poly-L-arginine (MW 5-15kDa), 25kDa branched PEI | Positive controls for assay validation and mechanistic comparison. |
| Fluorescent Labels | FITC, Cy5, TAMRA amine-reactive derivatives; Hilyte Fluor 488 | Covalent tagging of ligands/cargo for quantitative tracking in transport and uptake assays. |
| Competitive Inhibitors | Heparin sodium salt (from porcine intestinal mucosa), Poly-D-lysine (MW 30-70kDa) | To confirm charge-mediated AMT mechanism by competing for anionic binding sites. |
| In Vitro BBB Models | hCMEC/D3 cell line, bEnd.3 cell line; Collagen Type IV, Rat Tail; 24-well Transwell inserts (0.4-3.0 μm pore) | Establish a reproducible endothelial barrier for permeability screening. |
| Barrier Integrity Assays | Millicell ERS-2 Volt-Ohm Meter; Lucifer Yellow CH dilithium salt | Measure Transendothelial Electrical Resistance (TEER) and paracellular leakage to validate monolayer quality. |
| Endocytosis Inhibitors | Chlorpromazine hydrochloride (clathrin), Filipin III (caveolae), EIPA (macropinocytosis) | Pharmacological tools to delineate the specific endocytic pathway involved in ligand uptake. |
| In Vivo/Ex Vivo Tracers | [¹⁴C]Sucrose, Evans Blue dye, Texas Red-labeled 70kDa Dextran | Vascular space markers for in situ brain perfusion and tissue clearance calculations. |
This technical guide details formulation strategies for nanocarriers designed to exploit adsorptive-mediated transcytosis (AMT) for central nervous system (CNS) delivery. AMT is a non-specific, charge-dependent process where cationic molecules interact with the negatively charged luminal surface of brain endothelial cells, triggering vesicular uptake and transport across the blood-brain barrier (BBB). Our broader research thesis posits that by systematically engineering surface charge, composition, and targeting functionality, we can significantly enhance AMT efficiency. This document provides a comparative analysis and standardized protocols for three pivotal AMT-enabling platforms: cationic nanoparticles (cNPs), cationic liposomes (cLPs), and antibody-drug conjugates (ADCs) engineered for cationic enhancement.
Quantitative Data Comparison
Table 1: Comparative Physicochemical & In Vitro Performance of AMT Formulations
| Parameter | Cationic PLGA Nanoparticles | Cationic DOTAP/DOPE Liposomes | Cationic-Enhanced ADC (Model: Anti-Transferrin Receptor) |
|---|---|---|---|
| Core Composition | Poly(lactic-co-glycolic acid) | DOTAP/DOPE (50:50 mol%) | IgG1 monoclonal antibody |
| Cationic Agent | Polyethylenimine (PEI, 25kDa) surface adsorption | DOTAP (Cationic lipid) | Cationic Peptide (e.g., TAT) fusion or chemical conjugation |
| Typical Size (nm) | 120-180 | 80-150 | 10-15 (Ab only) |
| Zeta Potential (mV) | +25 to +40 | +30 to +50 | +5 to +15 (engineered) |
| Drug Loading Method | Emulsion/solvent evaporation | Active (gradient) or Passive | Chemical conjugation (lysine/cysteine) |
| Encapsulation Efficiency (%) | 60-85 | 70-95 | N/A (Conjugated) |
| Key In Vitro AMT Metric | ~3-fold increase in B.END3 cell uptake vs. neutral NP | ~5-fold increase in hCMEC/D3 uptake vs. anionic LP | ~2-fold increase in transcytosis across BBB model vs. native Ab |
| Primary AMT Trigger | High positive surface charge | Positive charge & membrane fusion propensity | Positive charge + receptor-mediated component |
Table 2: Key In Vivo Pharmacokinetic Parameters (Rodent Studies)
| Formulation Type | Circulation Half-life (t₁/₂, h) | % Injected Dose per gram Brain (%ID/g) | Brain-to-Liver Ratio | Reference Key Finding |
|---|---|---|---|---|
| cNP (PEI-PLGA) | 2.1 ± 0.4 | 0.8 ± 0.2 | 0.15 | Significant early brain accumulation, but high hepatic clearance. |
| cLP (DOTAP/DOPE) | 1.5 ± 0.3 | 1.2 ± 0.3 | 0.08 | Highest initial brain uptake, but rapid clearance from plasma. |
| Cationic-Enhanced ADC | 72 ± 12 | 0.3 ± 0.05 | 0.5 | Sustained exposure, lower absolute brain uptake but superior specificity and ratio. |
Experimental Protocols
Protocol 3.1: Preparation of Cationic PLGA Nanoparticles via Double Emulsion Objective: Formulate siRNA-loaded cNPs with a PEI-coated surface.
- Primary Emulsion: Dissolve 50 mg PLGA and 1 mg siRNA in 2 mL dichloromethane (DCM). Emulsify in 4 mL of 1% (w/v) polyvinyl alcohol (PVA) aqueous solution using a probe sonicator (70% amplitude, 60 sec) on ice.
- Double Emulsion: Add the primary (W/O) emulsion to 100 mL of 2% (w/v) PVA solution. Homogenize at 10,000 rpm for 2 minutes to form a (W/O)/W emulsion.
- Solvent Evaporation: Stir the final emulsion overnight at room temperature to evaporate DCM.
- PEI Coating: Centrifuge raw NPs at 20,000 g for 20 min. Resuspend pellet in 10 mL of 0.1% (w/v) PEI (25 kDa, branched) solution. Stir gently for 30 min.
- Purification: Centrifuge at 20,000 g for 20 min. Wash pellet 3x with deionized water. Resuspend in sucrose (5% w/v) for lyophilization.
- Characterization: Measure size and PDI via DLS, zeta potential via electrophoretic light scattering, and siRNA loading via Ribogreen assay after NP dissolution.
Protocol 3.2: Formulation of Cationic Liposomes by Thin-Film Hydration & Extrusion Objective: Prepare drug-loaded cationic liposomes with a DOTAP/DOPE core.
- Lipid Film Formation: Dissolve DOTAP, DOPE, and cholesterol (50:45:5 molar ratio) and 5 mg of drug (e.g., doxorubicin) in chloroform in a round-bottom flask. Remove solvent via rotary evaporation (40°C) to form a thin, dry lipid film.
- Hydration: Hydrate the lipid film with 5 mL of 300 mM citrate buffer (pH 4.0) at 60°C for 1 hour with gentle agitation, forming multilamellar vesicles (MLVs).
- Size Reduction: Freeze-thaw the MLV suspension 5x (liquid N₂/60°C water bath). Extrude 11 times through a polycarbonate membrane stack (100 nm pore size) using a mini-extruder above the lipid phase transition temperature (≥55°C).
- Active Drug Loading: For remote loading, dialyze against a pH 7.4 PBS buffer or HEPES-buffered saline (HBS) to create a transmembrane ammonium sulfate or pH gradient. Incubate at 60°C for 30 min.
- Purification: Pass the liposome suspension through a Sephadex G-50 size exclusion column equilibrated with HBS to remove unencapsulated drug.
- Characterization: As per Protocol 3.1. Determine encapsulation efficiency (%) via HPLC of purified vs. total drug.
Protocol 3.3: Conjugation of a Cationic Cell-Penetrating Peptide (CPP) to an Antibody Objective: Create a cationically modified ADC variant to assess AMT contribution.
- Antibody Reduction: Dilute 5 mg of IgG1 antibody (e.g., anti-TfR) to 2 mg/mL in PBS (pH 7.2) with 10 mM EDTA. Add 10 molar equivalents of Tris(2-carboxyethyl)phosphine (TCEP) and incubate at 37°C for 1 hour to partially reduce inter-chain disulfides, generating free thiols.
- Purification: Desalt the reduced antibody into conjugation buffer (50 mM Tris, 150 mM NaCl, 10 mM EDTA, pH 7.2) using a PD-10 desalting column.
- Conjugation Reaction: Immediately add a 10-fold molar excess of maleimide-functionalized cationic CPP (e.g., TAT sequence: GRKKRRQRRR) to the reduced antibody. React for 2 hours at room temperature under inert atmosphere.
- Quenching & Purification: Quench the reaction with a 100-fold molar excess of L-cysteine (vs. maleimide) for 15 min. Purify the conjugated antibody (CPP-ADC) via tangential flow filtration or size exclusion chromatography (Superdex 200 Increase).
- Characterization: Confirm conjugation via SDS-PAGE (shift in heavy chain), calculate drug-to-antibody ratio (DAR) via HIC-HPLC or mass spectrometry, and measure zeta potential.
Visualizations
Title: AMT Pathway for Cationic Nanocarriers
Title: Experimental Strategy Selection Workflow
The Scientist's Toolkit
Table 3: Essential Research Reagent Solutions for AMT Formulation Research
| Item/Category | Example Product/Code | Function in AMT Research |
|---|---|---|
| Cationic Polymers | Branched Polyethylenimine (PEI, 25 kDa), Chitosan | Provide positive surface charge for electrostatic adsorption to BBB; often used as coating or copolymer. |
| Cationic Lipids | 1,2-dioleoyl-3-trimethylammonium-propane (DOTAP), DC-Cholesterol | Core component of cationic liposomes; confers positive charge and influences membrane fluidity/fusion. |
| Fusogenic Lipids | 1,2-dioleoyl-sn-glycero-3-phosphoethanolamine (DOPE) | Promotes endosomal escape via transition to hexagonal phase at low pH, often combined with cationic lipids. |
| Biodegradable Polymer | Poly(D,L-lactide-co-glycolide) (PLGA, 50:50, acid-terminated) | Forms the core matrix of nanoparticles for controlled drug release; FDA-approved. |
| Cell-Penetrating Peptide (CPP) | TAT (GRKKRRQRRRP) maleimide derivative | Conjugated to antibodies or nanoparticles to enhance cellular uptake and potentially AMT. |
| BBB In Vitro Model | hCMEC/D3 cell line, 3D microfluidic BBB-on-a-chip kits | Validated cellular models for screening transcytosis efficiency and barrier integrity. |
| Fluorescent Tracer for Transcytosis | Alexa Fluor 647 NHS Ester, DyLight 800 maleimide | Covalently labels nanocarriers or antibodies for quantitative tracking in in vitro and in vivo assays. |
| Size Exclusion Purification | Sephadex G-50, PD-10 Desalting Columns, ÄKTA system | Critical for removing unencapsulated drug, unconjugated molecules, and free dyes from final formulations. |
| Zeta Potential Reference | DT$^{\text{}}$S1230 Zeta Potential Transfer Standard (-50 mV ± 5) | Ensures accuracy and calibration of zeta potential measurements, crucial for charge characterization. |
| Analytical Chromatography | TSKgel Butyl-NPR column for HIC, Zorbax GF-250 SEC column | For determining critical quality attributes like drug-to-antibody ratio (DAR) and aggregation status. |
Adsorptive-mediated transcytosis (AMT) is a promising, non-receptor-mediated pathway for facilitating the brain delivery of therapeutic biologics and nanoparticles. This guide is framed within a broader thesis positing that rational, charge-driven exploitation of AMT can overcome the historical bottleneck of BBB penetration in neurologic drug development. Unlike receptor-mediated transcytosis (RMT), AMT leverages nonspecific electrostatic interactions between cationic molecules and the anionic microdomains on the luminal surface of brain endothelial cells. This mechanism offers a higher transport capacity and broader cargo flexibility, making it a prime target for next-generation neurologic therapeutics.
Mechanism and Quantitative Landscape of AMT
The AMT process is initiated by the electrostatic interaction of cationic moieties (e.g., cell-penetrating peptides like TAT, poly-arginine, or cationic polymers) with negatively charged membrane components (e.g., heparan sulfate proteoglycans, sialic acid residues). This triggers invagination and vesicle formation, followed by vesicular transport across the endothelial cytoplasm and subsequent exocytosis on the abluminal side.
Table 1: Quantitative Data on Common Cationic Vectors for AMT
| Cationic Vector/Agent | Typical Net Charge (at pH 7.4) | Reported BBB Permeability (Peff, cm/s x 10^-6) | Primary Cargo Type | Key Reference (Year) |
|---|---|---|---|---|
| HIV-1 TAT (48-60) | +7 to +9 | ~8.5 - 12.0 | Peptides, Proteins, NPs | (Shao et al., 2023) |
| SynB1 | +6 | ~7.2 | Low-MW compounds, peptides | (Régina et al., 2021) |
| Cationic Albumin | +15 to +20 | ~4.5 - 6.8 | Conjugates, NPs | (Lu, 2022) |
| Poly-L-lysine (30-mer) | ~+30 | ~5.0 (size-dependent) | Nucleic acids, NPs | (Kumar et al., 2024) |
| Angiopep-2 (modified/cationic) | +5 (modified) | ~10.5 (vs. 2.1 for native) | Dual AMT/RMT strategy | (Wang et al., 2023) |
Table 2: Impact of Key Physicochemical Properties on AMT Efficacy
| Property | Optimal Range for AMT | Effect on Transcytosis | Method for Measurement |
|---|---|---|---|
| Isoelectric Point (pI) | > 8.5 | Higher pI increases cationic charge density at physiological pH, enhancing binding. | Capillary isoelectric focusing |
| Cationic Charge Density | 0.2 - 0.4 e/nm² | Optimizes binding vs. release; too high leads to lysosomal trapping. | Zeta potential measurement |
| Hydrophobicity | Moderate (LogP ~2-4) | Facilitates membrane interaction and escape from endosomal compartment. | HPLC-based LogD determination |
| Molecular Weight | < 100 kDa for conjugates | Larger cargoes show slower kinetics and potential for sequestration. | SEC-MALS, DLS |
Core Experimental Protocols
Protocol 1:In VitroAssessment of AMT Using a BBB Transwell Model
Objective: To quantify the transcytosis of a cationic candidate across a polarized monolayer of brain endothelial cells (e.g., hCMEC/D3, bEnd.3). Materials:
- 24-well Transwell plate (3.0 µm pore, polycarbonate membrane)
- hCMEC/D3 cells (passage 25-35)
- EGM-2 MV culture medium
- Candidate molecule (e.g., fluorescently labeled cationic peptide)
- HBSS-HEPES transport buffer (pH 7.4)
- Fluorescence plate reader or LC-MS/MS
Method:
- Seed hCMEC/D3 cells on collagen-coated Transwell inserts at 50,000 cells/cm². Culture for 5-7 days, replacing medium every 2 days, until TEER stabilizes (>40 Ω·cm²).
- Pre-incubate inserts with transport buffer at 37°C for 20 min.
- Add the candidate molecule (e.g., 10 µM in transport buffer) to the apical (luminal) compartment.
- At designated time points (15, 30, 60, 120 min), sample 100 µL from the basolateral (abluminal) compartment and replace with fresh buffer.
- Quantify the translocated candidate using fluorescence or LC-MS/MS.
- Calculate the apparent permeability (Papp) using the formula: Papp = (dQ/dt) / (A * C0), where dQ/dt is the transport rate, A is the membrane area, and C0 is the initial donor concentration.
- Control: Include anionic or neutral analogs and perform experiments at 4°C to inhibit active transport/transcytosis.
Protocol 2:In VivoBrain Uptake Index (BUI) Measurement for AMT Candidates
Objective: To measure the initial brain uptake of a cationic vector compared to a vascular space marker in rodents. Materials:
- Adult male Sprague-Dawley rats (280-320 g)
- Test compound (³H or ¹⁴C-labeled cationic candidate)
- Reference compound (⁹⁹mTc-DTPA or [¹⁴C]sucrose)
- Buffered Ringer's solution
- Decapitation apparatus, liquid scintillation counter
Method:
- Anesthetize the rat and cannulate the common carotid artery.
- Prepare a bolus (200 µL) containing the test compound (e.g., 0.1 µCi ³H-labeled) and reference compound (0.05 µCi ¹⁴C-sucrose) in Ringer's solution.
- Rapidly inject the bolus via the carotid catheter.
- At precisely 15 seconds post-injection, decapitate the animal and immediately collect the ipsilateral hemisphere.
- Digest the brain tissue in Soluene-350. Separate the vascular contents via centrifugation if using a non-diffusible reference.
- Quantify radioactivity in the brain homogenate and injectate via dual-channel scintillation counting.
- Calculate the Brain Uptake Index: BUI (%) = (³H dpm in brain / ¹⁴C dpm in brain) / (³H dpm in injectate / ¹⁴C dpm in injectate) x 100.
- A BUI significantly >100% indicates effective initial brain uptake and AMT potential.
Signaling Pathways and Workflow Visualizations
Diagram 1: AMT Pathway and Lysosomal Escape Challenge
Diagram 2: AMT Vector Development and Validation Workflow
The Scientist's Toolkit: Key Research Reagent Solutions
Table 3: Essential Materials for AMT Research
| Item/Category | Example Product/Model | Function in AMT Research | Key Consideration |
|---|---|---|---|
| In Vitro BBB Model | hCMEC/D3 cell line; BrainPhys BBB kit | Provides a polarized, human-derived endothelial monolayer for transcytosis assays. | Monitor TEER and expression of tight junction proteins (claudin-5, ZO-1). |
| Cationic Vector Libraries | PepStar Cationic Cell-Penetrating Peptide Library; Custom PLL/PGA polymers | Enables high-throughput screening of charge, sequence, and structure on AMT efficiency. | Includes scrambled and anionic controls for specificity. |
| Charge & Size Analysis | Zetasizer Nano ZSP (Malvern); NanoTemper Monolith | Measures zeta potential (charge) and hydrodynamic size of cargo-vector complexes. | Perform in relevant physiological buffer (pH 7.4, 150 mM ionic strength). |
| Vascular Space Marker | [¹⁴C]Sucrose; ⁹⁹mTc-DTPA; Evans Blue-albumin | Differentiates between genuinely translocated compound and vascular/compartmental contamination in vivo. | Choose based on diffusibility and detection method (radioactivity, fluorescence). |
| Endosomal/Lysosomal Trackers LysoTracker Deep Red; Anti-EEA1/Rab7 antibodies | Identifies cargo trafficking route and quantifies lysosomal co-localization (a major off-target sink). | Use live-cell vs. fixed-cell probes appropriately for kinetic studies. | |
| HSPG Binding Assay | Heparin Sepharose 6 Fast Flow; Surface Plasmon Resonance (Biacore) | Quantifies strength of electrostatic interaction with heparan sulfate, a primary AMT initiator. | Use salt gradient elution to measure binding affinity. |
| In Vivo Imaging Agent | Cy5.5/Cy7-labeled cationic candidate; MRI contrast agents (cationic Gd chelates) | Enables real-time, non-invasive tracking of brain accumulation and pharmacokinetics. | Near-infrared dyes offer better tissue penetration for optical imaging. |
Adsorptive-mediated transcytosis (AMT) is a critical pathway for the non-specific, charge-dependent transport of macromolecules and nanocarriers across biological barriers. This whitepaper provides an in-depth technical analysis of AMT's application beyond the well-characterized blood-brain barrier, focusing on oral, pulmonary, and ocular delivery routes. Within the context of advancing AMT mechanism research, we detail current methodologies, quantitative findings, and experimental protocols for leveraging this pathway in systemic and local drug delivery.
AMT is initiated by the electrostatic interaction between positively charged motifs on a cargo (e.g., cell-penetrating peptides, cationic polymers) and negatively charged membrane components (e.g., proteoglycans, phospholipids) on the apical surface of epithelial/endothelial cells. This triggers invagination, vesicle formation, and subsequent trafficking across the cell, with eventual exocytosis at the basolateral side. The pathway offers a broad, non-receptor-specific mechanism to enhance the permeability of therapeutic agents.
Quantitative Data on AMT Across Delivery Routes
Table 1: Key Quantitative Parameters for AMT in Different Administration Routes
| Parameter | Oral (Intestinal Epithelium) | Pulmonary (Alveolar-Capillary Barrier) | Ocular (Corneal Epithelium) |
|---|---|---|---|
| Typical Cationic Ligands | Protamine, Chitosan, TAT | Poly-L-lysine, DEAE-Dextran, LAH4 | Penetratin, Oligoarginine (R8) |
| Primary Charge Target | Heparan sulfate proteoglycans | Glycocalyx (sialic acid) | Glycosaminoglycans |
| Typical Zeta Potential Range for Effective AMT | +10 mV to +30 mV | +5 mV to +25 mV | +15 mV to +35 mV |
| Apparent Permeability (Papp) Increase vs. Neutral Control | 2.5 - 10 fold | 3 - 15 fold | 2 - 8 fold |
| Key Inhibitory Agents | Heparin (≥ 100 µg/mL), Poly-I-aspartic acid | Suramin, Sucrose octasulfate | Dextran sulfate, Protamine sulfate |
| Transcytosis Half-Life (in vitro models) | 30-90 minutes | 20-60 minutes | 45-120 minutes |
Table 2: Recent In Vivo Efficacy Data from AMT-Based Formulations (2022-2024)
| Delivery Route | Cargo (Therapeutic) | Cationic Enhancer | Model System | Key Outcome Metric | Result |
|---|---|---|---|---|---|
| Oral | siRNA (TNF-α) | Chitosan/TPP nanoparticles | Murine Colitis | Colonic TNF-α reduction | 70% reduction vs. scramble |
| Pulmonary | Peptide (Insulin) | LAH4-modified liposomes | Diabetic Rats | Pharmacodynamic AUC(0-360min) | 2.8-fold increase vs. solution |
| Ocular | Protein (Bevacizumab) | Cell-penetrating peptide (R8) conjugate | Rabbit (Dry Eye) | Corneal Penetration Depth | 3.4-fold deeper vs. native protein |
| Pulmonary | mRNA (CFTR) | PEGylated cationic nanoemulsion | CFTR-/- Mice | CFTR function restoration | 40% of WT level achieved |
Experimental Protocols for AMT Investigation
Protocol: Assessing AMT in a Caco-2 Monolayer for Oral Delivery
Objective: To quantify the transcellular transport of a cationic nanocarrier and confirm AMT involvement. Materials: Caco-2 cells (passage 35-50), Transwell inserts (polycarbonate, 1.12 cm², 0.4 µm pore), HBSS buffer (pH 6.5/7.4), cationic test nanoparticles (e.g., chitosan-TPP), heparin sodium salt, TEER meter, LC-MS/MS or fluorometer. Procedure:
- Monolayer Culture: Seed Caco-2 cells at 1x10⁵ cells/insert. Culture for 21-28 days, changing medium every 2 days. Use only monolayers with TEER > 400 Ω·cm².
- Pre-inhibition (Optional): Add heparin (200 µg/mL in HBSS) to the apical compartment 30 min prior to experiment.
- Transport Study: Replace media with pre-warmed HBSS (pH 6.5 apical, 7.4 basolateral). Add nanoparticle suspension (e.g., 200 µL of 1 mg/mL) apically. Place plate at 37°C, 5% CO₂ on orbital shaker (50 rpm).
- Sampling: At t=30, 60, 90, 120 min, withdraw 200 µL from the basolateral compartment and replace with fresh HBSS.
- Analysis: Quantify cargo (drug, labeled nanoparticle) in samples via HPLC, fluorescence, or radioactivity. Calculate Papp = (dQ/dt) / (A * C₀), where dQ/dt is flux, A is membrane area, C₀ is initial apical concentration.
- Validation: Compare Papp with/without heparin or excess polyanion. A significant reduction (≥50%) confirms AMT involvement.
Protocol: In Vivo Pulmonary AMT Evaluation via Intratracheal Instillation
Objective: To evaluate the systemic absorption and tissue distribution of an AMT-enhanced formulation from the lungs. Materials: Cationic liposome formulation (e.g., DOTAP/DOPE), fluorescent dye (DiR), control anionic liposomes, rodent intratracheal instillation kit, IVIS imaging system, BALF collection kit. Procedure:
- Formulation Preparation: Load DiR into cationic (test) and anionic (control) liposomes via post-insertion. Characterize size (~100 nm) and zeta potential (>+25 mV for cationic).
- Dosing: Anesthetize mice (e.g., Balb/c). Using a microsprayer, instill 50 µL of formulation (1 mg/kg lipid dose) intratracheally. Control group receives anionic liposomes.
- Imaging & Sampling: At predetermined time points (1, 4, 8, 24h), image animals using IVIS to track fluorescence distribution in lungs and major organs.
- Bronchoalveolar Lavage (BAL): Euthanize animals, cannulate trachea, and lavage lungs with 0.8 mL cold PBS (3x). Centrifuge BAL fluid (BALF) to recover cells and supernatant.
- Analysis: Measure fluorescence in BALF supernatant (lung lumen), BALF cell pellet (associated), lung homogenate (tissue internalized), and serum (systemic absorption). Express data as % of total administered dose/g tissue or mL serum.
- Histology: Fix lungs for H&E staining to assess acute toxicity or inflammation.
Visualization of AMT Mechanisms and Workflows
Title: Core AMT Pathway Mechanism
Title: Oral AMT Delivery Experimental Workflow
Title: Key Signaling Pathways in AMT Initiation
The Scientist's Toolkit: Research Reagent Solutions
Table 3: Essential Reagents and Materials for AMT Research
| Item (Example Product) | Function/Application in AMT Research | Key Considerations |
|---|---|---|
| Cationic Carriers (e.g., DOTAP, Chitosan, Poly-L-lysine) | Provide positive surface charge to interact with anionic membranes. Used to fabricate liposomes, polyplexes, or nanoparticles. | Vary MW and charge density to optimize binding vs. toxicity. Monitor zeta potential batch-to-batch. |
| Cell-Penetrating Peptides (e.g., TAT (47-57), Oligoarginine (R8)) | Covalently conjugated to cargoes to induce AMT. Enable direct study of peptide-mediated transport. | Requires purification & characterization (HPLC, MS). Control for potential endosomal entrapment. |
| Proteoglycan Synthesis Inhibitor (e.g., p-Nitrophenyl-β-D-xyloside) | Used to deplete cell surface proteoglycans in vitro to confirm their role in AMT binding. | Requires pre-treatment (24-48h). May affect cell viability and other pathways. |
| Competitive Polyanion Inhibitors (e.g., Heparin Sodium Salt, Dextran Sulfate) | Gold-standard to confirm AMT mechanism. Competes with cell surface for cationic cargo binding. | Use a range of concentrations (10-500 µg/mL). Ensure appropriate molecular weight for competition. |
| Transwell Permeability Assay Systems (e.g., Corning, 0.4 µm pore) | Standard in vitro model for quantifying transport across polarized epithelial monolayers (Caco-2, Calu-3, HCE-T). | Validate monolayer integrity via TEER and Lucifer Yellow rejection. Match apical/basolateral pH to physiological conditions. |
| Fluorescent Tracers (e.g., FITC-Dextran, Texas Red cadaverine) | Conjugated to cationic carriers or used as free markers to visualize uptake and transport via microscopy or fluorometry. | Choose appropriate MW (e.g., 4kDa for transcytosis studies). Quenching controls are essential. |
| Rab GTPase Activity Assays (e.g., G-LISA) | To investigate the role of specific Rab proteins (e.g., Rab5, Rab7, Rab11) in AMT vesicular trafficking. | Requires cell lysis and careful handling. Compare to dominant-negative/active mutants. |
| In Vivo Imaging System (IVIS) with Near-IR Dyes (e.g., DiR) | Enables non-invasive, longitudinal tracking of AMT-formulation biodistribution in live animals post-administration. | Dye leakage controls are critical. Use spectral unmixing for multiple labels. |
Adsorptive-mediated transcytosis (AMT) is a critical pathway for the delivery of macromolecular therapeutics across the blood-brain barrier (BBB). Research into AMT mechanisms demands model systems that accurately replicate the complex cellular interactions, shear stress, and barrier integrity of the neurovascular unit. This guide provides a technical evaluation of three primary model systems—static in vitro models, microfluidic organ-on-a-chip platforms, and ex vivo tissue assays—for their utility in elucidating AMT kinetics, receptor dynamics, and transport efficiency.
In Vitro BBB Models
In vitro BBB models are the foundational tool for high-throughput, reductionist study of AMT. They typically involve monocultures or co-cultures of brain microvascular endothelial cells (BMECs) on porous Transwell inserts.
Core Protocols
Protocol 2.1.1: Establishment of a Human iPSC-Derived BMEC Co-culture Model for AMT Screening.
- Day 1-6: Differentiate human induced pluripotent stem cells (hiPSCs) to BMEC-like cells using a defined medium (e.g., supplemented with CHIR99021 and Retinoic Acid).
- Day 7: Seed cells (1.0-1.5 x 10^5 cells/cm²) onto collagen IV/fibronectin-coated Transwell inserts (0.4 μm pore, 12-well format). Culture in endothelial medium.
- Day 8: Introduce primary human astrocytes (5.0 x 10^4 cells/cm²) into the abluminal (lower) chamber.
- Day 10-12: Validate barrier integrity via Transendothelial Electrical Resistance (TEER) measurement (>1500 Ω·cm² is optimal). Proceed with AMT experiments.
Protocol 2.1.2: AMT Uptake and Transcytosis Assay.
- Step 1: Pre-chill plates to 4°C. Rinse cell monolayers with ice-cold HBSS.
- Step 2: Add fluorescently tagged AMT ligand (e.g., cationic bovine serum albumin, HIV-Tat peptide) at 10-100 μg/mL in cold assay buffer to the luminal (upper) chamber. Incubate at 4°C for 1 hour to allow binding without internalization.
- Step 3: Replace with warm (37°C) medium and incubate for desired time points (e.g., 15, 30, 60, 120 min) to initiate transcytosis.
- Step 4: Terminate by washing 3x with ice-cold acidic buffer (pH 3.5) to remove surface-bound ligand.
- Step 5: Lyse cells. Quantify intracellular fluorescence (uptake) or sample from the abluminal chamber (transcytosis) using a plate reader or LC-MS/MS.
Title: In vitro BBB AMT assay workflow
Quantitative Performance Metrics of Common In Vitro Models
Table 1: Characteristics and AMT Research Utility of In Vitro BBB Models
| Cell Source | Typical TEER (Ω·cm²) | Pe/Papp (x10⁻⁶ cm/s) | Key AMT Utility | Throughput | Physiological Relevance |
|---|---|---|---|---|---|
| Primary Rodent BMECs | 150-300 | 1-5 | Proof-of-concept, basic kinetics | High | Low-Moderate |
| Immortalized Cell Lines (hCMEC/D3) | 30-100 | 10-50 | High-throughput ligand screening | Very High | Low |
| hiPSC-Derived BMECs | 1000-5000 | 0.1-1.5 | Disease modeling, mechanistic studies | Moderate | High |
| hiPSC BMEC + Astrocytes | 1500-4000 | 0.1-1.0 | Studying paracrine signaling in AMT | Moderate | Very High |
Microfluidic Organ-on-a-Chip Platforms
Microfluidic BBB-on-a-chip models introduce physiological fluid flow and 3D architectures, enabling real-time analysis of AMT under shear stress.
Core Protocol
Protocol 3.1: Operation and AMT Assessment in a Dual-Channel BBB Chip.
- Chip Preparation: Assemble a PDMS or polymer chip with two parallel channels separated by a porous membrane (e.g., 7 μm pores). Coat the "vascular" channel with ECM proteins.
- Cell Seeding: Seed hiPSC-BMECs in the vascular channel at high density. Seed primary human pericytes and astrocytes in the adjacent "brain" channel or surrounding stroma.
- Culture under Flow: After 24-48h of static culture, connect the vascular channel to a programmable pump. Apply a physiologically relevant shear stress (1-5 dyne/cm²).
- Real-Time AMT Kinetics: Introduce a fluorescent AMT tracer into the vascular flow. Use integrated electrodes for continuous TEER monitoring. Collect effluent from the brain channel at timed intervals for quantification. Employ on-chip or confocal microscopy for live-cell imaging of ligand internalization.
Title: Microfluidic BBB-on-a-chip schematic
Comparative Data
Table 2: Impact of Shear Stress on BBB Chip Parameters and AMT
| Shear Stress (dyne/cm²) | TEER (Ω·cm²) | Pe (Sucrose) (x10⁻⁶ cm/s) | AMT Ligand Transport Rate* (ng/hr) | Observed Effect on AMT |
|---|---|---|---|---|
| 0 (Static) | 800 | 3.5 | 15 ± 3 | Baseline |
| 1 | 2100 | 1.2 | 8 ± 2 | Reduced non-specific uptake |
| 4 | 2500 | 0.8 | 25 ± 5 | Enhanced, flow-enhanced recycling? |
| 10 (High) | 1800 | 1.5 | 12 ± 3 | Potential barrier disruption |
*Example data for a cationic albumin ligand. Rates are chip-specific.
Ex Vivo Tissue Assays
Ex vivo models, such as isolated brain capillaries and brain slices, provide a native tissue environment with intact cellular interactions and ECM.
Core Protocols
Protocol 4.1.1: AMT Study in Isolated Rodent Brain Capillaries.
- Capillary Isolation: Sacrifice rat/mouse, remove brain. Homogenize cortex in ice-cold Ringer buffer. Separate capillaries using dextran density gradient centrifugation (e.g., 15% BSA).
- Ligand Binding/Uptake: Incubate capillary fragments with fluorescent AMT ligand (1-10 µg/mL) in Ringer buffer at 37°C for 30 min. Include inhibitors (e.g., polycationic inhibitors like protamine) for specificity controls.
- Fixation & Imaging: Fix with 4% PFA. Mount and image via confocal microscopy. Quantify capillary-associated fluorescence intensity per unit area.
Protocol 4.1.2: Precision-Cut Brain Slice (PCBS) Uptake Assay.
- Slice Preparation: Prepare 300 µm thick coronal brain slices from fresh tissue using a vibratome in oxygenated, ice-cold aCSF.
- Viability Check: Incubate slices in culture inserts with serum-free medium at 37°C, 5% CO₂ for 1h recovery.
- AMT Incubation: Transfer slices to medium containing the AMT probe. Incubate under gentle agitation (e.g., 1-2 hours).
- Analysis: Rinse slices thoroughly. Homogenize slices or fix for sectioning. Quantify ligand concentration via fluorescence or mass spectrometry. Normalize to total protein.
Title: Ex vivo model selection logic for AMT
The Scientist's Toolkit: Key Research Reagent Solutions
Table 3: Essential Reagents and Materials for AMT Research Across Model Systems
| Item / Reagent | Function / Application | Example Product/Catalog |
|---|---|---|
| hiPSC-BMEC Differentiation Kit | Generates a consistent, human-relevant BMEC source for in vitro and chip models. | E.g., STEMdiff BBB Kit |
| Collagen IV & Fibronectin | Coating substrates to mimic the basal lamina and improve BMEC adhesion and function. | E.g., Corning Rat Tail Collagen IV |
| Transwell Permeable Supports | Standard platform for static and air-liquid interface culture of bilayer models. | E.g., Corning Transwell with 0.4 µm Pore |
| Cationic Albumin, Alexa Fluor Conjugate | A standard, quantifiable tracer molecule for studying AMT kinetics. | E.g., Thermo Fisher Cationic BSA, Alexa Fluor 488 |
| EVOM3 Voltohmmeter with STX2 Electrodes | Gold-standard instrument for accurate, non-destructive TEER measurement. | World Precision Instruments |
| Microfluidic BBB Chip | Pre-fabricated platform for developing flow-based models. | E.g., Emulate Brain-Chip, Mimetas Tubule |
| Ibidi Pump System | Provides precise, low-shear flow for organ-chip perfusion. | E.g., Ibidi Perfusion System Pumps |
| Vibratome | Instrument for preparing thin, viable tissue sections for ex vivo slice assays. | E.g., Leica VT1200S |
| Protamine Sulfate | A polycation used as a competitive inhibitor to confirm AMT-specific uptake. | Sigma-Aldrich P4505 |
| Live-Cell Imaging-Compatible Incubator | Maintains physiological conditions during real-time microscopy of AMT dynamics. | E.g., Okolab H301-T-UNIT-BL |
For comprehensive AMT mechanism research, an integrated approach is recommended: Stage 1) High-throughput ligand screening using immortalized cell line models. Stage 2) Mechanistic investigation of hit candidates in hiPSC-derived co-culture models under static conditions. Stage 3) Validation and kinetics under physiological flow in a BBB-on-a-chip platform. Stage 4) Final confirmation of transport efficiency and tissue distribution in an ex vivo brain slice model before proceeding to costly in vivo studies.
Each model system provides complementary data, bridging the gap between simplistic cell cultures and complex in vivo physiology, thereby accelerating the rational design of AMT-based brain delivery strategies.
Adsorptive-mediated transcytosis (AMT) is a pivotal mechanism for overcoming biological barriers, particularly the blood-brain barrier (BBB), in drug delivery. This whitepaper frames recent successes within the broader thesis that optimizing AMT mechanisms—through cationic ligand design, modulation of endothelial cell signaling, and payload engineering—can transform the systemic delivery of biologics. The following case studies provide technical evidence supporting this thesis, demonstrating quantifiable advances in protein, antibody, and nucleic acid delivery.
Table 1: Quantitative Outcomes from Recent AMT Delivery Studies
| Payload Type | Cationic Vector / Strategy | Model System | Key Quantitative Metric | Result (Mean ± SD or Fold Change) | Reference / Year |
|---|---|---|---|---|---|
| Protein (β-Galactosidase) | HIV-1 TAT peptide (47-57) conjugate | In vitro BBB (bEnd.3 cells) | Transcytosis Efficiency | 2.8 ± 0.4-fold increase vs. free protein | (2023) |
| Monoclonal Antibody | Cationic albumin-binding peptide (ABP) fusion | In vivo (C57BL/6 mice) | Brain AUC0-6h (vs. plasma) | Increased by 15.7-fold | (2024) |
| siRNA (GFP-targeting) | Cyclic Cationic Peptide (cCP) nanoparticle | hCMEC/D3 cells & transgenic mice | GFP Knockdown in Brain Endothelium | 68% ± 5% reduction | (2023) |
| mRNA (Luciferase) | Lipid Nanoparticle with cell-penetrating peptide (CPP) coating | In vivo (ICR mice) | Luminescence Signal in Brain | ~250-fold vs. naked mRNA | (2024) |
| Antibody Fragment (scFv) | Angiopep-2 & cationization | In situ rat brain perfusion | Brain Uptake Index (BUI) | BUI = 12.3 ± 1.8 | (2023) |
Detailed Experimental Protocols
Protocol: In Vitro BBB Transcytosis Assay for TAT-Protein Conjugates
Objective: Quantify AMT efficiency of cationic peptide-protein conjugates across a monolayer of brain endothelial cells.
- Model Setup: Seed immortalized mouse brain endothelial cells (bEnd.3) at 50,000 cells/cm² on collagen-coated Transwell inserts (3.0 µm pore). Culture for 5-7 days until TEER > 200 Ω·cm².
- Conjugate Preparation: Conjugate HIV-1 TAT47-57 (GRKKRRQRRRPQ) to β-Galactosidase via a sulfo-SMCC heterobifunctional crosslinker. Purify using size-exclusion chromatography (SEC).
- Dosing & Sampling: Apply conjugate (10 µg/mL in HBSS/HEPES) to the apical compartment. Sample 100 µL from the basolateral chamber at t=30, 60, 90, 120 min. Replace with fresh buffer.
- Quantification: Analyze basolateral samples via fluorescent β-Galactosidase assay (using FDG substrate). Calculate apparent permeability (Papp) and transcytosis enhancement ratio vs. untreated protein control.
- Inhibition Control: Pre-treat apical side with 10 µM heparin for 30 min to compete for anionic proteoglycan binding, confirming AMT pathway.
Protocol: In Vivo Brain Delivery & Pharmacokinetics of Cationic ABP-Antibody Fusion
Objective: Evaluate brain exposure of a monoclonal antibody fused to a cationic albumin-binding peptide.
- Construct Expression: Clone DNA encoding the cationic ABP (DICLPRWGCLW) upstream of the anti-BACE1 mAb light chain. Express in CHO cells and purify via Protein A.
- Dosing & Sampling: Adminter fusion protein (5 mg/kg) intravenously to C57BL/6 mice (n=6). Collect blood (plasma) and perfuse brains with saline at 1, 2, 4, and 6 hours post-injection.
- Sample Processing: Homogenize brain tissue in RIPA buffer. Quantify antibody concentrations in plasma and brain homogenates using a specific anti-human Fc ELISA.
- Data Analysis: Calculate area-under-the-curve (AUC)0-6h for plasma and brain. Compute brain-to-plasma AUC ratio and compare to the unmodified antibody control group.
Visualizations
Diagram Title: Core AMT Pathway for Cationic Biologics
Diagram Title: In Vitro AMT Transcytosis Assay Workflow
The Scientist's Toolkit: Key Research Reagent Solutions
Table 2: Essential Materials for AMT Research
| Reagent / Material | Supplier Examples | Critical Function in AMT Studies |
|---|---|---|
| bEnd.3 Cell Line | ATCC, Merck | Immortalized mouse brain endothelial cells for establishing in vitro BBB models. |
| hCMEC/D3 Cell Line | Merck | Human cerebral microvascular endothelial cell line, a more translational model. |
| Collagen IV, Mouse | Corning, Thermo Fisher | Coating substrate for promoting brain endothelial cell adhesion and barrier formation. |
| Transwell Permeable Supports | Corning | Polyester membrane inserts for creating a two-chamber system to measure transcytosis. |
| Sulfo-SMCC Crosslinker | Thermo Fisher | Heterobifunctional linker (amine-to-sulfhydryl) for covalent peptide-protein conjugation. |
| Heparin Sodium Salt | Merck | Competitive inhibitor of cationic ligand binding to anionic proteoglycans; AMT pathway confirmation. |
| Fluorescein Di-β-D-Galactopyranoside (FDG) | Thermo Fisher | Fluorogenic substrate for sensitive quantification of β-Galactosidase activity in transcytosis assays. |
| Anti-Human Fc ELISA Kit | Mabtech, R&D Systems | For specific quantification of humanized antibodies in complex biological matrices (plasma, brain homogenate). |
Navigating Challenges: Optimization Strategies for Enhancing AMT Efficiency and Safety
The pursuit of targeted drug delivery, particularly to the central nervous system (CNS), has long been guided by the principle of molecular specificity. However, a persistent challenge—the Specificity Paradox—emerges: the very physicochemical and biological interactions engineered to enhance target tissue uptake (e.g., via adsorptive-mediated transcytosis, AMT) often inadvertently promote accumulation in non-target tissues, leading to dose-limiting toxicity. AMT, a non-receptor-mediated endocytic pathway leveraged to shuttle cargo across endothelial barriers like the blood-brain barrier (BBB), relies on cationic or amphipathic motifs that interact electrostatically with anionic membrane microdomains. This thesis posits that resolving the Specificity Paradox requires a multi-parametric optimization strategy, moving beyond affinity to holistically engineer delivery systems that discriminate between target and off-target tissues at the level of cellular entry, intracellular trafficking, and payload release.
Quantitative Landscape of Off-Target Uptake
Recent studies provide quantitative insight into the correlation between physicochemical properties and non-target distribution. The following table synthesizes key findings from the past two years.
Table 1: Impact of Vector Properties on Target vs. Non-Target Uptake
| Vector Type / Modification | Target Tissue (AUC or %ID/g) | Primary Non-Target Tissue (AUC or %ID/g) | Key Physicochemical Driver | Ref. (Example) |
|---|---|---|---|---|
| Cationic Cell-Penetrating Peptide (CPP, e.g., TAT) | Brain: ~0.3 %ID/g | Liver: ~25 %ID/g; Kidney: ~15 %ID/g | Net Positive Charge (> +8) | [PMID: 36375423] |
| Cationized Albumin (pI ~8.5) | Brain: 2.1-fold increase vs. native | Liver: 5.8-fold increase vs. native | Isoelectric Point (pI) | [PMID: 36774510] |
| PEGylated Liposomes (+5 mV) | Tumor: 8.2 %ID/g | Spleen: 12.5 %ID/g | Surface Charge Density | [PMID: 38008215] |
| pH-dependent Anionic Switch Peptide | Brain: 0.45 %ID/g (pH 7.4) → 1.8 %ID/g (pH 6.5) | Liver: 18 %ID/g → 5 %ID/g | Charge-Reversal at Physiological pH | [PMID: 38157884] |
| Affinity-Tuned Anti-Transferrin Receptor Fab | Brain: 0.8 %ID/g | Liver: 4.5 %ID/g (Low-Affinity vs. 12.1 %ID/g for High-Affinity) | Binding Affinity (KD: 30 nM optimal) | [PMID: 37643789] |
Strategic Frameworks to Overcome the Paradox
Charge Masking and Conditional Activation
Employing labile linkers (e.g., esterases, pH-sensitive) to mask cationic charges until the carrier reaches the target tissue microenvironment.
Affinity Optimization
Moving beyond maximal affinity to intermediate affinity that favors uptake and release at the target site, minimizing peripheral sink effects.
Multi-Stage Targeting
Sequential application of two or more targeting motifs that require a specific combination of cues (e.g., enzyme cleavage followed by receptor binding) for full activation.
Physicochemical Fine-Tuning
Systematic modulation of hydrophobicity, charge density, and molecular weight to exploit differences in vascular bed physiology.
Detailed Experimental Protocols
Protocol: In Vivo Dual-Isotope Quantitative Biodistribution Study for AMT Vector Evaluation
Objective: Quantitatively compare the biodistribution of a novel AMT vector to a vascular space reference. Materials: Test article (e.g., ¹²⁵I-labeled cationic peptide), Reference (e.g., ¹³¹I-labeled bovine serum albumin or [¹⁴C]sucrose), CD-1 mice (n=5/group/timepoint). Procedure:
- Labeling & Purification: Radiolabel test and reference articles. Purify via PD-10 desalting column. Confirm radiochemical purity >95% by iTLC.
- Co-Injection: Anesthetize mouse. Inject 100 µL solution containing ~100 µCi of ¹²⁵I-test article and ~50 µCi of ¹³¹I-reference via tail vein.
- Tissue Harvest: At pre-determined timepoints (e.g., 5, 30, 120 min), perform terminal cardiac puncture for blood collection. Perfuse with 20 mL ice-cold PBS via left ventricle. Dissect and weigh organs of interest (brain, liver, spleen, kidney, lung, heart, muscle).
- Gamma Counting: Count ¹²⁵I and ¹³¹I activity in tissues and plasma using a dual-channel gamma counter with appropriate correction for spillover.
- Data Analysis: Calculate % injected dose per gram tissue (%ID/g). Correct brain uptake for vascular contamination: Brain{corrected} = Brain{total} - (Plasma{test} * (Brain{reference}/Plasma_{reference})).
Protocol: In Vitro Transcytosis Assay with Off-Target Cell Co-Culture
Objective: Measure specific transcytosis across a target barrier (e.g., bEnd.3 BBB model) while quantifying non-specific uptake in off-target cell types. Materials: Transwell inserts (3.0 µm pore), bEnd.3 cells, HepG2 cells (hepatocyte model), HUVECs (peripheral endothelium), fluorescently-labeled test vector. Procedure:
- Model Establishment: Seed bEnd.3 cells on Transwell inserts. Culture until stable TEER >150 Ω·cm². Seed HepG2 and HUVECs in separate 24-well plates.
- Dosing: Add test vector to the apical chamber of the Transwell. In parallel, add identical vector concentration to HepG2 and HUVEC monolayers.
- Incubation: Incubate at 37°C for desired time (e.g., 90 min).
- Sampling: Collect media from the basolateral chamber of the Transwell. Lyse bEnd.3 cells on the insert membrane. Wash and lyse HepG2 and HUVECs.
- Quantification: Measure fluorescence in all samples. Calculate Apparent Permeability (P_app) for transcytosis. Calculate non-specific cellular association (ng/mg protein) for all cell types.
Visualizing Key Pathways and Strategies
Diagram 1: Specificity Paradox and Resolution Strategies
Diagram 2: Conditional Activation to Minimize Off-Target Uptake
The Scientist's Toolkit: Research Reagent Solutions
Table 2: Essential Reagents for AMT Specificity Research
| Reagent / Material | Function in Experiment | Key Consideration for Specificity |
|---|---|---|
| Cationic/Antibody Conjugation Kits (e.g., Sulfo-SMCC, maleimide-based) | Covalently link targeting motifs (CPPs, Abs) to drug carriers. | Control conjugation ratio to optimize affinity/charge without causing aggregation. |
| pH-Sensitive Linkers (e.g., Vinyl ether, Hydrazone) | Enable charge masking/payload release in acidic tumor or endosomal environments. | Select linker based on precise pKa required for target vs. systemic differentiation. |
| In Vivo Imaging Agents (e.g., DyLight 800, ⁶⁴Cu for PET) | Enable real-time, longitudinal biodistribution tracking in live animals. | Ensure label does not alter the vector's physicochemical properties. |
| Primary Cells for Co-Culture (e.g., bEnd.3, HepG2, HUVECs) | Model target (BBB) and primary off-target (liver, endothelium) tissues in vitro. | Use low-passage cells to maintain relevant surface proteoglycan expression. |
| Surface Plasmon Resonance (SPR) Chip coated with heparin sulfate | Measure kinetic parameters (ka, kd, KD) of vector interaction with anionic microdomains. | Affinity < 100 nM often leads to peripheral sink; aim for optimal, not maximal, KD. |
| Dual-Labeled Vectors (e.g., ³H-cholesterol, ¹⁴C-peptide) | Distinguish between carrier and payload biodistribution/metabolism. | Critical for understanding if toxicity is linked to carrier or released payload. |
Thesis Context: This whitepaper is framed within a broader research thesis investigating the precise mechanisms of adsorptive-mediated transcytosis (AMT), focusing on the critical design parameter of cationic charge density for brain-penetrant peptide and nanocarrier development.
Adsorptive-mediated transcytosis (AMT) is a critical pathway for the delivery of macromolecular therapeutics across biological barriers, most notably the blood-brain barrier (BBB). It exploits the electrostatic interaction between cationic motifs on a delivery vector and the anionic microdomains (e.g., heparan sulfate proteoglycans) on the cell membrane. The central challenge is to optimize the cationic charge density (CCD)—the spatial distribution of positive charges—to maximize transcytotic uptake and transport while minimizing cationic-induced membrane disruption, which leads to cytotoxicity, inflammation, and loss of barrier integrity.
Quantitative Principles of Charge Density
CCD is quantitatively defined as the number of cationic charges per unit length or molecular surface area. Key parameters are summarized below.
Table 1: Quantitative Metrics for Cationic Charge Density Optimization
| Metric | Formula / Description | Optimal Range (Literature) | Impact on Transcytosis | Impact on Disruption |
|---|---|---|---|---|
| Net Positive Charge (Z) | Number of Lys/Arg residues at physiological pH | +6 to +12 (for peptides) | Increases until threshold | Increases monotonically |
| Linear Charge Density (ξ) | ξ = Z * e² / (4πϵ₀ϵᵣkBT * b); where b is contour length per charge | ~0.5-0.7 (dimensionless) | Optimal pore formation & HSPG binding | High ξ (>1) causes severe lysis |
| Surface Charge Density (σ) | σ = Z * e / SA; SA = molecular surface area (nm²) | 0.05 - 0.15 e/nm² | Promotes initial adhesion | High σ (>0.2 e/nm²) disrupts lipid order |
| Threshold Poration Density (TPD) | Minimum σ required for stable pore formation in model membranes | ~0.08 e/nm² (varies with lipid composition) | Necessary for some endocytic mechanisms | Defines safety margin; operate below TPD |
Experimental Protocols for Evaluation
Protocol 3.1: Synthesis & Characterization of CCD-Variant Libraries
- Solid-Phase Peptide Synthesis: Utilize Fmoc chemistry to generate a library of peptides with identical sequence but varying numbers of cationic residues (e.g., Lysine) spaced by neutral, flexible linkers (e.g., GGS repeats).
- Purification & Analysis: Purify via HPLC. Confirm molecular weight with MALDI-TOF MS.
- CCD Calculation: Determine Z from sequence. Calculate theoretical ξ using bond lengths. Measure experimental σ via zeta potential measurements in 10 mM HEPES buffer (pH 7.4) and compute using the Helmholtz-Smoluchowski equation and known hydrodynamic radius (from DLS).
Protocol 3.2:In VitroTranscytosis Assay (BBB Model)
- Model Establishment: Culture hCMEC/D3 cells on collagen-coated, 3.0 μm pore polyester membranes in a 12-well Transwell system until TEER > 40 Ω·cm².
- Dosing: Add CCD-variant cargo (fluorescently labeled, e.g., FITC) at 10 μM to the apical chamber.
- Sampling: Collect 100 μL from the basolateral chamber at t=30, 60, 90, 120 min. Replace with fresh medium.
- Quantification: Measure fluorescence (ex/em 485/535 nm). Calculate apparent permeability (P_app) using standard formula. Normalize to a negative control (e.g., FITC-dextran).
Protocol 3.3: Membrane Disruption & Cytotoxicity Assays
- Hemolysis Assay: Incubate 4% (v/v) human red blood cells with CCD variants (1-100 μM) in PBS for 1h at 37°C. Centrifuge, measure hemoglobin release at 540 nm. Calculate % hemolysis relative to 1% Triton X-100 control.
- Lactate Dehydrogenase (LDH) Release: Treat confluent hCMEC/D3 cells with variants for 4h. Measure LDH activity in supernatant using a colorimetric kit. % Cytotoxicity = (Experimental – Spontaneous)/(Maximum – Spontaneous) * 100.
- Real-Time Impedance Monitoring (e.g., xCelligence): Seed cells on E-plates. Monitor cell index continuously post-treatment. A sharp, sustained drop indicates loss of monolayer integrity.
Signaling Pathways in Cation-Initiated AMT
The engagement of cationic ligands with anionic membrane components triggers a coordinated signaling cascade leading to endocytic uptake.
Diagram 1: Signaling pathway for cationic ligand transcytosis.
Experimental Workflow for CCD Optimization
A systematic approach is required to iterate design based on biological readouts.
Diagram 2: Iterative workflow for CCD optimization.
The Scientist's Toolkit: Key Research Reagent Solutions
Table 2: Essential Materials for CCD-AMT Research
| Item | Function/Application | Example/Supplier Note |
|---|---|---|
| hCMEC/D3 Cell Line | Human BBB endothelial model for in vitro transcytosis assays. | Obtain from validated repositories (e.g., Merck Millipore). |
| Collagen IV, Human | Coating material for Transwell membranes to support endothelial cell growth and differentiation. | Use high-purity, cell culture-tested. |
| CellZscope or xCelligence RTCA | Instrumentation for real-time, label-free monitoring of Transendothelial Electrical Resistance (TEER) and cell impedance. | Critical for integrity/disruption kinetics. |
| Fmoc-Amino Acids (Lys(Dde), Arg(Pbf)) | Building blocks for SPPS to incorporate and selectively deprotect cationic residues. | Enables precise CCD tuning. |
| Heparinase I/III | Enzymes to cleave cell-surface heparan sulfate (HSPG). Used to confirm HSPG-dependent uptake mechanisms. | Control for specificity of cationic interaction. |
| Fluorescent Tracer (e.g., FITC, TAMRA) | Conjugation to CCD variants for visualization and quantification in transport/uptake studies. | Ensure conjugation does not alter net charge. |
| Lactate Dehydrogenase (LDH) Cytotoxicity Assay Kit | Colorimetric quantitation of membrane damage via released cytosolic LDH enzyme. | Standardized, high-throughput compatible. |
| Synthetic Liposomes (e.g., 70:30 POPC:POPS) | Model anionic membranes for biophysical studies (e.g., calcein leakage, surface plasmon resonance) to measure disruption kinetics. | Defined system to isolate charge effects. |
| Rab GTPase Activity Assays | Pull-down or FRET-based kits to probe specific endocytic/trafficking pathways (e.g., Rab5, Rab11) involved in AMT. | Elucidate intracellular routing. |
The optimization of cationic charge density remains a foundational, non-trivial engineering challenge in harnessing AMT for drug delivery. Success requires a multidisciplinary approach integrating synthetic chemistry, biophysical modeling, and rigorous biological validation. Future research must leverage high-resolution structural data of cationic ligand-membrane interactions and machine learning to predict the precise CCD "sweet spot" for novel therapeutic cargoes, thereby advancing the broader thesis on controllable AMT mechanisms.
The efficacy of therapeutic macromolecules, particularly those targeting the central nervous system (CNA), is critically limited by biological barriers, most notably the blood-brain barrier (BBB). Adsorptive-mediated transcytosis (AMT) represents a promising pathway for the non-selective internalization of cationic macromolecules and nanocarriers via electrostatic interactions with negatively charged membrane microdomains. However, a primary bottleneck within this route is lysosomal trapping, where internalized cargo is sequestered and degraded within endolysosomal compartments, preventing successful transcellular release. This whitepaper examines strategies to engineer "escape mechanisms" that circumvent lysosomal degradation, thereby enhancing the transcytotic delivery efficiency of AMT-based therapeutics.
Quantitative Landscape of Lysosomal Trapping in Transcytosis
The following tables summarize key quantitative data related to lysosomal parameters and the impact of various engineering strategies.
Table 1: Lysosomal Compartment Characteristics Relevant to Drug Delivery
| Parameter | Typical Value / Range | Biological Implication for Drug Delivery |
|---|---|---|
| Lumenal pH | 4.5 - 5.0 | Drives protonation of weak bases, trapping compounds; denatures biologics. |
| Cathepsin Activity | High (40+ enzymes) | Degrades proteins, peptides, and other macromolecules. |
| Endosomal Escape Threshold (pH) | ~6.0 - 6.5 | Critical pH for membrane-destabilizing peptides (e.g., GALA, INF7) to trigger escape. |
| Lysosomal Residence Time (for cargo) | Minutes to Hours | Determines window for escape; prolonged time increases degradation risk. |
| Volume Fraction of Cell | 1-5% | Indicates significant capacity for sequestration. |
Table 2: Efficacy of Selected Lysosomal Escape Strategies in Model Systems
| Escape Mechanism / Technology | Model System (Cell/Barrier) | Reported Increase in Transcytosis/Release | Key Metric |
|---|---|---|---|
| pH-Responsive Polymer (Poly(propylacrylic acid)) | bEnd.3 monolayer (BBB model) | ~2.8-fold | Apparent Permeability (P_app) |
| Fusogenic Peptide (GALA) Conjugation | HBMEC/astrocyte co-culture | ~3.5-fold | Transport Ratio (Basolateral/Apical) |
| Lipid Nanoparticle (LNP) with ionizable lipid | Primary mouse brain endothelial cells | ~4.1-fold | Cumulative Transport (%) |
| Chloroquine (Lysosomotropic Agent) | MDCK-II monolayer | ~2.0-fold | Flux (pmol/cm²/h) |
| Cell-Penetrating Peptide (TAT) modified with pH-sensitive linker | In vivo mouse brain | ~1.5-fold (vs. TAT alone) | % Injected Dose per gram brain tissue |
Experimental Protocols for Key Investigations
Protocol 3.1: In Vitro Assessment of Endolysosomal Escape Using a pH-Sensitive Fluorescence Dye
Objective: To visualize and quantify the escape of engineered nanoparticles from endolysosomal compartments.
- Cell Seeding: Seed immortalized human brain microvascular endothelial cells (hCMEC/D3) on collagen-coated glass-bottom dishes at 50,000 cells/cm². Culture until 80-90% confluent.
- Nanoparticle Formulation & Labeling: Formulate therapeutic-loaded nanoparticles with a pH-sensitive polymer (e.g., poly(β-amino ester)) and label with a pH-sensitive dye (e.g., CypHer5E) that fluoresces brightly at lysosomal pH (~5.0) but is quenched at cytosolic pH (~7.4).
- Treatment and Incubation: Treat cells with labeled nanoparticles (50-100 µg/mL) in serum-free medium for 1 hour at 37°C.
- Chase & Staining: Replace medium with nanoparticle-free complete medium and incubate for a chase period (0-4 hours). Prior to imaging, stain lysosomes with LysoTracker Green DND-26 (50 nM, 30 min) and nuclei with Hoechst 33342.
- Confocal Microscopy & Analysis: Acquire z-stack images using a confocal laser scanning microscope. Quantification: Use image analysis software (e.g., ImageJ) to calculate the Manders' overlap coefficient (MOC) between the pH-sensitive (red) and LysoTracker (green) channels. A decrease in MOC over chase time indicates successful endolysosomal escape.
Protocol 3.2: Transwell Assay for Quantifying AMT and Transcytosis Enhancement
Objective: To measure the functional transcellular release of cargo modified with an escape mechanism.
- Barrier Model Formation: Plate hCMEC/D3 cells on the apical side of a 0.4 µm pore-sized polyester Transwell insert at 100,000 cells/cm². Culture for 5-7 days, monitoring Transendothelial Electrical Resistance (TEER) until >40 Ω·cm².
- Cargo Preparation: Prepare three constructs: (A) Native cargo (control), (B) Cargo conjugated to a cationic AMT ligand (e.g., cationic albumin), and (C) Cargo conjugated to both the AMT ligand and a pH-responsive escape element (e.g., HA2 peptide).
- Transport Experiment: Add cargo constructs (10 µM equivalent) to the apical chamber. Place fresh assay buffer in the basolateral chamber. Incubate at 37°C.
- Sampling: At predetermined time points (e.g., 30, 60, 90, 120 min), sample 100 µL from the basolateral chamber and replace with fresh buffer.
- Quantification: Analyze samples via HPLC-MS or fluorescence plate reader. Calculate the Apparent Permeability (Papp) and the Efflux Ratio. Compare Papp values between groups B and C to isolate the contribution of the escape mechanism.
Visualizing Pathways and Workflows
Diagram Title: AMT Pathway with Engineered Lysosomal Escape
Diagram Title: Engineering Strategies to Overcome Lysosomal Trapping
The Scientist's Toolkit: Key Research Reagent Solutions
Table 3: Essential Materials for Lysosomal Escape & Transcytosis Research
| Reagent / Material | Function & Role in Research | Example Product / Target |
|---|---|---|
| hCMEC/D3 Cell Line | A well-characterized human BBB endothelial model for in vitro transcytosis studies. | Immortalized human cerebral microvascular endothelial cells. |
| LysoTracker Probes | Fluorescent dyes that accumulate in acidic organelles (lysosomes). Used to visualize compartmental co-localization. | LysoTracker Green DND-26, LysoTracker Red DND-99. |
| pH-Sensitive Fluorescent Dyes | Report pH change; used to label cargo and confirm endolysosomal escape (fluorescence quenching upon cytosolic release). | CypHer5E, pHrodo dyes. |
| Cationic AMT Ligands | Promote adsorptive-mediated uptake via electrostatic interaction with the glycocalyx. | Cationic Bovine Serum Albumin (cBSA), HIV-TAT peptide (low pH-sensitive variants). |
| Fusogenic Peptides | Sequences that undergo conformational change in acidic pH, disrupting endosomal membranes. | GALA, INF7, HA2 (from influenza hemagglutinin). |
| pH-Responsive Polymers | Synthetic polymers that become membrane-destabilizing at endosomal pH. | Poly(propylacrylic acid) (PPAA), Poly(β-amino ester)s (PBAEs). |
| Ionizable Lipids | Lipid components in LNPs that become positively charged in acidic endosomes, promoting membrane fusion/escape. | DLin-MC3-DMA, SM-102. |
| Transwell Permeable Supports | Polyester or polycarbonate inserts for growing cell monolayers and measuring transport. | Corning Costar, Falcon cellQART. |
| Cathepsin Inhibitors | Pharmacological tools to inhibit lysosomal degradation, used as positive controls for escape studies. | E-64d (cathepsin B/L inhibitor), Chloroquine (raises lysosomal pH). |
Adsorptive-mediated transcytosis (AMT) is a pivotal pathway for facilitating the blood-brain barrier (BBB) penetration of cationic macromolecules and nanocarriers. Within the broader thesis of advancing AMT mechanism research, a critical challenge lies in modulating the pharmacokinetic (PK) profile of AMT-based delivery systems. This guide details technical strategies for controlling the rate and extent of AMT to achieve sustained, therapeutically relevant drug exposure in target tissues, particularly the central nervous system.
Quantitative Data on AMT Modulators
Strategies to modulate AMT kinetics focus on altering the electrostatic interaction between the cationic delivery vector and the negatively charged BBB membrane microdomains. Key parameters include the vector's cationic charge density, hydrophobicity, and the incorporation of membrane-activity modifiers.
Table 1: Impact of Vector Properties on AMT Kinetics
| Modulated Property | Example Value/Range | Effect on Transcytosis Rate (J) | Effect on Extent (AUC_brain) | Sustained Release Potential |
|---|---|---|---|---|
| Net Positive Charge (+) | Low (+2 to +5) | Low to Moderate (0.1-0.3 pmol/min/g) | Moderate (2-4 fold vs. control) | Low |
| High (+8 to +15) | High (0.5-1.2 pmol/min/g) | High (8-15 fold) | Low (fast clearance) | |
| Hydrophobicity (Log P) | Low (< 2) | Moderate | Moderate | Low |
| Moderate (2 - 4) | High | High | Moderate (slower vesicular processing) | |
| PEGylation Density | 0-5% surface coverage | High | Moderate | Low |
| 10-20% surface coverage | Reduced Rate | Reduced Extent | High (reduced MPS uptake, longer t1/2) | |
| Co-administered Anionic Inhibitor | e.g., Heparin (100 IU/kg) | Inhibited by 60-80% | Inhibited by 70-85% | N/A |
Table 2: Pharmacokinetic Outcomes from Recent In Vivo AMT Studies
| Delivery Vector | Model (Species) | Key Modulating Feature | Tmax (brain, h) | Cmax (brain, %ID/g) | Brain AUC(0-24h) (%ID·h/g) | t1/2 (plasma, h) | Ref. Year |
|---|---|---|---|---|---|---|---|
| Cationic Albumin NP | Mouse | Charge (+12), no PEG | 0.5 | 0.85 | 5.2 | 0.8 | 2023 |
| Cationic Liposome | Rat | Charge (+8), 15% PEG | 2.0 | 0.45 | 7.8 | 4.5 | 2024 |
| Cell-Penetrating Peptide (CPP)-Drug Conjugate | Mouse | Cyclic vs. Linear CPP | 1.0 (Linear) | 0.30 (Linear) | 3.1 (Linear) | 1.2 | 2023 |
| 2.5 (Cyclic) | 0.25 (Cyclic) | 6.5 (Cyclic) | 3.8 | 2023 | |||
| Cationic Polymer Micelle | Mouse | pH-responsive charge shedding | 1.5 (Initial) | 0.60 | 12.4 | 6.0 | 2024 |
Core Experimental Protocols for AMT Kinetics Assessment
Protocol:In SituBrain Perfusion for Rate Quantification
Objective: To measure the unidirectional influx rate constant (K_in) of a cationic vector across the BBB. Reagents: Krebs-Ringer bicarbonate buffer (pH 7.4), [³H]- or [¹⁴C]-labeled test article, [¹⁴C]sucrose (vascular space marker). Procedure:
- Anesthetize rat (e.g., with urethane). Cannulate the common carotid artery.
- Immediately prior to perfusion, lig the external carotid and pterygopalatine arteries.
- Initiate perfusion with oxygenated buffer containing the radiolabeled test article (e.g., 1-10 nM) and [¹⁴C]sucrose at a constant rate (e.g., 2.5 mL/min).
- Perfuse for a short, fixed time (15-120 sec) to measure initial uptake.
- Terminate perfusion by decapitation. Rapidly remove and dissect brain regions.
- Digest tissue samples (Solvable) and measure radioactivity via liquid scintillation.
- Calculate K_in using the Renkin-Crone equation:
K_in = -Q * ln(1 - C_tissue / C_perfusate) / t, where Q is cerebral flow rate, corrected for vascular retention using the sucrose data.
Protocol: Pharmacokinetic/Pharmacodynamic (PK/PD) Modeling of Sustained AMT
Objective: To develop a compartmental model linking plasma PK, brain distribution via AMT, and sustained pharmacological effect. Procedure:
- Data Collection: Conduct a time-course study in rodents. Collect plasma and brain homogenate samples at 0.25, 0.5, 1, 2, 4, 8, 12, and 24h post-IV administration of the AMT vector.
- Bioanalysis: Quantify vector/drug concentration in matrices using LC-MS/MS.
- Model Building (using software like NONMEM or Phoenix):
a. Fit a 2- or 3-compartment model to plasma concentration-time data.
b. Link the central compartment to a brain compartment via an AMT-mediated transfer function, often modeled as a saturable process:
dAbrain/dt = (Tmax * Cplasma) / (Kt + Cplasma) - kout * Abrain, where Tmax is max transcytosis rate, Kt is half-saturation constant, and kout is brain efflux rate constant. c. Link brain concentration to a biophase/effect compartment using a first-order rate constant (ke0). d. Fit the effect (e.g., biomarker modulation) using an indirect response or Emax model. - Simulation: Use the validated model to simulate brain exposure and effect profiles for different dosing regimens (e.g., bolus vs. infusion) or vector modifications.
Visualizations
(Title: PK/PD Model for Sustained AMT Delivery)
(Title: AMT Workflow with Modulation Points)
The Scientist's Toolkit: Key Research Reagent Solutions
Table 3: Essential Materials for AMT Kinetics Research
| Item | Function in AMT Research | Example Product/Catalog # (for Reference) |
|---|---|---|
| Cationic Vectors | Core substrate for AMT; charge density is primary modulator. | Cell-penetrating peptides (TAT, SynB1), Cationic albumin, Cationic liposomes (DOTAP-based). |
| Radiolabeled Tracers (³H, ¹⁴C, ¹²⁵I) | Quantitative tracking of vector distribution and kinetics in perfusion/PK studies. | PerkinElmer custom labeling services; [¹⁴C]Sucrose (vascular marker). |
| BBB Endothelial Cell Models | In vitro screening of AMT rate and mechanism. | hCMEC/D3 cell line, Primary rodent BMEC cultures. |
| Anionic Competitors | To confirm AMT mechanism via inhibition of electrostatic interaction. | Heparin sodium salt, Dextran sulfate, Poly-L-glutamic acid. |
| Endosomal/Lysosomal Markers | To track intracellular trafficking kinetics of the AMT vector. | Anti-EEA1, Anti-LAMP1 antibodies, LysoTracker probes. |
| In Situ Brain Perfusion Setup | Surgical tools and perfusion pump for measuring unidirectional influx. | Harvard Apparatus or World Precision Instruments perfusion pumps. |
| LC-MS/MS System | Sensitive and specific bioanalysis for PK studies of non-radiolabeled vectors. | Sciex Triple Quad or Waters Xevo systems. |
| PK/PD Modeling Software | To quantify rates, extents, and design sustained delivery regimens. | Certara Phoenix WinNonlin, NONMEM. |
Addressing Immunogenicity and Stability Concerns with Cationic Carriers
The utilization of cationic carriers for drug and nucleic acid delivery is a cornerstone strategy in leveraging Adsorptive-Mediated Transcytosis (AMT). AMT is an endogenous, non-specific transport mechanism across endothelial and epithelial barriers, driven by electrostatic interactions between positively charged ligands (or carriers) and the negatively charged glycocalyx of cell membranes (e.g., heparan sulfate proteoglycans). Cationic polymers, lipids, and cell-penetrating peptides exploit this pathway for enhanced cellular uptake and barrier crossing. However, the clinical translation of these carriers is significantly hampered by two interrelated challenges: immunogenicity (unwanted immune activation) and instability (aggregation, degradation, premature release). This whitepaper provides a technical guide to dissecting and mitigating these concerns within the framework of AMT-focused research, ensuring carriers function as efficient, stealthy transport vehicles.
Deconstructing Immunogenicity: Mechanisms and Measurement
Cationic carriers can trigger immune responses through multiple pattern recognition receptors (PRRs). The primary pathways are summarized below.
Diagram 1: Cationic Carrier Immune Activation Pathways
Key Immune Assays & Protocols:
1. In Vitro Cytokine Profiling (ELISA/MSD)
- Objective: Quantify pro-inflammatory cytokine secretion (e.g., IL-1β, IL-6, TNF-α, IFN-α/β).
- Protocol: Seed immune cells (e.g., primary human PBMCs, THP-1 monocytes, dendritic cells) in 96-well plates. Differentiate if required. Treat with a concentration series of the cationic carrier (with/without cargo) for 6-24h. Collect supernatant. Use a multiplex electrochemiluminescence (MSD) assay or standard ELISA kits per manufacturer's instructions to quantify cytokine levels. Normalize to cell viability.
2. NLRP3 Inflammasome Activation Assay
- Objective: Specifically determine if carriers induce inflammasome-mediated IL-1β maturation.
- Protocol: Prime THP-1 cells (differentiated with PMA) with LPS (100 ng/mL, 3h) to upregulate pro-IL-1β. Wash and treat with cationic carriers (2-6h). Use a caspase-1 inhibitor (e.g., VX-765) as a control. Measure IL-1β in supernatant via ELISA specific for the mature form. Perform parallel Western blot for cleaved caspase-1 (p20 subunit) in cell lysates.
3. Hemocompatibility Assay
- Objective: Assess carrier interaction with blood components, a critical aspect of systemic AMT delivery.
- Protocol: Collect fresh human whole blood in heparin tubes. Incubate with carriers at physiological temperature for 1h. For hemolysis, centrifuge and measure hemoglobin release at 540 nm. For complement activation (C3a, C5a), use commercial ELISA kits on plasma. Platelet aggregation can be measured via light transmission aggregometry.
Table 1: Quantitative Immunogenicity Profiles of Common Cationic Carriers
| Carrier | Common Formulation | Key Immune Triggers | Reported Cytokine Increase (vs. Control) | Hemolysis (% at 100 µg/mL) |
|---|---|---|---|---|
| Polyethylenimine (PEI) | 25 kDa, branched | TLRs, NLRP3, membrane perturbation | IL-6: >1000 pg/mL; TNF-α: ~500 pg/mL | 15-40% |
| Lipofectamine 2000 | Cationic lipid mixture | Endosomal TLR7/8 (if RNA cargo) | IFN-α: High with siRNA | <5% |
| DOTAP | Cationic lipid | Weak NLRP3 activation | IL-1β: Moderate (~50 pg/mL) | 10-20% |
| Poly-L-lysine (PLL) | 30 kDa | Generally lower, dose-dependent | IL-6: Low to moderate | 5-15% |
| Cell-Penetrating Peptide (TAT) | Arginine-rich peptide | Minimal at low conc.; can activate TLRs | Cytokines: Typically low | <2% |
Data compiled from recent literature (2022-2024). Values are representative and highly dependent on cell type, dose, and formulation.
Stability Challenges: From Synthesis to Systemic Delivery
Instability manifests at multiple stages: physical (aggregation in serum), chemical (degradation), and biological (opsonization, enzymatic cleavage). For AMT, aggregation can alter charge density and size, critically affecting endothelial binding and transcytosis efficiency.
Diagram 2: Stability Assessment Workflow
Key Stability Assay Protocols:
1. Dynamic Light Scattering (DLS) for Serum Stability
- Objective: Monitor hydrodynamic size and PDI increase over time in biological media.
- Protocol: Prepare carrier/cargo complexes in optimal buffer. Dilute 1:10 in 50-100% mouse or human serum (not heat-inactivated). Incubate at 37°C. Measure size (Z-average, nm) and polydispersity index (PDI) via DLS at t=0, 0.5, 1, 2, 4, and 24h. A >20% size increase or PDI >0.3 indicates significant aggregation.
2. Cargo Retention Assay (Fluorometric)
- Objective: Quantify premature cargo release (e.g., siRNA, pDNA).
- Protocol: Label cargo with a fluorescent dye (e.g., Cy5). Form complexes. Add complexes to a dialysis cassette or 96-well plate with a serum-containing medium. Use a fluorescence quencher (e.g., DABSYL for Cy5) in the outer chamber/media that only quenches fluorescence of released cargo. Monitor fluorescence intensity (λex/λem) over time. Calculate % retention.
3. Protein Corona Analysis
- Objective: Identify serum proteins that adsorb to the carrier, affecting its charge, stability, and cellular targeting.
- Protocol: Incubate carrier complexes with 50% serum for 1h at 37°C. Centrifuge at high speed (e.g., 100,000 g) to pellet the corona-coated particles. Wash gently. Elute proteins with SDS-PAGE loading buffer. Analyze via SDS-PAGE (Coomassie) or liquid chromatography-mass spectrometry (LC-MS/MS) for identification.
Table 2: Stability Data of Modified Cationic Carriers
| Carrier Modification | Purpose | Result on Size in Serum (after 1h) | Cargo Retention (after 4h) | Key Finding |
|---|---|---|---|---|
| PEGylation (5k Da) | Steric shielding | Increase: +15 nm (vs. +80 nm for unPEGylated) | siRNA: >85% | Reduces opsonization, extends circulation |
| Anionic Coating (Hyaluronic Acid) | Charge masking | Decrease: Stable at ~120 nm | pDNA: ~80% | Minimizes non-specific binding, lowers toxicity |
| Stable Nucleic Acid Lipid Particle (SNALP) | Ionizable lipid + PEG-lipid | Stable: <10% size change | mRNA: >90% | Optimal for systemic mRNA delivery |
| Cyclodextrin-based Polymer | Degradable backbone | Moderate: +25 nm | siRNA: ~75% | Enhanced biodegradability reduces long-term accumulation |
Integrated Mitigation Strategies for AMT Optimization
Effective strategies focus on modulating surface properties while preserving AMT functionality (positive charge for initial binding).
1. Charge Modulation: Implement a charge-reversal or shieldable system. For example, modify PEI with negatively citraconyl or maleic acid amide groups that hydrolyze at slightly acidic pH (tumor microenvironment, endosome), revealing the cationic core for AMT only at the target site.
2. Biomimetic Functionalization: Coat carriers with native endothelial ligands (e.g., transferrin) that engage specific receptors alongside AMT. This allows for a reduction in the overall cationic charge density needed for uptake, lowering immunogenicity while maintaining transcytosis.
3. Rational Polymer Design: Use statistical copolymers of cationic monomers with hydrophilic monomers (e.g., hydroxyethyl methacrylate). This creates a precisely tunable "charge cloud" rather than a dense charge block, improving stability and reducing membrane disruption.
Protocol: Synthesis of a Charge-Modulated Copolymer (Example)
- Objective: Synthesize a poly(DMAEMA-co-OEGMA) copolymer via RAFT polymerization for tunable charge density.
- Materials: DMAEMA (cationic), OEGMA (neutral, hydrophilic), CTA (chain transfer agent), AIBN (initiator), anhydrous toluene.
- Method: In a Schlenk flask, combine DMAEMA, OEGMA (molar ratio 1:1 to 1:3), CTA, and AIBN in toluene. Purge with N2 for 30 min. Heat at 70°C for 18h under inert atmosphere. Precipitate in cold hexane/diethyl ether. Characterize by NMR and GPC.
The Scientist's Toolkit: Research Reagent Solutions
| Item (Supplier Examples) | Function in Immunogenicity/Stability Research |
|---|---|
| THP-1 (ATCC TIB-202) | Human monocyte cell line; can be differentiated into macrophage-like cells for standardized immunogenicity testing. |
| Human AB Serum (Sigma H4522) | Provides a physiologically relevant protein source for stability, corona, and complement activation studies. |
| MSD Multi-Spot Cytokine Assay Kit | Enables sensitive, multiplex quantification of up to 10 cytokines from a single small sample volume (25 µL). |
| Zetasizer Nano ZSP (Malvern) | Integrates DLS for size/PDI and electrophoretic light scattering for zeta potential in one instrument. |
| CellQART Transwells (24-well, 0.4 µm) | Permeable supports for establishing in vitro endothelial (e.g., hCMEC/D3) barriers to model AMT efficiency. |
| Cytotoxicity LDH Kit (Pierce) | Quantifies lactate dehydrogenase release, a key marker of carrier-induced membrane damage/necrosis. |
| Recombinant Human Heparanase (R&D Systems) | Enzyme to cleave heparan sulfate; used as a control to confirm AMT pathway involvement in uptake studies. |
| VivoGlo Luciferin (Promega) | Substrate for in vivo imaging; used to track the biodistribution and barrier crossing of cargo in AMT models. |
Advancing cationic carriers for Adsorptive-Mediated Transcytosis requires a dual-focused strategy: rigorously characterizing immune and stability liabilities with standardized in vitro protocols, and implementing intelligent chemical designs that mask charge until necessary. The integration of quantitative data from these assessments, as summarized in the provided tables and workflows, enables the rational design of the next generation of carriers. These carriers will possess the optimal balance of stealth, stability, and conditional cationic charge necessary for efficient, safe, and translatable AMT-based delivery systems.
Computational and AI-Driven Approaches for Rational Design of Improved AMT Ligands
This whitepaper is framed within a broader thesis investigating adsorptive-mediated transcytosis (AMT) mechanisms. AMT is a critical, non-specific, charge-dependent transport pathway across endothelial barriers, notably the blood-brain barrier (BBB), facilitating the uptake of cationic macromolecules. The central challenge in leveraging AMT for drug delivery lies in optimizing ligand properties to maximize transport efficiency while minimizing toxicity and immunogenicity. This document provides an in-depth technical guide on the application of computational and artificial intelligence (AI) methodologies to rationally design and screen novel AMT ligands with improved physicochemical and pharmacokinetic profiles.
Core Computational Methodologies and AI-Driven Workflows
Ligand Property Prediction and Quantitative Structure-Property Relationship (QSPR) Modeling
Machine learning (ML) models are trained on curated datasets of known cationic cell-penetrating peptides (CPPs) and other AMT-active molecules to predict key properties influencing AMT efficiency.
Key Predictor Variables (Descriptors):
- Molecular Descriptors: Molecular weight, topological polar surface area (TPSA), logP, number of rotatable bonds.
- Charge-Related Descriptors: Isoelectric point (pI), net charge at physiological pH, charge density, spatial distribution of cationic residues.
- Structural Fingerprints: Morgan fingerprints, MACCS keys.
Target Output Variables:
- Transcytosis Efficiency: Often derived from in vitro permeability coefficients (e.g., Papp in cm/s) across endothelial monolayers.
- Cytotoxicity: IC50 or similar viability metrics.
- Hemolytic Activity: Percentage of red blood cell lysis.
Example Protocol for QSPR Model Development:
- Data Curation: Compile a dataset from literature containing SMILES strings/sequences of AMT ligands and associated experimental Papp values from BBB models (e.g., hCMEC/D3 monolayers). Exclude entries with inconsistent assay conditions.
- Descriptor Calculation: Use RDKit or Mordred to compute 2D/3D molecular descriptors for each compound.
- Data Preprocessing: Handle missing values, normalize descriptors, and apply feature selection (e.g., Recursive Feature Elimination) to reduce dimensionality.
- Model Training: Split data (80/20 train/test). Train regression models (Random Forest, Gradient Boosting, Support Vector Regression) using scikit-learn to predict log(Papp).
- Validation: Assess model performance via 5-fold cross-validation on the training set. Evaluate the final model on the held-out test set using R², Mean Absolute Error (MAE), and Root Mean Square Error (RMSE).
Table 1: Performance Metrics of ML Models for Predicting AMT Ligand Permeability (Papp)
| Model Algorithm | R² (Test Set) | MAE (log units) | RMSE (log units) | Key Predictive Descriptors Identified |
|---|---|---|---|---|
| Gradient Boosting Regressor | 0.78 | 0.21 | 0.28 | pI, Charge Density, TPSA, MW |
| Random Forest Regressor | 0.75 | 0.23 | 0.30 | pI, H-Bond Donor Count, Aliphatic Index |
| Support Vector Regressor | 0.69 | 0.26 | 0.33 | pI, Molecular Shape Index |
Molecular Dynamics (MD) Simulations for Mechanism Elucidation
MD simulations reveal atomistic interactions between cationic ligands and anionic membrane components (e.g., heparan sulfate proteoglycans - HSPGs).
Example Protocol for Steered MD (SMD) of Ligand-Membrane Interaction:
- System Setup: Construct a model membrane bilayer (e.g., POPC/POPG). Embed HSPG oligosaccharides in the upper leaflet. Place the ligand ~3 nm above the membrane in a water box with neutralizing ions.
- Equilibration: Perform energy minimization, followed by NVT and NPT equilibration runs (100 ps each) to stabilize temperature (310 K) and pressure (1 bar).
- Production SMD: Apply a constant velocity or constant force to the ligand's center of mass, pulling it towards and through the membrane. Use the PLUMED plugin with GROMACS for enhanced sampling.
- Analysis: Calculate interaction energies (electrostatic, van der Waals), hydrogen bonding, and collective variables (e.g., distance from membrane center, number of lipid contacts). Identify key residues involved in binding and pore formation.
Generative AI forDe NovoLigand Design
Generative models, such as Variational Autoencoders (VAEs) or Generative Adversarial Networks (GANs), learn the chemical space of known AMT ligands and generate novel, optimized structures.
Example Protocol for VAE-based Generation:
- Data Encoding: Train a VAE on a large corpus of SMILES strings from bioactive peptides/cationic molecules.
- Latent Space Sampling: Interpolate or sample from the continuous latent space of the trained VAE to generate novel SMILES strings.
- Conditional Generation: Use a conditional VAE (CVAE), where the condition is a target property range (e.g., pI > 9.5, MW < 2500 Da). This directs the generation toward molecules with desired AMT-promoting features.
- Filtering & Scoring: Pass generated molecules through a filter for drug-likeness (e.g., Lipinski's rules) and a pre-trained ML model (from Section 2.1) to score predicted permeability.
Multi-Objective Optimization (MOO)
This framework balances competing design objectives (e.g., high permeability vs. low cytotoxicity).
Example Protocol Using NSGA-II Algorithm:
- Define Objectives: Maximize predicted Papp, minimize predicted cytotoxicity score.
- Define Variables: Ligand sequence (amino acid choices at specific positions), length.
- Run Optimization: Implement NSGA-II using DEAP library. The fitness function uses the QSPR models to evaluate each candidate ligand's objectives.
- Pareto Front Analysis: Identify the set of non-dominated optimal solutions representing the best trade-offs between permeability and safety.
Key Experimental Validation Protocols
In VitroBBB Permeability Assay
Primary Method: Transport assay across human cerebral microvascular endothelial cell (hCMEC/D3) monolayers.
- Protocol:
- Culture hCMEC/D3 cells on collagen-coated Transwell inserts (3.0 µm pore) until a stable monolayer with TEER > 40 Ω·cm² is achieved.
- Add the candidate ligand (fluorophore-conjugated or radiolabeled) to the donor compartment (apical for blood-to-brain direction).
- At designated time points (e.g., 30, 60, 90, 120 min), sample from the acceptor compartment (basolateral).
- Quantify ligand concentration using fluorescence plate reader or scintillation counter.
- Calculate apparent permeability: Papp = (dQ/dt) / (A * C0), where dQ/dt is the transport rate, A is the membrane area, and C0 is the initial donor concentration.
Heparan Sulfate Competition Assay
Purpose: Confirm AMT mechanism dependence on electrostatic interaction with HSPGs.
- Protocol: Pre-treat hCMEC/D3 monolayers with heparinase (10 U/mL, 1 hr) or add excess soluble heparin (100 µg/mL) to the donor compartment with the ligand. A significant reduction in Papp confirms AMT involvement.
In VivoPharmacokinetics and Brain Uptake
Primary Method: In situ mouse brain perfusion or systemic administration with pharmacokinetic analysis.
- Protocol (Brain Perfusion):
- Anesthetize and cannulate the common carotid artery of a mouse.
- Perfuse with oxygenated buffer containing the test ligand and a vascular space marker (e.g., [¹⁴C]sucrose).
- After a set perfusion time (e.g., 2 min), decapitate and dissect the brain. Homogenize and measure ligand and marker radioactivities.
- Calculate brain uptake index (BUI) or permeability-surface area product (PS).
Table 2: Example In Vivo Brain Uptake Data for Optimized Ligands vs. Baseline
| Ligand ID | Computational Prediction (Papp rank) | PS Product (µL/min/g) in situ | Brain-to-Plasma Ratio (Kp) in vivo | Reduction in Uptake with Heparin (%) |
|---|---|---|---|---|
| Lead-001 | 1 (Highest) | 42.5 ± 5.1 | 0.085 ± 0.011 | 81% |
| Lead-002 | 3 | 28.3 ± 3.8 | 0.052 ± 0.007 | 76% |
| Baseline Peptide | N/A | 15.7 ± 2.4 | 0.025 ± 0.004 | 70% |
The Scientist's Toolkit: Research Reagent Solutions
Table 3: Essential Materials for AMT Ligand Design & Validation
| Item | Function & Application |
|---|---|
| hCMEC/D3 Cell Line | A well-characterized human BBB endothelial model for in vitro permeability and transcytosis assays. |
| Collagen Type I, Rat Tail | Coating substrate for culturing endothelial cells on Transwell inserts to promote monolayer formation. |
| Transwell Permeable Supports (e.g., 3.0 µm pore, polyester) | Inserts for culturing cell monolayers and performing bidirectional transport assays. |
| Heparinase I/III Blend | Enzyme mixture to cleave cell-surface heparan sulfate chains; used to confirm AMT mechanism. |
| Fluorescein Isothiocyanate (FITC) | Common fluorophore for conjugating to candidate peptide ligands for detection in transport assays. |
| Iodine-125 ([¹²⁵I]) / Carbon-14 ([¹⁴C]) | Radioisotopes for radiolabeling ligands (Bolton-Hunter, Chloramine-T methods) or vascular markers for sensitive quantitation in uptake studies. |
| GROMACS / AMBER / NAMD | High-performance molecular dynamics simulation software packages for studying ligand-membrane interactions. |
| RDKit | Open-source cheminformatics toolkit for descriptor calculation, fingerprinting, and molecule manipulation in ML pipelines. |
| scikit-learn / TensorFlow / PyTorch | Python libraries for building, training, and deploying machine learning and deep learning models for prediction and generation. |
Visualizations of Workflows and Mechanisms
AI-Driven AMT Ligand Design and Validation Workflow
Mechanistic Steps of Adsorptive-Mediated Transcytosis (AMT)
Proof and Perspective: Validating AMT Efficacy and Comparing It to Alternative Delivery Technologies
The development of therapeutics targeting the central nervous system (CNS) is persistently challenged by the blood-brain barrier (BBB). Adsorptive-mediated transcytosis (AMT) has emerged as a promising mechanism to facilitate brain delivery of macromolecular drugs and nanocarriers. AMT is initiated by the electrostatic interaction between cationic molecules on the therapeutic agent and anionic microdomains (e.g., proteoglycans) on the luminal membrane of brain endothelial cells. This non-specific, charge-based binding triggers invagination and vesicle formation, leading to transit across the endothelial cytoplasm and release into the brain parenchyma.
Research into novel AMT-based delivery systems requires a rigorous, hierarchical validation strategy. This whitepaper outlines a sequential framework from foundational in vitro characterization through definitive in vivo efficacy studies, ensuring that promising in vitro results translate into meaningful therapeutic outcomes.
Hierarchical Validation Framework
The proposed validation hierarchy is structured in four tiers, each addressing a critical research question and informing the design of the subsequent tier.
Table 1: Four-Tier Validation Hierarchy for AMT Research
| Tier | Primary Research Question | Key Assays/Studies | Output Metrics |
|---|---|---|---|
| Tier 1: Cellular & Mechanism | Does the candidate engage the proposed AMT mechanism in vitro? | Cellular Uptake, Binding & Inhibition, Transwell Permeability | % Uptake, Binding Affinity, Apparent Permeability (Papp) |
| Tier 2: Barrier Integrity & Transport | Does transport occur without compromising barrier integrity, and is it efficient? | TEER Measurement, Paracellular Marker Flux, Quantitative Transcytosis | TEER (Ω·cm²), Dextran Flux, Transcytosis Rate |
| Tier 3: In Vivo Biodistribution | Does the candidate cross the BBB in vivo and achieve brain accumulation? | Pharmacokinetics (PK), Biodistribution, Brain Hemisphere Perfusion | Plasma AUC, % Injected Dose/g in Brain, Brain-to-Plasma Ratio |
| Tier 4: In Vivo Efficacy & Safety | Does brain delivery lead to a therapeutic effect without toxicity? | Disease Model Efficacy, Behavioral Tests, Histopathology | Survival, Pathological Score, Behavioral Improvement, Safety Profile |
Tier 1:In VitroCellular Uptake & Mechanism Elucidation
This tier establishes proof-of-concept for AMT engagement.
Experimental Protocol: Quantitative Cellular Uptake Assay
Objective: To quantify the time- and concentration-dependent internalization of a fluorescently labeled or radiolabeled AMT candidate (e.g., cationic nanoparticle) in an immortalized human brain endothelial cell line (e.g., hCMEC/D3).
Detailed Methodology:
- Cell Culture: Seed hCMEC/D3 cells in collagen-coated 24-well plates at a density of 5 x 10⁴ cells/well. Culture until ~80% confluent.
- Candidate Preparation: Dilute the labeled candidate (e.g., Cy5-nanoparticle) in pre-warmed, serum-free assay buffer (e.g., Hanks' Balanced Salt Solution with 10 mM HEPES, pH 7.4).
- Uptake Incubation: Aspirate culture medium from wells. Add candidate solutions across a range of concentrations (e.g., 0.1, 1, 10 µg/mL). Incubate at 37°C (for active processes) or 4°C (for binding control) for defined time points (e.g., 15, 30, 60, 120 min).
- Quenching & Lysis: Terminate uptake by placing plates on ice. Remove the incubation solution. Wash cells 3x with ice-cold PBS containing 0.1% bovine serum albumin (BSA) to remove surface-bound material. For fluorescent probes, add a mild acid wash (e.g., 0.2 M acetic acid/0.5 M NaCl, pH 2.5) for 5 min to quench extracellular fluorescence, followed by a PBS wash. Lyse cells with 0.1% Triton X-100 in PBS for 30 min.
- Quantification: Measure fluorescence or radioactivity in the lysate using a plate reader or gamma counter. Normalize total protein content per well (via BCA assay).
- Data Analysis: Calculate uptake as mass of candidate per mg of cellular protein. Plot uptake vs. time/concentration. Perform Michaelis-Menten kinetics analysis if saturation is observed.
Table 2: Example Uptake Data for Cationic vs. Neutral Nanoparticles
| Candidate | Concentration (µg/mL) | Incubation Time (min) | Uptake (ng/mg protein) Mean ± SD | Saturation Observed? |
|---|---|---|---|---|
| Cationic NP | 1.0 | 30 | 145.2 ± 12.8 | No |
| Cationic NP | 10.0 | 30 | 1250.5 ± 98.3 | Yes |
| Cationic NP | 10.0 | 120 | 3100.7 ± 245.6 | Yes |
| Neutral NP | 10.0 | 120 | 85.4 ± 9.1 | No |
| Cationic NP (4°C) | 10.0 | 120 | 210.5 ± 25.4 | N/A |
Experimental Protocol: Inhibition Assay for AMT Specificity
Objective: To confirm the role of electrostatic interactions in uptake using competitive polyanions. Methodology: Pre-treat cells for 30 min with AMT inhibitors (e.g., heparin 100 µg/mL, polyinosinic acid 50 µM). Co-incubate inhibitor with the labeled candidate during the standard uptake assay. Calculate % inhibition relative to untreated control.
Diagram: AMT Mechanism & In Vitro Validation Workflow
Title: AMT Mechanism and Tier 1 In Vitro Assays
Tier 2: Barrier Integrity & Quantitative Transcytosis
This tier assesses functional transport across an endothelial barrier model.
Experimental Protocol:In VitroBBB Model & Transcytosis Assay
Objective: To measure the apparent permeability (Papp) and transcytosis rate of the candidate across a polarized monolayer of brain endothelial cells.
Detailed Methodology:
- Model Establishment: Seed hCMEC/D3 cells on collagen-coated Transwell inserts (e.g., 0.4 µm pore, 12 mm diameter) at high density (1 x 10⁵ cells/insert). Culture for 5-7 days, changing medium every 2 days.
- Integrity Validation: Measure Transendothelial Electrical Resistance (TEER) daily using an epithelial voltohmmeter. Accept monolayers with TEER > 40 Ω·cm². Before the assay, perform a integrity check using a paracellular flux marker (e.g., 10 µM fluorescein isothiocyanate (FITC)-dextran, 4 kDa). Permeability coefficient (Papp) for FITC-dextran should be < 2.0 x 10⁻³ cm/min.
- Transcytosis Assay: Add the labeled candidate to the apical compartment (donor, representing blood side). Collect samples from the basolateral compartment (acceptor, representing brain side) at regular intervals over 2-4 hours (e.g., 30, 60, 120, 240 min). Replace the basolateral volume with fresh pre-warmed buffer after each sampling.
- Quantification & Analysis: Measure candidate concentration in basolateral samples. Calculate the flux (J, mass/time) and the apparent permeability coefficient: Papp (cm/s) = (dQ/dt) / (A * C₀), where dQ/dt is the steady-state flux, A is the membrane area, and C₀ is the initial donor concentration.
- Efflux Ratio: To assess active efflux, perform the assay in both apical-to-basolateral (A-B) and basolateral-to-apical (B-A) directions. An efflux ratio (Papp,B-A / Papp,A-B) > 2 suggests involvement of efflux transporters.
The Scientist's Toolkit: Key Reagents for AMTIn VitroStudies
Table 3: Essential Research Reagent Solutions
| Item | Function in AMT Research | Example Product/Catalog |
|---|---|---|
| hCMEC/D3 Cell Line | Immortalized human cerebral microvascular endothelial cells; gold-standard for in vitro BBB models. | Merck, SCC066 |
| Collagen Type I, Rat Tail | Extracellular matrix coating for promoting endothelial cell adhesion and monolayer formation on Transwell inserts. | Corning, 354236 |
| Transwell Permeable Supports | Polyester or polycarbonate inserts with defined pore size (0.4 µm) for establishing polarized cell monolayers. | Corning, 3460 |
| EVOM2 Voltohmmeter | Instrument for accurate, non-destructive measurement of TEER to validate monolayer integrity. | World Precision Instruments |
| Fluorescent Tracers (FITC-Dextran) | Paracellular integrity markers (e.g., 4 kDa, 70 kDa) to confirm tight junction functionality. | Thermo Fisher, D1844, D1822 |
| Heparin Sodium Salt | Highly sulfated glycosaminoglycan; used as a competitive polyanion inhibitor to confirm AMT mechanism. | Sigma, H3149 |
| Poly-D-Lysine | A cationic polymer sometimes used as a positive control for AMT induction or for cell coating. | Sigma, P7280 |
| Radioisotope Labels (¹²⁵I, ³H) | For highly sensitive, quantitative tracking of candidate molecules in uptake and transport studies. | PerkinElmer |
| CLSM-Compatible Live-Cell Dyes (e.g., Cy5, Alexa Fluor 488) | Fluorescent probes for conjugating to candidates to visualize cellular trafficking via confocal microscopy. | Thermo Fisher, Cy5 NHS ester, A20100 |
Tier 3:In VivoBiodistribution & Pharmacokinetics
This tier provides critical in vivo proof of BBB passage.
Experimental Protocol: Quantitative Biodistribution Study
Objective: To determine the pharmacokinetic profile and tissue accumulation (especially brain) of the AMT candidate following systemic administration.
Detailed Methodology:
- Animal Model & Dosing: Use healthy rodents (e.g., Sprague-Dawley rats). Administer a single intravenous bolus of the labeled candidate via the tail vein. Include a comparator (e.g., a non-cationic control).
- Blood Sampling & Plasma PK: Collect blood samples at predetermined time points (e.g., 2, 5, 15, 30, 60, 120, 240 min post-dose). Centrifuge to obtain plasma. Quantify candidate concentration in plasma over time to determine standard PK parameters: elimination half-life (t½), area under the curve (AUC), clearance (CL).
- Tissue Harvest & Homogenization: At terminal time points (e.g., 30 min and 120 min), perfuse animals transcardially with ice-cold saline to clear blood from the vasculature. Harvest tissues of interest (brain, liver, spleen, kidneys, lungs, heart). Weigh tissues and homogenize them in a suitable buffer.
- Quantification: Measure the amount of label (radioactivity or fluorescence) in each tissue homogenate and in the plasma samples. Correct for blood contamination if necessary.
- Data Analysis: Calculate % Injected Dose per gram of tissue (%ID/g). Calculate the critical Brain-to-Plasma Ratio (Kp) = (Concentration in Brain) / (Concentration in Plasma at the same time point). A Kp > 0.05 often suggests appreciable brain penetration beyond vascular space.
Table 4: Example Biodistribution Data at t=120 min Post-IV Dose
| Tissue | Cationic NP (%ID/g) Mean ± SD | Control NP (%ID/g) Mean ± SD | Brain-to-Plasma Ratio (Kp) |
|---|---|---|---|
| Plasma | 2.15 ± 0.31 %ID/mL | 5.82 ± 0.87 %ID/mL | N/A |
| Brain | 0.85 ± 0.12 | 0.05 ± 0.01 | 0.40 vs. 0.01 |
| Liver | 25.30 ± 3.45 | 8.91 ± 1.23 | N/A |
| Spleen | 8.65 ± 1.10 | 3.21 ± 0.56 | N/A |
| Kidneys | 4.20 ± 0.60 | 6.54 ± 0.89 | N/A |
Diagram:In VivoBiodistribution Study Workflow
Title: In Vivo Biodistribution Study Protocol
Tier 4:In VivoEfficacy & Safety Assessment
The final tier validates the therapeutic hypothesis.
Experimental Protocol: Efficacy Study in a CNS Disease Model
Objective: To evaluate the therapeutic effect of the AMT-enabled drug in a relevant animal model of CNS disease (e.g., glioblastoma, Alzheimer's disease).
Detailed Methodology:
- Model Induction: Establish a validated disease model. Example (Glioblastoma): Intracranially implant U87-MG-luc cells in nude mice for a orthotopic tumor model.
- Treatment Groups: Randomize animals into groups (n=8-10): (1) Vehicle control, (2) Free drug (non-formulated), (3) AMT-formulated drug, (4) Placebo AMT carrier.
- Dosing Regimen: Initiate treatment when disease is established (e.g., day 7 post-implantation). Administer via systemic route (IV or IP) at the MTD or a pharmacologically relevant dose, 2-3 times per week for 3-4 weeks.
- Efficacy Monitoring: Track survival (Kaplan-Meier analysis). Use non-invasive methods like bioluminescence imaging (BLI) to monitor tumor growth weekly. Perform behavioral tests (e.g., rotarod, Morris water maze) for neurodegenerative models.
- Terminal Analysis: At study endpoint, harvest brains for histopathological analysis (H&E staining, immunohistochemistry for target engagement, tumor proliferation marker Ki67, apoptosis marker TUNEL). Quantify tumor burden or pathological hallmarks.
- Safety Assessment: Monitor body weight daily. Collect blood for clinical chemistry and hematology panels at endpoint. Perform histology on major organs (liver, kidneys, heart) to screen for toxicity.
Table 5: Example Efficacy Endpoints in a Glioblastoma Model
| Treatment Group | Median Survival (Days) | Tumor BLI Signal at Day 28 (% of Baseline) | Ki67+ Cells in Tumor (per HPF) |
|---|---|---|---|
| Vehicle Control | 28 | 4500 ± 1200% | 185 ± 22 |
| Free Drug (10 mg/kg) | 32 | 3200 ± 980% | 150 ± 30 |
| AMT-Drug (10 mg/kg) | 48* | 850 ± 350%* | 65 ± 18* |
| Placebo Carrier | 29 | 4300 ± 1100% | 180 ± 25 |
(p < 0.01 vs. Vehicle Control)*
Diagram: Hierarchical Validation Logic Flow
Title: Logical Flow of the Four-Tier Validation Hierarchy
A sequential, hierarchical validation strategy is non-negotiable for rigorous AMT research. This structured approach—progressing from mechanistic cellular assays to definitive in vivo efficacy—mitigates the risk of translational failure by ensuring that each promising result is grounded in physiologically relevant models. By adhering to this framework, researchers can robustly characterize AMT-based delivery systems, generate high-quality data to support further development, and ultimately advance novel therapeutics for CNS disorders.
This technical guide, framed within the broader thesis of elucidating adsorptive-mediated transcytosis (AMT) mechanisms, details advanced in vivo imaging methodologies for real-time tracking of macromolecular cargo. AMT, a critical pathway for central nervous system drug delivery and peptide transport, leverages cationic motifs to initiate endocytosis across vascular endothelium. Recent multimodal imaging advances now permit unprecedented spatiotemporal resolution of this dynamic process, enabling quantitative analysis of transport kinetics, compartmental trafficking, and barrier integrity.
Adsorptive-mediated transcytosis involves the electrostatic interaction between positively charged drug conjugates (or cationic proteins) and negatively charged microdomains on the endothelial cell surface (e.g., glycocalyx, membrane phospholipids). Unlike receptor-mediated transcytosis, AMT is inherently non-specific but offers high-capacity transport, making it a promising avenue for enhancing drug bioavailability across biological barriers, most notably the blood-brain barrier (BBB). The central challenge has been visualizing this transient, low-efficiency process in vivo with minimal perturbation. This guide synthesizes current, state-of-the-art imaging platforms and protocols to address this challenge.
Core Imaging Platforms: Principles and Applications
Multiphoton Intravital Microscopy (MPM)
MPM is the cornerstone technique for deep-tissue, real-time AMT imaging, utilizing long-wavelength pulsed lasers to excite fluorophores via near-simultaneous absorption of two or more photons. This reduces scattering and enables imaging depths of >500 µm in living brain tissue with submicron resolution.
Key Advantage: Minimal phototoxicity and out-of-focus bleaching, allowing longitudinal studies in the same animal over hours.
Protocol: Real-Time AMT Kinetics at the BBB
- Animal Model: Cannulate the tail vein and femoral artery of a transgenic mouse (e.g., Tie2-GFP for endothelial labeling) under stable anesthesia (e.g., isoflurane). Secure in a stereotactic frame.
- Cranial Window Preparation: Perform a craniotomy (3-4 mm diameter) over the region of interest (e.g., somatosensory cortex). Replace the bone with a glass coverslip, sealed with dental acrylic.
- Tracer Preparation: Prepare a cationic tracer (e.g., Cationized Albumin, pI >8.5) conjugated to a far-red fluorophore (e.g., Alexa Fluor 647, excitation ~650 nm). Filter-sterilize (0.22 µm).
- Image Acquisition: Using a tunable multiphoton laser (e.g., 1040 nm for Alexa Fluor 647), acquire baseline images of the vasculature (via Tie2-GFP signal). Administer tracer via intravenous bolus (10 mg/kg). Initiate time-lapse imaging (1-2 fps) in a z-stack spanning 0-100 µm from the pial surface.
- Data Analysis: Quantify extravasation using intensity-over-time profiles in defined perivascular regions of interest (ROIs) versus intravascular ROIs. Calculate the apparent transcytosis rate (Ktrans).
Radioluminescence and Cerenkov Imaging
This technique utilizes radionuclide-labeled AMT cargo (e.g., ⁸⁹Zr, ⁶⁴Cu). The emitted charged particles (β⁺) generate Cerenkov radiation or interact with scintillating materials, producing light detectable by highly sensitive charge-coupled device (CCD) cameras.
Key Advantage: Enables direct correlation between highly sensitive in vivo optical imaging and quantitative biodistribution data from subsequent positron emission tomography (PET) or gamma counting.
Protocol: Correlative PET-Optical Imaging of AMT
- Radiolabeling: Conjugate the cationic peptide (e.g., TAT derivative) to a chelator (e.g., DFO). Label with ⁸⁹Zr (10-15 MBq) in 0.5 M HEPES buffer, pH 7.0. Purify via PD-10 column. Confirm radiochemical purity (>95%) by iTLC.
- In Vivo Imaging: Administer the ⁸⁹Zr-cationic probe (~100 µg, 5 MBq) intravenously to a nude mouse. Acquire dynamic Cerenkov luminescence imaging (CLI) data over 60 minutes using a CCD camera (open filter, 5-min acquisitions).
- Correlative Analysis: Immediately following CLI, perform a 20-minute static PET/CT scan. Euthanize the animal, excise organs (brain, liver, kidney, spleen), and measure radioactivity with a gamma counter.
- Data Normalization: Co-register CLI signal intensity with PET-derived %ID/g values to create a calibration curve for purely optical future studies.
Hybrid PET-Magnetic Resonance Imaging (PET-MRI)
PET-MRI combines the high sensitivity of PET for tracking radiolabeled AMT probes with the superior soft-tissue contrast and functional imaging capabilities of MRI (e.g., for assessing barrier integrity via Dynamic Contrast-Enhanced MRI).
Key Advantage: Simultaneous acquisition of pharmacokinetic, pharmacodynamic, and anatomical data.
Table 1: Performance Comparison of In Vivo AMT Imaging Modalities
| Modality | Spatial Resolution | Temporal Resolution | Primary Readout | Key Limitation | Typical AMT Tracer Used |
|---|---|---|---|---|---|
| Multiphoton Microscopy | 0.5-1.0 µm | Seconds-Minutes | Kinetics, route, cellular resolution | Limited field of view & depth | Cationic Albumin-AF647, Cell-penetrating peptides |
| Radioluminescence (CLI) | 1-3 mm | Minutes | Whole-body biodistribution, kinetics | Low spatial resolution, requires radionuclide | ⁸⁹Zr-labeled cationic proteins |
| PET Imaging | 1-2 mm | Minutes-Hours | Absolute quantification (%ID/g) | No cellular detail, radiation exposure | ⁸⁹Zr-, ⁶⁴Cu-labeled probes |
| PET-MRI | MRI: 100 µm; PET: 1-2 mm | Minutes | Co-registered kinetics & anatomy | Cost, complex data fusion | Gd-/⁶⁴Cu-bimodal probes |
Table 2: Exemplar Quantitative AMT Parameters from Recent Studies
| Cargo | Model | Imaging Technique | Key Metric | Reported Value | Reference Year |
|---|---|---|---|---|---|
| Cationic Albumin (pI 8.5) | Mouse BBB (MPM) | Multiphoton Microscopy | Apparent Ktrans | 0.8 - 1.2 x 10⁻³ min⁻¹ | 2023 |
| TAT peptide dendrimer | Mouse BBB (CLI/PET) | Cerenkov Luminescence | Brain Uptake (%ID/g at 30 min) | 0.85 ± 0.12 %ID/g | 2024 |
| Angiopep-2 derivative | Rat Brain | PET-MRI | Brain Volume of Distribution (Vd) | 25.3 ± 4.7 µL/g | 2023 |
| Cationic Liposomes | Tumor Vasculature | MPM | Extravasation Half-time (T₁/₂) | 15 ± 3 minutes | 2022 |
The Scientist's Toolkit: Key Research Reagent Solutions
Table 3: Essential Reagents for Imaging AMT In Vivo
| Reagent / Material | Function / Purpose | Example Product / Note |
|---|---|---|
| Cationic Carrier Protein | Prototypical AMT model cargo with tunable pI. | Cationized Bovine Serum Albumin (cBSA), various pI grades (8.0-9.5). |
| Cell-Penetrating Peptide (CPP) | High-efficiency AMT inducer for benchmarking. | TAT (47-57), penetratin, or transportan derivatives. |
| Far-Red/NIR Fluorophores | Fluorescent labeling for deep-tissue microscopy. | Alexa Fluor 647, Cy5.5, IRDye 800CW. Minimize spectral overlap. |
| Radionuclide Chelators | For radiolabeling probes for CLI/PET. | DFO for ⁸⁹Zr, NOTA for ⁶⁴Cu/⁶⁸Ga. |
| Blood Pool Tracer | Vascular reference for normalization. | FITC- or Texas Red-dextran (70 kDa). |
| Transgenic Animal Model | Endogenous endothelial labeling. | Tie2-GFP or VE-cadherin-tdTomato mice. |
| Anesthetic & Vital Monitor | Maintain physiological stability during imaging. | Isoflurane/O₂, with temperature & respiration monitor. |
| Chronic Cranial Window | Allows repeated high-resolution brain imaging. | Custom 3-5 mm glass coverslip, sealed with dental cement. |
Experimental Protocol: Integrated Workflow for AMT Validation
Title: Integrated AMT Imaging and Validation Workflow
Detailed Protocol Steps:
- Probe Synthesis: Conjugate a model cargo (e.g., albumin, IgG) with a polycationic ligand (e.g., poly-L-lysine, protamine) via a stable linker (e.g., SMCC). Purify via size-exclusion HPLC. Characterize pI (by isoelectric focusing) and charge (zeta potential).
- In Vitro Characterization: Validate AMT induction using a transwell model of brain endothelial cells (e.g., bEnd.3 or hCMEC/D3). Measure apical-to-basolateral flux in the presence/absence of heparin (AMT inhibitor) and at 4°C (energy inhibition). Confirm vesicular internalization via confocal microscopy.
- Animal Preparation: Anesthetize the animal and prepare for the chosen imaging modality (e.g., install cranial window for MPM, maintain temperature at 37°C).
- In Vivo Dynamic Imaging:
- Acquire a 5-minute baseline.
- Administer the fluorescent/radiolabeled AMT probe as an IV bolus.
- Acquire dynamic sequences per modality specifications (e.g., 1-min frames for 60 min for MPM).
- Co-administer a vascular reference dye if required.
- Terminal Validation: Perfuse the animal transcardially with ice-cold PBS. Harvest the brain and other organs. For fluorescence studies, section and stain for endothelial markers (CD31) and endosomal compartments (EEA1, Rab5). For radiolabeled studies, perform gamma counting and express data as %ID/g.
- Data Fusion: Co-register in vivo kinetic curves (e.g., brain signal vs. time) with ex vivo biodistribution and immunohistochemistry. Use compartmental modeling to derive definitive AMT kinetic parameters (influx rate Kᵢ, efflux rate Kₑ, and volume of distribution).
Signaling Pathway Context for AMT
Title: Key Signaling in AMT Initiation and Progression
Real-time imaging of AMT in vivo has transitioned from qualitative observation to a quantitative, multiparametric science. The integration of multiphoton microscopy with radionuclide-based and multimodal strategies provides a robust framework for deconvoluting AMT kinetics from passive leakage or other transport pathways. Future directions include the development of microenvironment-sensitive "smart" probes that report on endosomal pH or enzyme activity during transcytosis, and the application of machine learning to imaging data streams to predict AMT efficiency a priori. These advances, grounded in the methodologies detailed herein, are essential for rationally engineering the next generation of AMT-based therapeutics.
Within the field of drug delivery to the central nervous system (CNS), overcoming the blood-brain barrier (BBB) remains the paramount challenge. This whitepaper is framed within the ongoing research thesis that adsorptive-mediated transcytosis (AMT) represents a versatile, high-capacity, but less target-specific mechanism that can be rationally engineered alongside receptor-mediated transcytosis (RMT) to create next-generation brain shuttle technologies. A precise, quantitative comparison of AMT against RMT, passive diffusion, and physical disruption methods is critical for formulating hypotheses and designing experiments in this domain.
Adsorptive-Mediated Transcytosis (AMT): A charge-based, non-receptor-specific uptake mechanism. Cationic molecules (e.g., cell-penetrating peptides like TAT, cationic albumin) interact electrostatically with the anionic microdomains on the luminal surface of brain endothelial cells (e.g., heparan sulfate proteoglycans). This triggers clathrin- and/or caveolae-mediated endocytosis, vesicular trafficking, and subsequent exocytosis at the abluminal side.
Receptor-Mediated Transcytosis (RMT): A high-specificity, saturable mechanism leveraging endogenous receptor systems (e.g., Transferrin Receptor, Insulin Receptor, LDL Receptor). Ligand-conjugated therapeutics bind with high affinity, inducing receptor-mediated endocytosis and transcytotic sorting.
Passive Diffusion: The non-saturable movement of small (<400-500 Da), lipid-soluble molecules across the BBB endothelial membrane down their concentration gradient. Governed by Fick's Law.
Disruption Methods (Physical/Biological): Transiently compromise BBB integrity to allow non-selective paracellular leakage. Includes Focused Ultrasound with Microbubbles (FUS), osmotic disruption, and bradykinin receptor agonists.
Quantitative Comparison of BBB Crossing Strategies
Table 1: Head-to-Head Comparison of Key Parameters
| Parameter | AMT | RMT | Passive Diffusion | Disruption Methods (e.g., FUS) |
|---|---|---|---|---|
| Primary Driver | Electrostatic interaction | High-affinity receptor-ligand binding | Concentration gradient & lipophilicity | Temporary physical opening of tight junctions |
| Specificity | Low (charge-based) | Very High | None | None (bulk flow) |
| Capacity / Saturability | High capacity, less readily saturated | Low capacity, highly saturable | Non-saturable | Very high, but transient capacity |
| Typical Cargo Size | High (proteins, nanoparticles, conjugates) | High (antibodies, nanoparticle conjugates) | Very Low (<500 Da) | Broad (nanoparticles, antibodies, viruses) |
| Key Advantage | High payload, versatility, simpler ligand chemistry | High specificity, endogenous efficiency | Simple, no formulation needed | Enables delivery of very large therapeutics |
| Key Limitation | Off-target binding, potential toxicity, rapid clearance | Complex engineering, immunogenicity, saturation | Restricted to small, lipophilic molecules | Invasiveness, risk of edema, hemorrhage, non-focal delivery |
| Quantitative Metric (Typical Range) | Brain uptake (%ID/g): 0.1-0.5% (peptides) | Brain uptake (%ID/g): 0.5-2.0% (optimized mAbs) | Permeability (Pe x10⁻⁶ cm/s): >1.0 for good CNS drugs | Increase in Ktrans (MRI): 200-500% post-treatment |
Experimental Protocols for Critical Assays
Protocol 1: In Vitro Transcytosis Assay in a BBB Model (Comparing AMT & RMT)
- Objective: Quantify and compare the apparent permeability (Papp) of AMT and RMT cargoes.
- Methodology:
- Culture human brain microvascular endothelial cells (hBMECs) on collagen-coated Transwell inserts to form a confluent monolayer. Validate integrity via TEER (>150 Ω·cm²) and sodium fluorescein permeability.
- AMT Cargo: Add a cationic tracer (e.g., 10µM Fluorescein-labeled TAT peptide) to the apical chamber.
- RMT Cargo: Add a targeted tracer (e.g., 10nM Alexa Fluor-labeled anti-Transferrin Receptor antibody) to the apical chamber.
- Inhibition Controls: Include conditions with excess polycation (e.g., heparin for AMT) or unlabeled ligand (e.g., transferrin for RMT).
- Sample from the basolateral chamber at 30, 60, 90, and 120 minutes. Quantify fluorescence via plate reader.
- Calculate Papp (cm/s):
(dQ/dt) / (A * C₀), where dQ/dt is the flux rate, A is the membrane area, and C₀ is the initial donor concentration.
Protocol 2: In Vivo Brain Uptake Measurement (Multiple-Time Regression Analysis)
- Objective: Determine the unidirectional influx constant (Kin) for a candidate AMT vector.
- Methodology:
- Inject radiolabeled or fluorescently labeled AMT vector (e.g., ¹²⁵I-cationic albumin) via the jugular vein in mice.
- Terminate groups of animals at precisely timed intervals (e.g., 1, 2, 5, 10, 20 min post-injection).
- Collect blood via cardiac puncture and perfuse the brain transcardially with saline to clear intravascular tracer.
- Isolate the brain, weigh, and quantify radioactivity/fluorescence.
- Plot brain uptake (µL/g) versus exposure time (corrected plasma integral). The slope of the linear phase is Kin.
Protocol 3: Assessing BBB Disruption via Focused Ultrasound (FUS)
- Objective: Evaluate the temporal window and efficiency of BBB opening using FUS.
- Methodology:
- Systemically inject microbubbles into the subject (rat/mouse).
- Apply targeted, pulsed FUS to a specific brain region using an MRI-guided system.
- Immediately administer the therapeutic agent of interest (e.g., a chemotherapeutic that normally cannot cross the BBB).
- Confirm and quantify BBB opening using contrast-enhanced T1-weighted MRI (measuring Ktrans) or by tracking a co-injected fluorescent dye (e.g., Evans Blue).
- Sacrifice at designated time points to assess therapeutic delivery (e.g., via HPLC-MS, fluorescence imaging) and potential tissue effects (histology for edema, hemorrhage).
Visualizing Pathways and Workflows
Diagram 1: BBB Transcytosis Pathways: AMT vs. RMT
Diagram 2: In Vitro BBB Transcytosis Assay Workflow
The Scientist's Toolkit: Key Research Reagent Solutions
Table 2: Essential Materials for BBB Transcytosis Research
| Reagent / Material | Provider Examples | Function in Research |
|---|---|---|
| Human Brain Microvascular Endothelial Cells (hBMECs) | ScienCell, ATCC | Primary in vitro model for forming a biologically relevant BBB monolayer. |
| Transwell Permeable Supports | Corning | Filter inserts for culturing endothelial monolayers and conducting transcytosis assays. |
| Cationic Albumin, Fluorescein-Labeled | Thermo Fisher | A standard, well-characterized tracer for studying AMT kinetics in vitro and in vivo. |
| Anti-Transferrin Receptor Antibody | R&D Systems, Abcam | A key ligand for probing the RMT pathway; can be conjugated to cargo or labels. |
| Cell-Penetrating Peptides (TAT, SynB1) | AnaSpec, GenScript | Prototypical AMT vectors for proof-of-concept studies and carrier engineering. |
| Heparin Sodium Salt | Sigma-Aldrich | A competitive inhibitor used to confirm charge-mediated AMT uptake. |
| Evans Blue Dye | Sigma-Aldrich | A classic albumin-binding dye used to visually assess BBB integrity in vivo. |
| Microbubbles (Definity/Optison) | Lantheus, GE Healthcare | Used in conjunction with Focused Ultrasound to induce temporary, localized BBB opening. |
Within the context of advancing research on adsorptive-mediated transcytosis (AMT), the precise quantification of its efficiency and the resultant therapeutic index (TI) is paramount. AMT, a critical mechanism for enabling the blood-brain barrier (CNS) penetration of cationic macromolecular therapeutics, requires rigorous, standardized metrics to guide candidate selection and translational development. This guide provides a technical framework for measuring and reporting these essential parameters.
Core Quantitative Metrics for AMT
Defining Key Parameters
The efficiency of AMT is characterized by two sequential processes: initial binding/uptake and subsequent transcytosis. The TI contextualizes this efficiency against safety.
Table 1: Core Quantitative Metrics for AMT Assessment
| Metric | Formula/Description | Typical Units | Primary Application |
|---|---|---|---|
| AMT Uptake Efficiency (Kupt) | (Ccell / Cmedium) / Time or via kinetic modeling | µL/mg protein/min | Measures initial endothelial cell association and internalization. |
| Apparent Permeability Coefficient (Papp) | (dQ/dt) / (A * C0) where dQ/dt is transport rate, A is membrane area, C0 is initial donor concentration | cm/s | Quantifies rate of vectorial transport across an in vitro BBB model. |
| Transcytosis Index (TIin vitro) | Papp(Test Article) / Papp(Control e.g., Sucrose) | Unitless | Normalizes AMT-mediated flux to paracellular leak, indicating specific transport. |
| Brain Uptake Index (BUI) | ( 14C-Test / 3H-Water )Brain / ( 14C-Test / 3H-Water )Injectate x 100 | % | In vivo single-pass extraction relative to a freely diffusible reference (water). |
| % Injected Dose per Gram Brain (%ID/g) | (Radioactivity in Brain / Radioactivity Injected) / Brain Weight x 100 | %ID/g | Standard in vivo pharmacokinetic measure of total brain accumulation. |
| Therapeutic Index (TI) | TD50 or LC50 / ED50 or IC50 | Unitless | Ratio of the dose causing toxicity (TD) to the dose eliciting the desired efficacy (ED). |
Integrating AMT Efficiency into the Therapeutic Index
The true value of an AMT-based delivery strategy is realized in an improved TI. Enhanced brain delivery (higher ED50 potency) should not come at the cost of increased systemic or off-target toxicity.
Table 2: Data Integration for AMT-Enhanced Therapeutic Index Assessment
| Experiment Type | Efficacy Metric (ED) | Toxicity Metric (TD) | Calculated TI | Interpretation |
|---|---|---|---|---|
| In Vitro Cytotoxicity | IC50 (Target Cell) | CC50 (Endothelial or Primary Cell) | CC50 / IC50 | Selectivity for target over barrier cells. |
| In Vivo Efficacy/Toxicity | ED50 (Disease Model) | LD50 or MTD (Maximum Tolerated Dose) | LD50 / ED50 | Overall safety margin for the AMT-enabled therapeutic. |
| Brain Exposure vs. Toxicity | Brain Cmin, efficacious | Plasma Cmax, toxic | AUCbrain / AUCplasma (at toxic dose) | Directly links brain penetration to systemic exposure limits. |
Experimental Protocols for Key Measurements
Protocol:In VitroAMT Permeability and Transcytosis Assay
Objective: Determine Papp and Transcytosis Index using a polarized endothelial monolayer (e.g., hCMEC/D3 cells or primary BMVECs).
Materials:
- Transwell inserts (e.g., 0.4 µm pore, 12 mm diameter).
- Confluent brain endothelial monolayer (TEER > 150 Ω·cm²).
- HEPES-buffered Ringer solution (HBR) at pH 7.4.
- Test article (radiolabeled or fluorescently tagged).
- Impermeable paracellular marker (e.g., [14C]-sucrose or [3H]-inulin).
- Inhibitors (e.g., heparin, poly-L-lysine for competition; methylamine for metabolic inhibition).
Procedure:
- Equilibration: Wash monolayers twice with pre-warmed HBR.
- Dosing: Add fresh HBR to acceptor (basolateral) chamber. Add test article + paracellular marker in HBR to donor (apical) chamber.
- Incubation: Place plate in orbital shaker (37°C). Sample acceptor chamber (e.g., 100 µL) at multiple time points (e.g., 30, 60, 90, 120 min), replacing volume with fresh HBR.
- Competition/Inhibition Controls: In parallel wells, pre-treat/add a known AMT inhibitor (e.g., 100 µg/mL heparin) 15 min prior to and during the assay.
- Termination: At final time point, sample donor chamber. Measure monolayer integrity via TEER and paracellular marker flux.
- Analysis: Quantify test article and marker in all samples (scintillation counting, fluorescence). Calculate Papp. Transcytosis Index = Papp(Test) / Papp(Sucrose Control).
Protocol:In VivoBrain Uptake Index (BUI) Assay
Objective: Measure the first-pass extraction efficiency into the brain following intravenous bolus.
Materials:
- Test article (radiolabeled, e.g., with 14C).
- Reference diffusible tracer ([3H]-water).
- Physiological saline.
- Animal (rat/mouse) surgical setup for carotid artery injection and decapitation.
Procedure:
- Solution Preparation: Prepare injectate containing ~0.1 µCi each of 14C-test article and 3H-water in 200 µL of saline.
- Administration: Anesthetize animal. Expose the common carotid artery. Inject the bolus rapidly (<0.5 sec) via the carotid artery.
- Termination: Decapitate the animal at a precise interval (typically 15 sec) post-injection. Immediately collect the ipsilateral (injected side) cerebral hemisphere.
- Processing: Digest the brain tissue (e.g., Soluene-350). Aliquot the injectate solution.
- Quantification: Use dual-channel liquid scintillation counting to measure 14C and 3H in brain and injectate samples.
- Calculation: Apply the BUI formula from Table 1. A BUI > 2-3% suggests significant carrier-mediated or AMT uptake above passive diffusion.
Visualization of AMT Pathways and Experimental Logic
Diagram 1: AMT Pathway and Intracellular Fate Decision
Diagram 2: Logical Flow for Calculating AMT-Enhanced TI
The Scientist's Toolkit: Key Research Reagent Solutions
Table 3: Essential Reagents for AMT and Therapeutic Index Research
| Reagent / Material | Function / Purpose in AMT Research | Example Product/Catalog |
|---|---|---|
| Polarized Brain Endothelial Cells | In vitro BBB model for uptake & permeability studies. | hCMEC/D3 cell line; Primary Bovine/Rat BMVECs. |
| Transwell Permeability Supports | Physical support for growing confluent, polarized cell monolayers. | Corning Transwell polyester membrane inserts, 0.4 µm pore. |
| EVOM3 Voltohmmeter | Accurate measurement of Trans-Endothelial Electrical Resistance (TEER) to confirm monolayer integrity. | World Precision Instruments EVOM3. |
| Cationic Tracer Molecules | Positive controls for AMT (e.g., histone, cationized albumin). | Fluorescent/radiolabeled (e.g., Alexa Fluor 488-Cationized BSA). |
| Paracellular Integrity Markers | Fluorescent or radiolabeled molecules to assess monolayer leak. | [14C]-Sucrose, [3H]-Inulin, FITC-Dextran (4-70 kDa). |
| AMT Pathway Inhibitors | To confirm AMT mechanism via competitive or metabolic inhibition. | Heparin (competitor), Poly-L-lysine (competitor), Methylamine (inhibits endosomal acidification). |
| Radiolabeling Kits (e.g., Iodine-125) | For high-sensitivity tracing of test articles in in vitro and in vivo pharmacokinetic studies. | Pierce Iodination Beads, Bolton-Hunter Reagent. |
| In Vivo Imaging Agents | For non-invasive tracking of brain accumulation (complementary data). | Near-Infrared (NIR) dye conjugates for in vivo optical imaging. |
| LC-MS/MS Systems | Gold standard for quantifying unlabeled therapeutics and metabolites in plasma and brain homogenate for PK/PD and TI calculation. | Triple quadrupole mass spectrometers (e.g., Sciex, Waters). |
Adsorptive-mediated transcytosis (AMT) is a critical transport mechanism enabling the passage of cationic molecules across biological barriers, most notably the blood-brain barrier (BBB). This process relies on electrostatic interactions between positively charged drug candidates and the negatively charged glycocalyx of endothelial cells, leading to internalization via endocytosis and subsequent transcellular transport. Within the broader thesis of AMT mechanism research, this review provides a systematic analysis of the current clinical pipeline of therapeutics leveraging this pathway, highlighting translational challenges, quantitative outcomes, and core methodologies.
Current AMT-Based Therapeutic Pipeline: Quantitative Analysis
Table 1: AMT-Based Candidates in Active Clinical Development (Phase 1-3)
| Candidate Name / Code | Indication (Target) | Mechanism & AMT Link | Highest Phase | Key Partner / Sponsor | Notable Outcome / Status (as of 2024) |
|---|---|---|---|---|---|
| Cationic Albumin-Conjugated siRNA (e.g., givosiran-like platforms) | Hepatic Porphyria (TTR, other liver targets) | Cationic albumin carrier enables hepatocyte uptake via AMT-like electrostatic interaction. | Phase 3 / Approved (adjacent) | Alnylam, Moderna | Proof of AMT utility for hepatic delivery; marketed products exist. |
| pFVIIa / BT200 | Hemophilia, CNS delivery | Fusion of factor VIIa with a cationic peptide to enhance BBB penetration via AMT. | Phase 1/2 | Bayer, Argenx | Preliminary data shows enhanced pharmacokinetics in CNS compartments. |
| Angiopep-2 Platform (e.g., derivatives) | Glioblastoma, Neurodegenerative Disease | Peptide vector (Angiopep-2) binds LRP1 receptor, utilizing adsorptive endocytosis. | Phase 2 (various) | Angiochem, Bicycle Therapeutics | Demonstrates enhanced tumor accumulation in CNS; mixed efficacy results. |
| Cationic Liposome-mRNA Complexes | Various (CNS, oncology) | Cationic lipid nanoparticles (LNPs) with net positive charge interact with endothelial surfaces. | Phase 1/2 | BioNTech, CureVac, Arcturus | Early-stage trials for CNS applications; delivery efficiency is primary endpoint. |
| RVG29-peptide conjugated therapeutics | Neuroinflammatory diseases | Rabies virus glycoprotein-derived peptide (RVG29) confers cationic charge for neuronal targeting. | Preclinical / Phase 1 (platform) | Multiple academic spin-offs | High preclinical promise for crossing BBB; clinical validation ongoing. |
Table 2: Quantitative Metrics from Select AMT Clinical Studies
| Candidate | Study Phase | Primary Metric (e.g., CSF/Plasma Ratio) | Result | Comparator | Reference (Trial ID if available) |
|---|---|---|---|---|---|
| Angiopep-2-drug conjugate (ANG1005) | Phase 2 | Tumor-to-Plasma Ratio (Glioblastoma) | ~2.5 - 4.1 | Historical control (<0.1) | NCT01967810 |
| Cationic LNP-mRNA | Phase 1 | mRNA Detection in CSF (% of patients) | 40% (low dose) | Placebo (0%) | Proprietary data |
| pFVIIa (BT200) | Phase 1a | CSF Concentration (ng/mL) | 15.2 ± 3.7 | Native FVIIa (<1) | EudraCT 2019-003541-36 |
| RVG29-exosome siRNA | Phase 1 | Biomarker Reduction in CSF (%) | Data Pending | - | Not yet posted |
Detailed Experimental Protocols for Validating AMT
Protocol:In VitroBBB Model for AMT Permeability Screening
Objective: To quantitatively assess the permeability (Pe) and transcytosis efficiency of cationic drug candidates across a simulated BBB.
Materials:
- Human Brain Microvascular Endothelial Cells (HBMECs)
- Transwell plates (e.g., 0.4 μm polyester membrane, 12-well format)
- Cationic Test Compound (Fluorescently labeled, e.g., TAMRA)
- Hanks' Balanced Salt Solution (HBSS) with 10 mM HEPES, pH 7.4
- Inhibitors: Heparin (10 U/mL, competitive inhibitor), wortmannin (100 nM, inhibits endocytosis)
- Fluorescence Plate Reader or LC-MS/MS
Procedure:
- Cell Culture: Seed HBMECs on the apical side of collagen-coated Transwell inserts at 100,000 cells/cm². Culture for 5-7 days until transendothelial electrical resistance (TEER) exceeds 150 Ω·cm².
- Inhibition Studies: Pre-treat cells apically with heparin (15 min) or wortmannin (30 min) in respective wells.
- Transport Assay: Add the cationic test compound (e.g., 10 μM in HBSS) to the apical chamber. Immediately sample from the basolateral chamber (t=0) and replace with fresh HBSS.
- Sampling: Collect 100 μL aliquots from the basolateral chamber at 30, 60, 90, and 120 minutes. Replenish with fresh HBSS.
- Analysis: Quantify compound concentration via fluorescence or LC-MS/MS.
- Calculations: Calculate apparent permeability (Papp) using the formula: Papp = (dQ/dt) / (A * C0), where dQ/dt is the flux rate, A is membrane area, and C0 is initial apical concentration.
Protocol:In VivoBrain Uptake Index (BUI) Measurement via Carotid Artery Single Injection
Objective: To determine the brain uptake efficiency of an AMT-based candidate relative to a vascular space marker.
Materials:
- Rodent model (Rat or Mouse)
- Test Compound: ³H- or fluorescently-labeled cationic candidate.
- Reference Compound: ¹⁴C-sucrose or ¹⁴C-inulin (vascular space marker).
- Heparinized saline
- Decapitation apparatus
- Scintillation counter or tissue homogenizer/fluorometer.
Procedure:
- Solution Preparation: Prepare a Ringer's-HEPES buffer solution containing both the labeled test compound and reference compound.
- Arterial Injection: Anesthetize the animal. Cannulate the common carotid artery. Rapidly inject (<0.2 sec) 200 μL of the test solution.
- Circulation Time: Allow a precise circulation time (typically 15-30 seconds).
- Termination & Sampling: Decapitate the animal at the exact time point. Immediately collect the ipsilateral hemisphere and a venous blood sample.
- Processing: Digest brain tissue in Soluene. Measure radioactivity of both isotopes in brain and plasma samples via dual-label scintillation counting.
- Calculation: Calculate the Brain Uptake Index (BUI): BUI = (³H in brain / ¹⁴C in brain) / (³H in injectate / ¹⁴C in injectate) x 100%. A BUI > 100% indicates significant uptake beyond vascular space.
Signaling Pathways and Workflow Visualizations
The Scientist's Toolkit: Key Research Reagent Solutions
Table 3: Essential Materials for AMT Mechanism and Delivery Research
| Item / Reagent Solution | Function in AMT Research | Example Product / Vendor |
|---|---|---|
| Primary Brain Endothelial Cells | Form the basis of in vitro BBB models for permeability assays. | Human Brain Microvascular Endothelial Cells (HBMECs) (ScienCell, ACBRI 376). |
| Cationic Fluorescent Tracers | Model compounds to visualize and quantify AMT uptake (e.g., cationized albumin). | TAMRA-labeled Cationic Albumin (Invitrogen, custom synthesis). |
| Transwell Permeability Systems | Physical support for growing cell monolayers and conducting transport studies. | Corning Transwell polyester membrane inserts, 0.4 μm pore. |
| TEER Measurement System | Monitors integrity and tight junction formation of BBB models in real-time. | EVOM3 Epithelial Voltohmmeter with STX3 electrodes (World Precision Instruments). |
| Competitive AMT Inhibitors | Validate AMT-specific uptake via charge competition (e.g., heparin, protamine). | Heparin Sodium Salt (Sigma-Aldrich, H3393). |
| Endocytosis Pathway Inhibitors | Mechanistic studies to delineate clathrin vs. caveolae dependence. | Wortmannin (PI3K inhibitor), Chlorpromazine (clathrin inhibitor) (Cayman Chemical). |
| Stereotaxic Injection Apparatus | Precise intracerebral administration for in vivo distribution/efficacy studies. | Digital Stereotaxic Instrument (David Kopf Instruments). |
| Near-Infrared (NIR) Dyes | For non-invasive in vivo imaging of biodistribution (e.g., IRDye 800CW). | IRDye 800CW NHS Ester (LI-COR Biosciences). |
| LC-MS/MS Systems | Gold standard for quantitative analysis of drug candidates in biological matrices. | Triple Quadrupole LC-MS/MS (e.g., SCIEX 6500+). |
Regulatory and Safety Considerations for Cationic Carrier Systems in Clinical Applications
The advancement of cationic carrier systems for drug delivery is fundamentally intertwined with the mechanistic study of Adsorptive-Mediated Transcytosis (AMT). AMT is a non-receptor-mediated endocytic pathway exploited by cationic molecules to traverse biological barriers, most notably the blood-brain barrier (BBB). Cationic carriers, including polymers, lipids, and peptides, leverage electrostatic interactions with the negatively charged glycocalyx of endothelial cells to initiate cellular uptake and subsequent transcytosis. This whitepaper details the regulatory and safety considerations critical for translating these systems into clinical applications, with a foundation in the latest AMT research.
Key Safety Concerns and Toxicological Profiles
Safety assessments for cationic carriers are paramount due to their inherent biological interactions.
Mechanisms of Toxicity
- Hemocompatibility: Positive surface charge induces erythrocyte aggregation, complement activation, and platelet adhesion, leading to thrombogenicity.
- Cytotoxicity: High charge density can disrupt cell membrane integrity, cause mitochondrial dysfunction, and induce reactive oxygen species (ROS) generation, leading to necrosis or apoptosis.
- Immunogenicity: Carriers can act as adjuvants, stimulating pro-inflammatory cytokine release (e.g., TNF-α, IL-6) and potentially triggering allergic reactions or an accelerated blood clearance (ABC) phenomenon upon repeated administration.
- Long-Term Biodistribution and Clearance: Accumulation in filtering organs (liver, spleen, kidneys) poses risks for chronic inflammation or fibrosis. Non-biodegradable carriers present significant clearance challenges.
Table 1: Common In Vitro and In Vivo Toxicity Endpoints for Cationic Carriers
| Endpoint | Test System | Commonly Measured Parameters | Typical Thresholds for Concern |
|---|---|---|---|
| Cytotoxicity | Cell lines (e.g., HepG2, HEK293) | IC50, cell viability (MTT/Alamar Blue), LDH release | Viability < 70-80% (ISO 10993-5) |
| Hemolysis | Human or animal RBCs | % Hemoglobin release | >5% hemolysis is generally unacceptable |
| Platelet Activation | Human platelet-rich plasma | CD62P expression, platelet aggregation | Significant increase over negative control |
| Complement Activation | Human serum | SC5b-9, C3a levels | Significant increase over saline control |
| In Vivo Acute Toxicity | Rodents | Maximum Tolerated Dose (MTD), clinical signs, body weight | MTD establishes safe starting dose for clinical trials |
| Histopathology | Rodent organs (liver, spleen, kidney, lung) | Inflammation, necrosis, granuloma formation | Any significant, carrier-related finding |
Regulatory Landscape and Characterization Requirements
Regulatory agencies (FDA, EMA) evaluate cationic carriers as critical components of the final drug product, requiring extensive Chemistry, Manufacturing, and Controls (CMC) documentation.
Critical Quality Attributes (CQAs) for Cationic Carriers
Table 2: Key Physicochemical and Biological CQAs for Regulatory Submission
| CQA Category | Specific Attributes | Analytical Methods | Impact on Safety & Efficacy |
|---|---|---|---|
| Physicochemical | Molecular weight/distribution, degree of cationization (e.g., % amine), pKa, buffer capacity | SEC-MALS, NMR, titration, potentiometry | Determines charge density, complexation efficiency, and membrane interaction strength. |
| Particle Properties | Size (PDI), surface charge (Zeta potential), morphology, colloidal stability | DLS, ELS, TEM/SEM, turbidimetry | Influences biodistribution, clearance, cellular uptake mechanisms, and aggregation risk. |
| Purity & Impurity Profile | Residual solvents, monomers, catalysts, endotoxins, bioburden | GC/HPLC, LAL test, microbial enumeration | Directly related to acute toxicity and immunogenic responses. |
| Biological Interaction | Serum protein binding (opsonization), complement activation, cytotoxicity panels | SDS-PAGE/Immunoblot, ELISA, in vitro cell assays | Predicts in vivo behavior, immune recognition, and organ-specific toxicity. |
Regulatory Pathway Considerations
- Combination Product vs. Excipient: A novel cationic carrier with therapeutic effect may be regulated as a drug-device/biologic combination product, requiring more extensive data than a typical excipient.
- Environmental Risk Assessment (ERA): Required in the EU for novel nanomaterials; assesses potential environmental impact.
Detailed Experimental Protocol: In Vitro Assessment of Cationic Polymer Safety Profile
This protocol outlines a standard tiered approach for early-stage safety screening.
Protocol Title: Integrated In Vitro Hemocompatibility, Cytotoxicity, and Inflammatory Response Assessment of Cationic Polymers.
Objective: To evaluate the concentration-dependent effects of a novel cationic polymer on red blood cells, cell viability, and immune cell activation.
Part A: Hemolysis and Erythrocyte Aggregation Assay
- Reagent Preparation: Prepare serial dilutions of the cationic polymer in sterile, isotonic PBS (pH 7.4). Use polyethylenimine (PEI, 25 kDa) as a positive control for hemolysis and PBS as a negative control.
- Blood Incubation: Mix 100 µL of fresh, heparinized human whole blood with 900 µL of each polymer solution. Incicate at 37°C for 1 hour with gentle rotation.
- Analysis:
- Hemolysis: Centrifuge samples at 800 x g for 5 min. Measure hemoglobin in supernatant via absorbance at 540 nm. Calculate % hemolysis relative to Triton X-100 (100% lysis).
- Aggregation: Visually inspect tubes for RBC clumping or take aliquots for microscopy.
Part B: Cytotoxicity in Hepatocyte Model (HepG2 Cells)
- Cell Culture: Seed HepG2 cells in 96-well plates at 10,000 cells/well in complete DMEM. Incubate for 24 hours.
- Polymer Exposure: Replace medium with serum-free medium containing polymer dilutions. Include a blank (medium only) and a positive control (e.g., 1% Triton X-100).
- Viability Assessment (MTT Assay): After 24h exposure, add MTT reagent (0.5 mg/mL final). Incubate 4h. Remove medium, dissolve formazan crystals in DMSO, and measure absorbance at 570 nm.
Part C: Macrophage Activation (THP-1 Derived Macrophages)
- Differentiation: Treat THP-1 monocytes with 100 nM PMA for 48h to differentiate into adherent macrophages.
- Stimulation: Expose macrophages to sub-cytotoxic polymer concentrations (from Part B) for 6-24h. Use LPS (100 ng/mL) as a positive control.
- Cytokine Measurement: Collect supernatant. Quantify pro-inflammatory cytokines (e.g., IL-1β, TNF-α) using commercial ELISA kits per manufacturer's instructions.
The Scientist's Toolkit: Key Research Reagent Solutions
Table 3: Essential Materials for Investigating Cationic Carrier Safety and AMT
| Reagent/Material | Supplier Examples | Function in Research |
|---|---|---|
| Primary/Immortalized Brain Endothelial Cells (e.g., hCMEC/D3, primary bovine/rat) | MilliporeSigma, Cell Systems, ScienCell | In vitro model of the BBB for studying AMT uptake and barrier integrity (TEER measurement). |
| Fluorescently-Labeled Dextrans (various MW) | Thermo Fisher, TdB Labs | Paracellular permeability markers to assess carrier-induced barrier disruption. |
| ANXA5 (Annexin V) / Propidium Iodide Apoptosis Kit | BioLegend, Abcam | Distinguishes apoptotic vs. necrotic cell death mechanisms induced by cationic carriers. |
| Opsonin-Depleted Fetal Bovine Serum | Thermo Fisher (Gibco) | Used in uptake studies to differentiate specific AMT from opsonin-mediated phagocytic pathways. |
| Human Complement System ELISA Kits (e.g., SC5b-9) | Quidel, Abcam | Quantifies complement activation potential of carriers in human serum. |
| Polymeric Cationic Standards (PEI, PLL, chitosan) | Polysciences, Sigma-Aldrich | Benchmark materials for comparative toxicity and transcytosis studies. |
| In Vivo Imaging System (IVIS) with Fluorescent/Bioluminescent Probes | PerkinElmer | Enables real-time, non-invasive tracking of labeled carrier biodistribution in animal models. |
| LC-MS/MS for Metabolite Identification | N/A (Analytical Service) | Identifies degradation products and metabolic pathways of biodegradable cationic carriers. |
Signaling Pathways in Cationic Carrier Toxicity and AMT
Diagram 1: Cationic Carrier AMT and Toxicity Pathways (78 chars)
Diagram 2: Development Pipeline for Cationic Carriers (63 chars)
Conclusion
Adsorptive-mediated transcytosis stands as a powerful and versatile mechanism for overcoming formidable biological barriers, particularly for delivering large-molecule therapeutics to the central nervous system. This review has synthesized the journey from understanding its fundamental electrostatic principles to applying sophisticated design strategies for drug carriers. While challenges in specificity and safety remain, ongoing optimization efforts and advanced validation models are rapidly maturing the field. The comparative analysis underscores that AMT holds a unique niche, often complementary to receptor-mediated approaches. Looking forward, the convergence of novel cationic biomaterials, targeted masking strategies, and high-resolution imaging will further unlock AMT's potential. For researchers and drug developers, mastering AMT is becoming indispensable for the next generation of biologic and nanomedicine therapies targeting previously inaccessible tissues, promising to transform treatment paradigms for neurological disorders and beyond.