The Hydrophobic-Hydrophilic Balance: Optimizing Nanoparticle Surface Chemistry for Extended Circulation and Precise Targeting
This article provides a comprehensive analysis for researchers and drug development professionals on the critical trade-off between nanoparticle hydrophobicity and systemic performance.
The Hydrophobic-Hydrophilic Balance: Optimizing Nanoparticle Surface Chemistry for Extended Circulation and Precise Targeting
Abstract
This article provides a comprehensive analysis for researchers and drug development professionals on the critical trade-off between nanoparticle hydrophobicity and systemic performance. We explore the foundational principles governing how surface hydrophobicity influences protein corona formation, clearance by the mononuclear phagocyte system (MPS), and biodistribution. The content details modern methodologies for surface modification and characterization, addresses common challenges in balancing stealth properties with cellular uptake, and evaluates validation techniques and comparative performance of different coating strategies. The goal is to present a strategic framework for designing nanoparticles that achieve the optimal hydrophobic-hydrophilic balance to maximize circulation half-life and enhance target-site accumulation.
Understanding the Hydrophobicity Paradox: How Surface Chemistry Dictates Nanoparticle Fate In Vivo
Technical Support Center
Troubleshooting Guide: Common Issues in Nanoparticle Surface Engineering
Issue 1: Rapid Clearance by the Mononuclear Phagocyte System (MPS)
- Problem: Nanoparticles are cleared from circulation within minutes.
- Likely Cause: Surface is too hydrophobic or has insufficient steric stabilization, leading to opsonization.
- Solution: Increase PEGylation density or switch to a longer-chain PEG (e.g., from PEG-2000 to PEG-5000). Verify complete conjugation via NMR or colorimetric assays (e.g., iodoplatinate for PEG detection).
Issue 2: Poor Cellular Uptake in Target Tissues
- Problem: Nanoparticles circulate well but fail to be internalized by target cells.
- Likely Cause: Surface is too hydrophilic ("stealthy"), preventing necessary interactions with the cell membrane.
- Solution: Precisely titrate the density of targeting ligands (e.g., antibodies, peptides) onto the nanoparticle surface. Ensure a balance between PEG-spacer length and ligand accessibility.
Issue 3: Nanoparticle Aggregation in Physiological Buffer
- Problem: Particles aggregate upon introduction to PBS or serum-containing media.
- Likely Cause: Incomplete surface modification, leaving patches of hydrophobic core material exposed.
- Solution: Optimize the encapsulation or conjugation protocol. Increase the molar ratio of hydrophilic surfactant/linker during synthesis. Always perform Dynamic Light Scattering (DLS) in both water and PBS to check hydrodynamic radius and PDI before and after buffer exchange.
Issue 4: Inconsistent Batch-to-Batch Targeting
- Problem: Cellular uptake efficiency varies significantly between synthesis batches.
- Likely Cause: Inconsistent molar ratios of hydrophobic core material, hydrophilic polymer, and targeting ligand during synthesis.
- Solution: Implement rigorous quality control: use HPLC to purify conjugated species and UV-Vis spectroscopy to quantify ligand density per particle. Standardize all solvent and reagent sources.
Frequently Asked Questions (FAQs)
Q1: What is the optimal PEG density to achieve the "Goldilocks Zone" for long circulation? A: The optimal density is system-dependent, but literature suggests a minimum of 5-10 PEG chains (Mw: 2000-5000 Da) per 100 nm² of nanoparticle surface area to effectively reduce protein adsorption. Higher densities may inhibit targeting.
Q2: How do I accurately measure the hydrophobicity/hydrophilicity of my nanoparticle surface? A: Direct measurement is challenging. Use proxy methods:
- Contact Angle Measurement: Create a thin film of your nanoparticles and measure the water contact angle. A lower angle indicates a more hydrophilic surface.
- Protein Adsorption Assay: Incubate nanoparticles with serum, isolate, and use a BCA or Bradford assay to quantify adsorbed protein. Less protein correlates with higher hydrophilicity/stealth.
- Two-Phase Partitioning: Mix nanoparticles in a water/octanol system. The distribution coefficient indicates overall hydrophobicity.
Q3: Can I use both PEG and a targeting ligand on the same nanoparticle? A: Yes, this is standard. The key is the conjugation strategy. Use heterobifunctional PEG (e.g., NHS-PEG-Maleimide) where one end attaches to the particle and the other provides a specific group for ligand conjugation. This allows control over ligand orientation and density.
Q4: My targeted nanoparticles are still being sequestered by the liver. Why? A: Even with PEG, high ligand density (>5% surface coverage) can attract opsonins or engage with non-target cells in the liver (e.g., Kupffer cells). Reduce ligand density and ensure ligands are specific to your target antigen with low cross-reactivity.
Table 1: Impact of PEG Chain Length & Density on Key Pharmacokinetic Parameters
| PEG Chain Length (Da) | PEG Density (chains/100nm²) | Hydrodynamic Size (nm) | PDI | Serum Protein Adsorption (% reduction vs. non-PEG) | Circulation Half-life (in mice) |
|---|---|---|---|---|---|
| None (Hydrophobic) | 0 | 110 | 0.25 | 0% | < 5 min |
| 2000 | 5 | 125 | 0.15 | 65% | ~2 hours |
| 2000 | 15 | 135 | 0.12 | 85% | ~6 hours |
| 5000 | 5 | 140 | 0.10 | 80% | ~10 hours |
| 5000 | 15 | 155 | 0.18 | 92% | ~15 hours |
Table 2: Ligand Density Effects on Uptake in Target vs. Non-Target Cells
| Targeting Ligand | Ligand Density (molecules/particle) | Cellular Uptake in Target Cells (RFU/μg protein) | Cellular Uptake in Macrophages (RFU/μg protein) | Specificity Index (Target/Macrophage) |
|---|---|---|---|---|
| None (PEG-only) | 0 | 150 | 200 | 0.75 |
| cRGD peptide | 20 | 1200 | 450 | 2.67 |
| cRGD peptide | 50 | 3500 | 2200 | 1.59 |
| cRGD peptide | 100 | 4000 | 5000 | 0.80 |
Detailed Experimental Protocols
Protocol 1: Controlled PEGylation of PLGA Nanoparticles via Carbodiimide Chemistry Objective: To conjugate methoxy-PEG-amine (mPEG-NH₂) to carboxylate-terminated PLGA nanoparticles. Materials: See "The Scientist's Toolkit" below. Steps:
- Activation: Resuspend 10 mg of purified PLGA NPs (with surface -COOH) in 2 mL of MES buffer (0.1 M, pH 5.5). Add 10 mg of EDC and 15 mg of NHS. React for 15 minutes at room temperature with gentle stirring.
- Purification: Isolate activated NPs using a centrifugal filter (100 kDa MWCO). Wash twice with cold MES buffer to remove excess EDC/NHS.
- Conjugation: Redisperse NPs in 2 mL of borate buffer (0.1 M, pH 8.5). Add mPEG-NH₂ at the desired molar excess (e.g., 100x relative to estimated surface COOH). React for 4 hours at 4°C.
- Quenching & Final Purification: Add 100 μL of 1 M glycine (pH 8.0) to quench unreacted sites for 30 min. Purify PEGylated NPs via size-exclusion chromatography (e.g., Sepharose CL-4B) or extensive dialysis against DI water. Lyophilize for storage.
Protocol 2: Quantifying Ligand Density via UV-Vis Spectroscopy Objective: To determine the number of antibody ligands per nanoparticle. Materials: Antibody-conjugated NPs, unconjugated antibody standard, UV-Vis spectrophotometer. Steps:
- Standard Curve: Prepare a series of dilutions of the pure antibody in PBS. Measure absorbance at 280 nm. Plot concentration vs. A₂₈₀ to create a standard curve.
- Sample Digestion: Dissolve a known mass (e.g., 1 mg) of your antibody-NP conjugate in 1 mL of 0.1 M NaOH. Incubate at 37°C for 2 hours to degrade the nanoparticle core and release the antibody.
- Measurement: Centrifuge the digested sample to remove any insoluble core remnants. Measure the A₂₈₀ of the supernatant.
- Calculation: Use the standard curve to determine the antibody concentration in the digest. Calculate the total mass of antibody in your 1 mg sample. Using the molecular weight of the antibody and the measured number of particles per mg (from DLS/NTA), calculate the average ligand density.
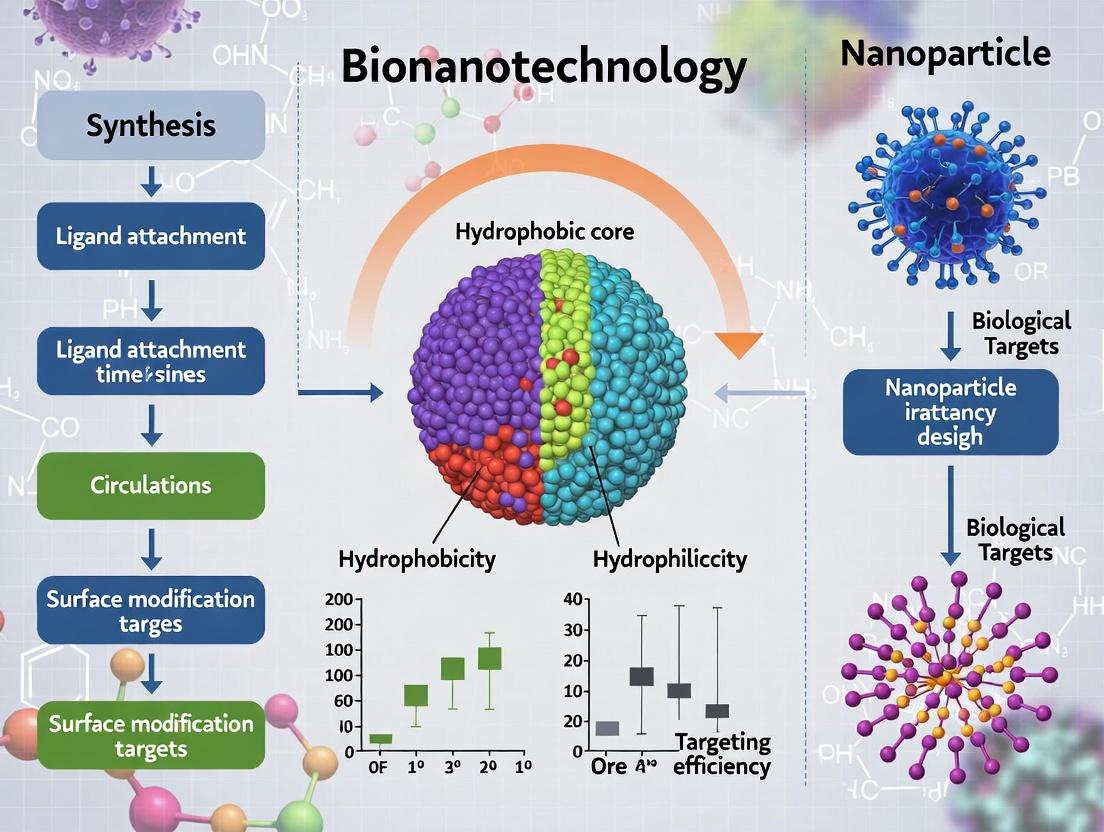
Visualizations
Balancing Surface Properties for Drug Delivery
Nanoparticle Surface Optimization Workflow
The Scientist's Toolkit: Essential Reagents & Materials
| Item & Example Product | Function in Surface Engineering |
|---|---|
| Heterobifunctional PEG(e.g., NHS-PEG-Maleimide, MW: 3400) | Spacer/linker that attaches to nanoparticle on one end and provides a specific reactive group for ligand conjugation on the other. Critical for controlled ligand orientation. |
| Carbodiimide Crosslinkers(e.g., EDC, Sulfo-NHS) | Activates carboxyl groups on particle surfaces for conjugation to amine-containing molecules (e.g., PEG-amines, antibodies). |
| Functionalized Polymers(e.g., COOH- or NH2-terminated PLGA) | Provides reactive chemical handles on the nanoparticle core for subsequent conjugation steps. The starting point for controlled chemistry. |
| Dynamic Light Scattering (DLS) Instrument | Measures hydrodynamic diameter, polydispersity index (PDI), and zeta potential. Essential for monitoring size stability and surface charge before/after modification. |
| Size Exclusion Chromatography (SEC) Columns(e.g., Sepharose CL-4B, Sephacryl S-500) | Purifies conjugated nanoparticles from unreacted small-molecule reagents (PEG, ligands, crosslinkers). Ensures batch reproducibility. |
| UV-Vis Spectrophotometer | Quantifies ligand density by measuring the absorbance of chromophores (e.g., antibodies at 280 nm, dyes on ligands). Enables precise dosing calculations. |
| Dialysis Membranes/Centrifugal Filters(Appropriate MWCO, e.g., 100 kDa) | Removes salts, solvents, and unreacted reagents during nanoparticle washing and buffer exchange steps. |
Technical Support Center: Troubleshooting & FAQs
Context: This support center is designed for researchers working within the thesis framework of optimizing nanoparticle (NP) surface hydrophobicity. The goal is to balance prolonged systemic circulation (minimizing opsonin adsorption) with effective cellular targeting (which may require some controlled interaction). The following guides address common experimental challenges related to characterizing the protein corona and its dependence on hydrophobicity.
Frequently Asked Questions (FAQs)
Q1: My nanoparticles are aggregating immediately upon introduction to plasma or serum. What is the cause and how can I prevent this? A: Rapid aggregation is often a direct result of excessive surface hydrophobicity, leading to massive, non-specific protein adsorption and bridging between particles.
- Troubleshooting Steps:
- Characterize Baseline Hydrophobicity: Use a hydrophobic interaction column or measure the water contact angle of your NP film. Quantify before proceeding.
- Increase Hydrophilic Coating Density: If using PEG or other polymers, increase the grafting density. Ensure complete surface coverage.
- Employ a More Robust Hydrophilic Ligand: Consider switching from short-chain PEG to longer chains (e.g., > 5 kDa) or alternative hydrophilic polymers like poly(2-oxazoline)s or polyzwitterions.
- Introduce Serum Gradually: When incubating with biofluid, use a slow, dropwise addition under vigorous vortexing to prevent local protein denaturation hotspots.
Q2: I observe inconsistent protein corona compositions between experiments using the same nanoparticle batch. What are the key variables to control? A: Reproducibility is critical. Inconsistencies often stem from unregulated experimental parameters.
- Troubleshooting Checklist:
- Biofluid Source & Handling: Use single-donor or pooled serum from the same species and lot. Avoid repeated freeze-thaw cycles of serum.
- Incubation Conditions: Strictly control temperature (37°C recommended), time (typical 0.5-1 hr), and agitation (gentle rotation prevents sedimentation).
- NP:Protein Ratio: This is crucial. Maintain a consistent NP surface area to protein concentration ratio. See Table 1 for guidance.
- Isolation Protocol: Standardize the centrifugation/washing steps (speed, time, buffer, number of washes) immediately after incubation.
Q3: How can I experimentally prove that hydrophobic interactions are the primary driver of opsonin adsorption in my system? A: You need a controlled experiment that isolates hydrophobicity as the variable.
- Recommended Protocol: Hydrophobicity-Specific Competitive Binding Assay.
- Prepare a series of NPs with a gradient of hydrophobicity (e.g., by varying the ratio of hydrophobic to hydrophilic monomers during synthesis).
- Incubate each NP type with fluorescently labeled model opsonins (e.g., fibrinogen, IgG) in the presence and absence of increasing concentrations of a non-ionic surfactant (e.g., Pluronic F127 or Tween-80).
- Isolate the NPs and measure the fluorescence associated with the pellet.
- Expected Outcome: NPs with higher hydrophobicity will show greater fluorescent opsonin signal. This signal will be competitively inhibited by the surfactant in a dose-dependent manner, confirming the role of hydrophobic interactions. NPs with low hydrophobicity will show weak, non-competible binding.
Q4: My targeting ligand seems to lose its function after corona formation. How can I design NPs to retain "targeting visibility"? A: This is the core "corona conundrum." The corona may sterically shield your ligand.
- Design Solutions:
- Use a Hydrophobic Anchor: Attach your targeting ligand (e.g., an antibody fragment, peptide) to the NP core via a hydrophobic domain. This allows it to embed within the inner, "hard" corona layer, potentially keeping it accessible.
- Employ a Cleavable Linker: Design the ligand-NP linkage to be cleaved by enzymes present at the target site (e.g., matrix metalloproteinases in tumors), releasing the ligand to interact.
- Optimal Hydrophobicity Window: Aim for a surface that is just hydrophilic enough to minimize major opsonins (like complement factors) but retains slight hydrophobicity that may allow the targeted ligand to remain partially exposed or dynamically interact with the receptor.
Data Presentation Tables
Table 1: Effect of Incubation Parameters on Corona Composition
| Parameter | Typical Range | Impact on Opsonin Adsorption | Recommendation for Circulation-Time Studies |
|---|---|---|---|
| NP:Protein Ratio | 1:1 to 1:100 (w/w) | Low ratio = "Vroman effect," dynamic exchange. High ratio = protein depletion, non-physiological. | Use a high surface area:protein ratio (e.g., 1 cm²/mL serum) to mimic in vivo conditions. |
| Incubation Time | 1 min - 24 hours | Rapid adsorption of abundant proteins (albumin, fibrinogen), slower enrichment of high-affinity opsonins. | Standardize at 60 minutes for a representative "steady-state" corona. |
| Temperature | 4°C - 37°C | Higher temp increases kinetic energy, can denature proteins, enhancing hydrophobic adsorption. | Incubate at 37°C for physiological relevance. |
| pH | 6.5 - 7.5 | Affects protein charge and conformation, altering interaction with NP surface. | Maintain at pH 7.4 using appropriate buffer. |
Table 2: Common Opsonins and Their Interaction with Surface Hydrophobicity
| Opsonin | Molecular Weight (kDa) | Key Function | Affinity for Hydrophobic Surfaces | Consequence for NP Clearance |
|---|---|---|---|---|
| Immunoglobulin G (IgG) | ~150 | Binds Fc receptors on macrophages. | Moderate-High. Hydrophobic patches in Fab/Fc regions mediate adsorption. | Promotes phagocytosis via MPS (Liver, Spleen). |
| Fibrinogen | ~340 | Acute phase protein; inflammation. | Very High. Undergoes conformational change on hydrophobic surfaces. | Rapid clearance, platelet activation, potential thrombosis. |
| Complement C3 | ~185 | Central component of complement cascade. | High. Hydrophobic domains exposed upon activation bind to surfaces. | Opsonization for phagocytosis, triggers inflammatory response. |
| Apolipoproteins (e.g., ApoE) | 34-44 | Lipid transport. | Very High. Naturally bind to hydrophobic lipid surfaces. | Can mediate brain targeting (via LDLR) or liver clearance. |
| Albumin | ~66.5 | Most abundant plasma protein. | Low under physiological conditions. Binds weakly to hydrophobic surfaces. | Can form a "stealth" layer if pre-coated, but may displace on hydrophobic NPs. |
Experimental Protocols
Protocol 1: Isolating and Analyzing the Hard Protein Corona Objective: To isolate the strongly bound ("hard") protein corona for downstream identification via mass spectrometry or gel electrophoresis. Materials: NP dispersion, human serum (or plasma), physiological buffer (e.g., PBS, pH 7.4), ultracentrifuge, sucrose cushion (optional). Steps:
- Incubation: Incubate NPs (at a ratio of 1 mg NP per 100 µL serum) in buffer at 37°C for 60 minutes with gentle rotation.
- Separation: Ultracentrifuge the mixture at 100,000 x g for 1 hour at 4°C to pellet the NP-corona complexes.
- Wash: Carefully discard the supernatant. Gently resuspend the pellet in cold, fresh buffer. Repeat centrifugation and wash two more times to remove loosely associated proteins.
- Elution: Resuspend the final pellet in 1X Laemmli SDS-PAGE sample buffer. Heat at 95°C for 10 minutes to denature and elute proteins from the NP surface.
- Analysis: Centrifuge to remove NP debris. Analyze the supernatant via SDS-PAGE (Coomassie/silver stain) or LC-MS/MS.
Protocol 2: Quantifying Hydrophobicity via Hydrophobic Interaction Chromatography (HIC) Objective: To rank the relative surface hydrophobicity of different NP formulations. Materials: HIC column (e.g., Phenyl Sepharose), HPLC system, ammonium sulfate buffer (high salt), low salt buffer (e.g., PBS), NP samples. Steps:
- Equilibration: Equilibrate the HIC column with a high-salt buffer (e.g., 1.5 M ammonium sulfate in phosphate buffer, pH 7.0).
- Sample Preparation: Dialyze your NP samples into the same high-salt buffer.
- Injection & Run: Inject the NP sample. Run a decreasing salt gradient (from high salt to low salt/water) over 30-60 minutes.
- Detection: Monitor elution via UV-Vis (at NP plasmon band for gold NPs, or scatter detector for polymeric NPs).
- Interpretation: More hydrophobic NPs will bind stronger and elute later in the gradient (at lower salt concentrations). Less hydrophobic NPs will elute earlier.
The Scientist's Toolkit: Key Research Reagent Solutions
| Item | Function & Rationale |
|---|---|
| Polyethylene Glycol (PEG) Thiols/Alcohols | The gold standard for creating a hydrophilic, steric barrier. Reduces opsonization and extends circulation half-life. |
| Pluronic F127 / Poloxamer 407 | Triblock copolymer surfactant (PEO-PPO-PEO). Used to shield hydrophobic surfaces temporarily or as a coating to prevent non-specific adsorption. |
| Density Gradient Media (Sucrose/Iodixanol) | Used in ultracentrifugation to create a cushion for cleaner isolation of NP-corona complexes, separating them from unbound proteins. |
| Size-Exclusion Chromatography (SEC) Columns | For gentle, non-denaturing separation of NP-corona complexes from free proteins, preserving weak interactions for analysis. |
| Protease Inhibitor Cocktails | Added to serum/plasma and buffers during corona isolation to prevent protein degradation by endogenous enzymes. |
| Model Opsonins (Fluorophore-labeled) | Purified, labeled proteins (e.g., Alexa Fluor-labeled Fibrinogen, IgG) for quantitative tracking of specific opsonin adsorption in competitive assays. |
| 2-D Fluorescence Difference Gel Electrophoresis (2D-DIGE) Kits | For high-sensitivity, comparative analysis of the entire corona proteome from different NP formulations. |
Visualizations
Technical Support Center: Troubleshooting Nanoparticle Pharmacokinetics
Welcome to the technical support center for researchers investigating nanoparticle (NP) clearance mechanisms. This guide addresses common experimental issues related to the Mononuclear Phagocyte System (MPS) and renal filtration, framed within the critical challenge of balancing NP hydrophobicity for optimal circulation time and targeting.
Troubleshooting Guides & FAQs
Q1: My nanoparticles show rapid clearance from blood (<10 min half-life) in murine models, contrary to the expected prolonged circulation from PEGylation. What could be the issue?
- A: Rapid clearance often indicates dominant MPS uptake. Key troubleshooting steps:
- Check PEG Density & Conformation: Low PEG density (<5% molar ratio) or poor conjugation chemistry leads to a "mushroom" conformation, failing to shield the NP core. Use quantitative NMR or colorimetric assays (e.g., iodide assay for PEG-thiol) to verify grafting density.
- Analyze Hydrophobic "Hotspots": Residual hydrophobic patches on the NP surface promote protein opsonization. Perform fluorescence-based assays using hydrophobic dyes (e.g., Nile Red) to map surface hydrophobicity.
- Verify Protein Corona Composition: Isolate the corona via centrifugation and analyze by SDS-PAGE or LC-MS/MS. A high abundance of opsonins (e.g., immunoglobulins, complement C3, fibrinogen) confirms MPS targeting.
Q2: My small-diameter NPs (<6 nm) designed for renal clearance are accumulating in the liver. How do I resolve this?
- A: Liver accumulation suggests insufficient size reduction or surface charge issues.
- Confirm Hydrodynamic Diameter (Dh): Use Dynamic Light Scattering (DLS) in biologically relevant media (e.g., PBS, plasma). A Dh < 5.5 nm is typically required for efficient glomerular filtration. Remember: DLS reports intensity-weighted size; always check for larger aggregates.
- Assess Surface Charge: Highly positive or negative charges can interact with glomerular basement membrane proteoglycans. Target a near-neutral zeta potential (-10 to +10 mV) in physiological pH.
- Validate Rigidity: Flexible, soft NPs clear renally more efficiently than rigid ones of the same size. Use atomic force microscopy (AFM) to probe nanomechanical properties.
Q3: I observe high inter-animal variability in biodistribution data for my NPs. How can I improve experimental consistency?
- A: Variability often stems from inconsistencies in NP administration or animal handling.
- Standardize Injection Protocol: Use tail vein injection with a consistent volume (e.g., 100-150 µL for mice), rate (slow, steady push), and formulation vehicle. Pre-warm the tail to dilate veins.
- Monitor Injection Quality: Utilize in vivo imaging to confirm a clean, non-extravasated injection. A bolus should clear the tail vein within seconds.
- Control Animal Health Status: Inflammation from pathogens or stress can drastically alter MPS activity. Use specific pathogen-free (SPF) animals and minimize pre-experimental stress.
Q4: How can I experimentally distinguish between MPS clearance via the liver Kupffer cells and the splenic macrophages?
- A: Specific protocols are required to deconvolute these organs' contributions.
- Ex Vivo Organ Perfusion: Post-euthanasia, perfuse the liver and spleen separately with buffer to remove blood pool NPs before quantifying tissue-associated signal via gamma counting or fluorometry.
- Cellular Isolation & Flow Cytometry: Digest liver and spleen tissue. Use antibodies against cell-specific markers (e.g., F4/80+ CD11b+ for Kupffer cells, CD169+ for splenic marginal zone macrophages) to quantify NP uptake per cell population.
- Blockade Studies: Pre-administer a clodronate liposome formulation to deplete specific phagocyte populations 24h before NP injection, then compare clearance kinetics.
Key Quantitative Data on Clearance Mechanisms
Table 1: Size-Dependent Clearance Pathways of Nanoparticles
| Hydrodynamic Diameter (Dh) | Primary Clearance Route | Typical Half-Life (Blood) | Key Determinants |
|---|---|---|---|
| < 6 nm | Renal Filtration | Minutes to Few Hours | Size, rigidity, charge. Must be < the renal filtration threshold (~5.5 nm). |
| 6 - 200 nm | MPS Uptake (Liver/Spleen) | Highly Variable (Min to Days) | Surface chemistry (PEG density, charge), protein corona composition. |
| > 200 nm | Rapid MPS Uptake | Minutes (<10 min common) | Size ensures rapid splenic filtration and Kupffer cell phagocytosis. |
Table 2: Impact of Surface Properties on MPS Uptake & Half-Life
| Surface Modification | Effect on Hydrophobicity | Common Effect on Blood Half-Life (Mouse) | Primary Clearance Mechanism Impacted |
|---|---|---|---|
| None (Bare Hydrophobic Core) | High | Very Short (< 30 min) | Rapid opsonization and MPS sequestration. |
| Low-Density PEG (< 5 mol%) | Moderately Reduced | Short (30 min - 2 hrs) | Incomplete shielding, variable corona. |
| High-Density PEG (> 15 mol%) | Significantly Reduced | Long (Several hours to >24 hrs) | Effective steric shielding, reduced MPS uptake. |
| Targeting Ligands (e.g., Antibodies) | Variable | Can be Shortened | May increase MPS recognition if not optimally cloaked. |
Experimental Protocols
Protocol 1: Assessing Protein Corona Composition via Ultracentrifugation Objective: Isolate and identify proteins adsorbed onto NPs after plasma exposure.
- Incubation: Incubate 1 mL of NP solution (1 mg/mL) with 9 mL of 100% human or murine plasma at 37°C for 1 hour.
- Isolation: Transfer to ultracentrifuge tubes. Pellet the NP-corona complex at 100,000 x g, 4°C for 1 hour.
- Wash: Carefully discard supernatant. Gently resuspend pellet in 1 mL of cold PBS (pH 7.4). Repeat centrifugation and washing twice.
- Dissociation & Analysis: Resuspend final pellet in 50 µL of SDS-PAGE loading buffer. Heat at 95°C for 10 min to denature and dissociate proteins. Analyze via gel electrophoresis or mass spectrometry.
Protocol 2: In Vivo Renal Clearance Assessment Objective: Quantify the fraction of administered NPs excreted via urine.
- Administration: Inject NPs (Dh < 6 nm) intravenously into metabolically housed mice (n=5).
- Urine Collection: House mice in individual metabolic cages. Collect total urine output over intervals (e.g., 0-2h, 2-8h, 8-24h) post-injection.
- Quantification: Measure NP signal (fluorescence, radioactivity, elemental content via ICP-MS) in each urine sample and in the initial injected dose.
- Calculation: Calculate cumulative renal excretion as:
(Total signal in urine / Total injected signal) * 100%.
Visualizations
The Scientist's Toolkit: Key Research Reagent Solutions
Table 3: Essential Materials for Clearance Mechanism Studies
| Reagent / Material | Function / Application |
|---|---|
| Methoxy-PEG-Thiol (HS-PEG-OCH₃) | Gold standard for creating steric shielding on gold or other metallic NPs to reduce MPS uptake. |
| DSPE-PEG (Lipid-PEG) | Amphiphilic polymer for incorporating PEG corona onto lipid-based nanoparticles (LNPs, liposomes). |
| Clodronate Liposomes | A tool to deplete phagocytic macrophages in vivo, enabling study of MPS contribution to clearance. |
| Fluorescent Dyes (Cy5.5, DiR) | Near-infrared dyes for in vivo and ex vivo imaging of NP biodistribution and clearance. |
| Size Exclusion Chromatography (SEC) Columns | For purifying NPs by size, removing aggregates, and exchanging buffer to a physiologically relevant medium. |
| Phosphotungstic Acid (PTA) | Common negative stain for preparing transmission electron microscopy (TEM) samples to visualize NP core size and morphology. |
Technical Support Center
Troubleshooting Guides & FAQs
Q1: My hydrophobic nanoparticles aggregate rapidly in physiological buffer. How can I improve colloidal stability without completely masking surface hydrophobicity? A: This is a common issue where the desired hydrophobic patches drive aggregation. Implement a graded stabilization protocol:
- Immediate Fix: Introduce a low-concentration (0.1-0.5% w/v) amphiphilic stabilizer (e.g., Poloxamer 188, TPGS) during the final purification step. This provides a temporary steric shield.
- Optimization: Systematically vary the molar ratio of your hydrophobic core-forming polymer (e.g., PLA, PLGA) to your amphiphilic stabilizer (e.g., PEG-PLA, DSPE-PEG). Use Dynamic Light Scattering (DLS) to monitor the Hydrodynamic Diameter (HD) and Polydispersity Index (PDI).
- Analysis: Assess the "residual hydrophobicity" using a hydrophobic interaction chromatography (HIC) column or a fluorescent solvatochromic dye (e.g., Nile Red) assay. Aim for a balance where nanoparticles remain stable (>1 hour in PBS) but show increased Nile Red fluorescence intensity compared to fully PEGylated controls.
Q2: My in vitro uptake assay shows poor cellular internalization despite designed targeting ligands. Could excessive surface PEGylation be the cause? A: Yes, this is the classic "PEG dilemma." Excessive PEG density creates a steric barrier that shields both hydrophobic interactions and ligand-receptor binding.
- Diagnostic Test: Perform a comparative uptake assay with the same nanoparticle batch, but with a post-insertion method for the targeting ligand versus a pre-conjugated one. Also, test uptake in the presence and absence of serum proteins.
- Solution: Reduce PEG grafting density. Use a mixed-layer approach with a shorter-chain PEG (e.g., PEG1000) or a cleavable PEG linker (e.g., pH-sensitive or matrix metalloproteinase-sensitive). This allows the hydrophobic patches or ligands to be exposed in the target microenvironment.
Q3: How do I quantitatively measure the "stealth effect" versus "uptake efficiency" in vivo? A: This requires a dual-parameter experimental design.
- Protocol for Circulation Half-life (Stealth):
- Label: Incorporate a near-infrared fluorescent dye (e.g., DiR) or a radioisotope (e.g., ^89Zr) into the nanoparticle core.
- Administer: Inject intravenously into animal models (e.g., mice).
- Measure: Use blood collection at serial time points (e.g., 5 min, 30 min, 2h, 8h, 24h) followed by fluorescence/radioactivity measurement. Fit data to a two-compartment model.
- Key Metric: Calculate the area under the curve (AUC) for blood concentration over time.
- Protocol for Target Site Accumulation (Uptake/Efficacy):
- Label: Use a different, spectrally distinct label (e.g., ^111In for SPECT or a fluorescent dye like Cy5.5) on the nanoparticle surface or cargo.
- Measure: At terminal time points (e.g., 24h and 72h), excise target organs (tumor, liver, spleen, etc.) and quantify the signal per gram of tissue.
- Key Metric: Calculate the Target-to-Background Ratio (TBR) or % Injected Dose per Gram (%ID/g).
Table 1: Quantitative Impact of Hydrophobicity Modifications on Key Pharmacokinetic Parameters
| Nanoparticle Formulation | PEG Density (chains/nm²) | Log P (Core Polymer) | Circulation t½ (h) | Liver Uptake (%ID/g at 24h) | Tumor Uptake (%ID/g at 24h) |
|---|---|---|---|---|---|
| High Hydrophobic (PLA) | 0.1 | 1.5 | 0.5 ± 0.2 | 45 ± 5 | 1.2 ± 0.3 |
| PEG Shielded (PLA-PEG5k) | 0.8 | 1.5 | 12.5 ± 2.1 | 8 ± 2 | 3.5 ± 0.8 |
| Balanced Mix (PLA/PLA-PEG2k) | 0.3 | 1.5 | 4.2 ± 0.7 | 22 ± 4 | 6.8 ± 1.5 |
| Cleavable PEG Shield | 0.6 (pre-cleavage) | 1.5 | 10.1 ± 1.8 | 10 ± 2 | 12.4 ± 2.2 |
Q4: What are the best methods to characterize surface hydrophobicity experimentally? A: Use a combination of techniques:
- Fluorescent Probe Assay (Nile Red):
- Prepare a 1 mM stock of Nile Red in acetone.
- Incubate nanoparticle suspension with Nile Red (final conc. ~1 µM) for 30 min in the dark.
- Measure fluorescence emission spectrum (λex ~550 nm, λem 570-700 nm). A red-shift and intensity increase correlate with higher hydrophobicity.
- Hydrophobic Interaction Chromatography (HIC):
- Use a HIC column (e.g., Phenyl Sepharose).
- Elute with a decreasing salt gradient (e.g., 1.5M to 0M ammonium sulfate).
- Hydrophobic nanoparticles elute later (at lower salt concentrations). Compare elution times.
- Contact Angle Measurement:
- Create a dense film of nanoparticles on a filter membrane.
- Measure the water contact angle using a goniometer. Higher angles indicate greater surface hydrophobicity.
Q5: Are there computational tools to predict the optimal hydrophobicity balance before synthesis? A: Yes, in silico modeling can guide design.
- Tools: Use molecular dynamics (MD) simulation software (GROMACS, NAMD) or coarse-grained modeling (Martini force field).
- Protocol:
- Model the nanoparticle core and surface ligands (PEG, targeting peptides) in an explicit water/salt environment.
- Simulate the interaction with lipid bilayers (mimicking cell membranes) and serum proteins (e.g., albumin, apolipoproteins).
- Key Outputs: Calculate binding energies, PEG chain conformation, and protein corona composition to predict circulation and uptake behavior.
The Scientist's Toolkit: Research Reagent Solutions
| Item | Function & Rationale |
|---|---|
| DSPE-PEG (various MWs) | The gold-standard amphiphile for nanoparticle coating. DSPE anchors into hydrophobic cores/patches, while the PEG chain provides a hydrophilic stealth corona. Varying PEG MW (1k-5k) controls corona thickness. |
| Poloxamers (e.g., 188, 407) | Triblock copolymer surfactants (PEO-PPO-PEO). Used for rapid stabilization and to study the effect of short, dynamic hydrophobic (PPO) blocks on protein adsorption and cell interaction. |
| Nile Red | Solvatochromic fluorescent dye. Its emission spectrum shifts dramatically based on local polarity. Essential for quantifying the hydrophobicity of the nanoparticle core or surface microenvironment. |
| Fluorescently-labeled Albumin (e.g., FITC-BSA) | Used in competitive binding assays to study protein corona formation. Pre-incubation with FITC-BSA can identify formulations that preferentially adsorb this protein, which may promote longer circulation. |
| PLGA/PLA with terminal functional groups (COOH, NH₂) | Core polymers enabling controlled hydrophobicity (via lactide:glycolide ratio) and providing anchoring points for post-conjugation of PEG or ligands, allowing precise surface engineering. |
| pH- or Enzyme-Cleavable PEG Linkers (e.g., hydrazone, MMP-sensitive peptide linkers) | Critical for designing "smart" nanoparticles. They maintain stealth during circulation but shed the PEG layer upon reaching the target site (low pH, high enzyme activity), exposing hydrophobic patches/ligands for uptake. |
Visualizations
Diagram 1: Hydrophobicity Balance in Nanoparticle Design
Diagram 2: Key Experiments to Test Balance
Diagram 3: PEG Dilemma Signaling Pathway
Technical Support & Troubleshooting Center
This center addresses common experimental challenges in characterizing nanoparticle (NP) surface properties for drug delivery research, framed within the thesis of optimizing hydrophobicity for balancing circulation time and active targeting.
Troubleshooting Guides
Issue 1: Inconsistent ζ-Potential Measurements in Biological Buffers
- Problem: High variability in ζ-potential readings when measuring NPs in phosphate-buffered saline (PBS) or cell culture media.
- Root Cause: High ionic strength compresses the electrical double layer, reducing measurement sensitivity and precision. Protein adsorption can also mask the surface charge.
- Solution: Dilute the sample with low-conductivity buffer (e.g., 1 mM KCl) or deionized water to a conductivity of < 2 mS/cm. Note and report the dilution factor. For protein-containing media, consider a gentle wash step with milli-Q water (via centrifugal filtration) before dilution, acknowledging this may alter the protein corona.
- Protocol: Standardized Dilution Protocol for High-Ionic-Strength Samples:
- Take 100 µL of your NP suspension.
- Perform three wash cycles with 1 mL of 1 mM KCl (pH adjusted to 7.0±0.2) using centrifugal filtration (appropriate MWCO filter).
- Re-suspend the final pellet in 1 mL of 1 mM KCl.
- Measure ζ-potential at 25°C using a disposable folded capillary cell. Perform at least 3 runs of >15 sub-runs each.
- Report the medium conductivity alongside the ζ-potential value.
Issue 2: Discrepancy Between Surface Energy Calculated from Different Contact Angle Liquids
- Problem: Calculating surface energy components (e.g., using Owens-Wendt method) yields different results based on the choice of probe liquids.
- Root Cause: The two-liquid model assumes specific interactions. Using liquids with strong acid/base components or high polarity on a complex NP-coated surface can lead to inconsistent data.
- Solution: Use a standard set of at least three pure, well-characterized liquids with known dispersive and polar components. Common pairs are water, diiodomethane, and ethylene glycol. Ensure the coated surface is smooth, homogeneous, and thick enough to prevent substrate interference.
- Protocol: Reliable Contact Angle Measurement for NP Films:
- Prepare a smooth, uniform film of your NPs on a clean glass slide via spin-coating or drop-casting with controlled drying.
- Using a sessile drop tensiometer, place a 2-5 µL droplet of each probe liquid.
- Capture the image within 2 seconds of contact to avoid evaporation artifacts.
- Measure the left and right contact angles for at least 5 droplets per liquid.
- Use the average values in the Owens-Wendt (or van Oss) model equations. Always report the set of liquids used.
Issue 3: NP Aggregation During Surface Energy or ζ-Potential Analysis
- Problem: Particles aggregate during sample preparation or measurement, skewing results.
- Root Cause: Sample concentration may be too high. Measurement processes (e.g., capillary filling, electric field in ζ-potential) can induce aggregation.
- Solution: Optimize NP concentration (typically 0.01-0.1 mg/mL for ζ-potential). For ζ-potential, verify measurement voltage is within instrument guidelines. For contact angle, ensure the NP film is fully dried and stable.
- Protocol: Aggregation Check via DLS Correlation Function:
- Prior to ζ-potential measurement, always run a Dynamic Light Scattering (DLS) size measurement on the same sample.
- Inspect the correlation function decay. A smooth, single decay indicates a stable, monodisperse sample.
- If the correlation function is erratic or shows multiple decays, dilute the sample further or consider adding a mild, non-ionic surfactant (e.g., 0.01% Tween 80) and re-measure. Report any use of dispersants.
Frequently Asked Questions (FAQs)
Q1: Which is more critical for predicting nanoparticle blood circulation time: ζ-potential or surface energy? A: Both are interconnected, but for in vivo circulation, the ζ-potential in biologically relevant media (forming a protein corona) is often a more direct predictor. A slightly negative ζ-potential (e.g., -10 to -30 mV) in serum-containing media typically correlates with reduced non-specific cellular uptake and longer circulation. Surface energy (particularly the polar component) is crucial for understanding the driving force behind protein adsorption and corona formation, which then dictates the measured ζ-potential in situ.
Q2: How can I correlate surface energy with targeting ligand density on my NPs? A: Surface energy analysis via contact angle can detect changes upon ligand conjugation. A successful conjugation often changes the polar component of surface energy. Create a calibration series by systematically varying ligand density during synthesis. For each batch, measure: 1. Ligand density (via colorimetric assay, NMR, or spectroscopy). 2. Contact angles with 3 liquids and calculate surface energy components. 3. Plot ligand density vs. the polar component. This correlation can then be used as a quick, indirect QC tool for future batches.
Q3: My ζ-potential is highly negative, but my NPs still aggregate in serum. Why? A: High negative ζ-potential indicates good electrostatic stabilization in buffer. In serum, proteins adsorb and can cause "bridging flocculation" if they interact with multiple NPs, or change the steric stabilization profile. Measure ζ-potential after incubating NPs in 50% serum for 1 hour (and subsequent dilution in 1 mM KCl) to see the "biological" surface charge. Consider incorporating a stealth coating (like PEG) to provide steric stabilization that works in conjunction with charge.
Q4: What is a "good" surface energy value for balancing circulation and targeting? A: There is no universal number, as it depends on the core material and targeting moiety. Within a single nanoparticle platform, aim for a medium surface energy (e.g., total surface energy ~40-50 mJ/m²). A very high surface energy (>60 mJ/m²) often indicates a highly polar, hydrophilic surface that may resist protein adsorption too effectively, potentially hindering targeting. A very low surface energy (<30 mJ/m²) indicates high hydrophobicity, driving rapid, non-specific protein adsorption and clearance. Optimize by testing a range of surface modifications.
Table 1: Typical ζ-Potential Ranges and Implications for NP Behavior
| ζ-Potential Range (in buffer, mV) | Colloidal Stability | Expected in vivo Behavior (Pre-Corona) |
|---|---|---|
| +30 to +10 | Moderate to Poor | Rapid clearance, potential toxicity |
| +10 to -10 | Unstable (Aggregation Likely) | Very rapid aggregation and clearance |
| -10 to -20 | Short-term Stable | Moderate opsonization, shorter circulation |
| -20 to -30 | Good Stability | Lower opsonization, longer circulation |
| < -30 | Excellent Stability | Long circulation, but may hinder cellular uptake |
Table 2: Surface Energy Components of Common Coating Materials
| Coating Material | Total Surface Energy (γ, mJ/m²) | Dispersive Component (γ^d) | Polar Component (γ^p) |
|---|---|---|---|
| Polystyrene | 40.7 | 40.7 | ~0 |
| Poly(lactic-co-glycolic acid) (PLGA) | 44.9 | 40.9 | 4.0 |
| Polyethylene Glycol (PEG) | 43.0 | 30.9 | 12.1 |
| Chitosan | 45.0 - 55.0 | ~35.0 | 10.0 - 20.0 |
| Gold (clean surface) | >1000 | High | Very High |
Experimental Protocols
Protocol: Determining Surface Energy via the Owens-Wendt Method
- Substrate Preparation: Create a smooth, dense film of your nanoparticles on a clean silicon wafer or glass slide using spin-coating (e.g., 3000 rpm for 30 seconds).
- Contact Angle Measurement: Using an automated goniometer, dispense 2 µL droplets of ultra-pure water, diiodomethane, and ethylene glycol.
- Data Acquisition: Capture the sessile drop image at 1-second post-dispensation. Measure left and right angles using Young-Laplace fitting. Repeat for 5 droplets per liquid.
- Calculation: Use the averaged contact angle (θ) for each liquid. Solve the simultaneous equations from the Owens-Wendt model: [ γl (1 + cosθ) = 2( (γs^d γl^d)^{0.5} + (γs^p γl^p)^{0.5} ) ] where (γl), (γl^d), (γl^p) are known liquid parameters. Solve for (γs^d) and (γs^p), the dispersive and polar components of the solid (NP film) surface energy. Total (γs = γs^d + γ_s^p).
Protocol: Measuring ζ-Potential via Phase Analysis Light Scattering (PALS)
- Sample Preparation: Dilute NP suspension to 0.05-0.1 mg/mL in 1 mM KCl (or appropriate low-conductivity buffer, pH 7.4). Filter through a 0.22 µm syringe filter if necessary.
- Cell Loading: Rinse a disposable folded capillary cell twice with the dilution buffer. Load ~1 mL of sample, avoiding bubbles.
- Instrument Setup: Insert cell into the chamber at 25°C. Set measurement parameters: dispersant RI = 1.33, viscosity = 0.887 cP, dispersant dielectric constant = 78.5.
- Measurement: Set voltage to instrument-recommended level (typically 50-150 V). Perform at least 3 measurement runs of >15 sub-runs each.
- Data Analysis: Use the Smoluchowski model if κa > 1 (high ionic strength) or Hückel model if κa < 1 (low ionic strength), where κ is Debye length and a is particle radius. Report the mean and standard deviation of the ζ-potential from all runs.
Visualizations
Diagram Title: Relationship Between Surface Parameters and NP Biological Fate
Diagram Title: Integrated Workflow for Surface Characterization
The Scientist's Toolkit: Essential Research Reagents & Materials
Table 3: Key Reagent Solutions for Surface Characterization Experiments
| Item | Function/Description | Key Consideration for Use |
|---|---|---|
| 1 mM Potassium Chloride (KCl) | Low-conductivity aqueous medium for reliable ζ-potential measurement. | Adjust to physiological pH (7.4) with KOH/HCl. Always filter (0.22 µm) before use. |
| Ultra-pure Water (≥18.2 MΩ·cm) | Primary liquid for contact angle; solvent for dilutions. | Use fresh from purification system to minimize surface-active contaminants. |
| Diiodomethane (DIM) | High-surface-tension, non-polar probe liquid for surface energy calculation. | Store in dark, glass container. Highly volatile and toxic; use in fume hood. |
| Ethylene Glycol | Polar probe liquid for surface energy calculation. | Hygroscopic; use anhydrous grade and store sealed. |
| PEGylated Silane/Au Thiols | Model reagents for creating controlled hydrophobic/hydrophilic surfaces on substrates (wafers, slides). | Use to create calibration surfaces to validate your measurement system. |
| Disposable Zeta Cells (Folded Capillary) | Sample holders for ζ-potential measurement, prevent cross-contamination. | Check material compatibility with organic solvents if used. |
| Anopore/Alumina Membranes | For preparing smooth NP films via filtration for contact angle. | Pore size should be significantly smaller than NP diameter. |
| Certified Nanoparticle Standards (e.g., -50 mV Polystyrene) | Essential for daily validation and calibration of both DLS and ζ-potential instruments. | Follow supplier's storage and handling instructions precisely. |
Engineering the Interface: Practical Strategies for Surface Modification and Characterization
Troubleshooting Guides & FAQs
PEGylation
Q1: After PEGylation, my nanoparticles show increased aggregation instead of improved stability. What went wrong? A: This is often due to incomplete surface coverage or poor conjugation chemistry.
- Check: Ensure a sufficient molar excess of PEG reagent (typically 2-5x) relative to available surface functional groups. Verify the coupling reaction pH and temperature are optimal for the specific chemistry (e.g., NHS ester reactions perform best at pH 7.5-8.5).
- Solution: Purify nanoparticles via size-exclusion chromatography post-PEGylation to remove unreacted PEG and aggregates. Characterize surface charge (zeta potential) – successful PEGylation often reduces the absolute zeta potential value.
Q2: How can I quantify the density of PEG on my nanoparticle surface? A: Use a combination of indirect methods.
- Protocol: Perform a colorimetric assay (e.g., iodine assay for mPEG, barium iodide method for PEG-diols) on purified nanoparticles against a PEG standard curve. Complement with TGA (Thermogravimetric Analysis) to measure weight loss attributable to PEG decomposition. Calculate grafting density using nanoparticle core size (from TEM/DLS) and PEG molecular weight.
Table 1: Common PEGylation Issues & Solutions
| Issue | Possible Cause | Diagnostic Test | Solution |
|---|---|---|---|
| Low Coupling Yield | Inactive PEG reagent, wrong buffer | H-NMR of PEG reagent, Ellman's test for thiols | Use fresh reagents, employ carbonate/bicarbonate buffer for NHS chemistry |
| Batch Variability | Inconsistent nanoparticle surface prep | DLS & Zeta potential pre-coating | Standardize core NP synthesis; implement rigorous purification before coating |
| Accelerated Blood Clearance (ABC) | High PEG density, immunogenicity | In vivo pharmacokinetics in rodent models | Use lower MW PEG (<5kDa), consider alternative hydrophilic polymers |
Lipid Bilayers
Q3: My lipid coating is unstable and sheds from the nanoparticle core during dialysis or filtration. How can I improve adhesion? A: This indicates weak interaction between the lipid bilayer and the core.
- Solution: Incorporate lipids with terminal anchoring groups (e.g., DSPE-PEG, which has a lipid anchor and PEG chain) or use charged lipids that electrostatically bind to an oppositely charged core. Increase hydrophobic interaction by using lipids with longer acyl chains (e.g., C18 vs C14).
Q4: How do I control the number of lipid layers around the core? A: The preparation method is key.
- Protocol (for a single bilayer): Use the thin-film hydration & extrusion method. Dissolve lipids in chloroform, evaporate to form a thin film. Hydrate with buffer containing your pre-formed nanoparticles above the lipid transition temperature (Tm). Subject to sequential extrusion through polycarbonate membranes (e.g., 200nm, then 100nm). Asymmetric Flow Field-Flow Fractionation (AF4) can separate particles by number of lipid layers.
Hydrophilic Polymers (Poloxamers, PEI-PEG)
Q5: When using Poloxamer 407 for coating, I observe only marginal improvement in circulation half-life. Why? A: Poloxamers adsorb via their hydrophobic PPO block; weak adsorption leads to desorption in vivo.
- Check: Confirm you are incubating nanoparticles with the poloxamer at or above its critical micelle temperature (CMT). Use a concentration above its CMC.
- Solution: Consider "anchoring" by chemically conjugating the poloxamer to the nanoparticle surface, or use a poloxamer with a longer PPO block (e.g., Poloxamer 338 vs 407) for stronger hydrophobic interaction.
Q6: For PEI-PEG copolymers, how do I balance stealth (PEG) with subsequent functionalization (reactive PEI amines)? A: This is a core design challenge for targeting.
- Protocol: Synthesize or source PEI-PEG with controlled grafting ratios (e.g., 5-10 PEG chains per PEI molecule). After coating, quantify remaining free amines using a fluorometric assay (e.g., fluorescamine). Reserve a defined percentage of amines (e.g., 10-20%) for post-coating conjugation of targeting ligands. Block remaining amines with small molecules like acetic anhydride.
Table 2: Comparison of Coating Performance Metrics
| Coating Strategy | Typical Hydrodynamic Size Increase (nm) | Zeta Potential Shift | Typical Circulation Half-life (Rodent) | Key Limitation |
|---|---|---|---|---|
| PEGylation (Dense Brush) | +5 to +15 | Shift towards neutral (~ -10 to +10 mV) | 12 - 24 hours | Potential ABC phenomenon |
| Lipid Bilayer | +20 to +30 | Assumes bilayer charge (e.g., ~ -50 mV for DOPG) | 6 - 18 hours | Stability & fusion risks |
| Poloxamer Adsorption | +5 to +10 | Minimal change | 2 - 8 hours | Dynamic desorption |
| PEI-PEG Copolymer | +10 to +20 | Shift from highly positive (>+30) to less positive (~ +5 to +15 mV) | 4 - 12 hours | Toxicity concerns from residual PEI |
Experimental Protocols
Protocol 1: Standard mPEG-NHS Covalent Conjugation to Amine-Functionalized Nanoparticles
- Materials: 10 mg of amine-coated nanoparticles (e.g., PLGA-NH2), mPEG-NHS (MW 2000 Da), 0.1M Sodium Borate Buffer (pH 8.5), Zeba Spin Desalting Columns (7K MWCO).
- Procedure: Dissolve nanoparticles in 1 mL borate buffer. Add mPEG-NHS in 5x molar excess to surface amines. React for 4 hours at room temperature with gentle stirring. Purify the conjugate by passing through a pre-equilibrated desalting column via centrifugation (1500 x g, 2 min). Wash twice with PBS (pH 7.4). Characterize by DLS and zeta potential.
Protocol 2: Forming a Supported Lipid Bilayer (SLB) on Silica Nanoparticles
- Materials: 100 nm silica nanoparticles, DOPC, cholesterol, DSPE-PEG(2000), chloroform, PBS, 0.1 μm polycarbonate membrane extruder.
- Procedure: Mix lipids (70:25:5 mol% DOPC:Cholesterol:DSPE-PEG) in chloroform. Dry under nitrogen to form a thin film, then desiccate overnight. Hydrate lipid film with PBS containing 1 mg/mL silica nanoparticles to a final lipid concentration of 1 mM. Sonicate in a bath sonicator for 30 min above Tm. Extrude the mixture 21 times through a 0.1 μm membrane at 55°C. Separate unbound lipids via ultracentrifugation (100,000 x g, 45 min).
Diagrams
Title: Coating Strategies for Stealth & Targeting
Title: Core Coating Workflow
The Scientist's Toolkit: Research Reagent Solutions
| Item | Function & Rationale |
|---|---|
| mPEG-NHS Ester (MW 2k-5k Da) | Gold standard for covalent "stealth" coating. NHS ester reacts with surface amines (-NH2) to form stable amide bonds. |
| DSPE-PEG(2000) | Amphiphilic lipid-PEG conjugate. The DSPE (lipid) anchors into hydrophobic cores or lipid bilayers, while PEG extends for stealth. |
| Poloxamer 407 (Pluronic F127) | Triblock copolymer (PEO-PPO-PEO). PPO block adsorbs to hydrophobic surfaces, PEO blocks confer hydrophilicity and steric stabilization. |
| Cholesterol | Incorporated into lipid coatings to enhance bilayer stability and rigidity, reducing premature disintegration. |
| Zeba Spin Desalting Columns | Rapid, size-based purification of coated nanoparticles from unreacted small molecules (e.g., free PEG, quenching agents). |
| DOPC (1,2-dioleoyl-sn-glycero-3-phosphocholine) | A commonly used, neutral, and fluid-phase phospholipid for forming consistent, well-characterized lipid bilayers. |
| Polycarbonate Membrane Extruder | Essential for achieving monodisperse, unilamellar lipid-coated nanoparticles by mechanical sizing through defined pores. |
| Fluorescamine | Fluorogenic dye used to quantify free primary amines on nanoparticle surfaces post-coating, crucial for assessing coupling efficiency. |
Technical Support Center: Troubleshooting & FAQs
FAQ 1: Synthesis & Characterization Q1: My zwitterionic polymer coating shows inconsistent thickness and high polydispersity after grafting-from synthesis. What could be wrong? A: This is typically due to uncontrolled polymerization or inadequate monomer purification.
- Troubleshooting Guide:
- Oxygen Inhibition: Ensure rigorous degassing of all monomer and solvent solutions via at least 3 freeze-pump-thaw cycles or sparging with inert gas (N2/Ar) for >30 minutes.
- Catalyst/Initiator Activity: Test your initiator system (e.g., ATRP catalyst) independently on a small scale. For ATRP, check Cu(I)/Cu(II) ratio via UV-Vis; a significant 465 nm peak indicates Cu(II) buildup, requiring more reducing agent.
- Monomer Purity: Pass liquid monomers through a basic alumina column to remove inhibitors immediately before use. Confirm purity by NMR.
- Protocol: Consistent Zwitterionic Coating via ATRP.
- Substrate Prep: Clean gold/silica nanoparticles (NPs) with piranha solution (3:1 H2SO4:30% H2O2). CAUTION: Highly exothermic. Rinse with copious deionized water. Immerse in initiator solution (e.g., 2 mM ethanolic solution of cysteamine-based ATRP initiator) for 24h.
- Polymerization: In a schlenk flask, add purified zwitterionic monomer (e.g., carboxybetaine methacrylate, 2M), CuBr (10 mM), and Me6TREN ligand (12 mM) in methanol/water (3:1). Degas. Add initiator-functionalized NPs under N2. React at 25°C for 1-4h.
- Purification: Centrifuge and wash NPs 3x in 1M NaCl solution (to disrupt charge aggregates), then 3x in DI water. Characterize by DLS (PDI target <0.15) and XPS (check for consistent N/C ratio).
Q2: My biomimetic "cell membrane cloak" has low grafting density and poor colloidal stability in serum. A: Low grafting density often stems from suboptimal vesicle fusion or improper membrane source preparation.
- Troubleshooting Guide:
- Membrane Vesicle Quality: Use fresh cells (e.g., RBCs, platelets). After hypotonic lysis and centrifugation, perform a sucrose gradient (30%/40%/50%) to isolate pure plasma membrane fragments. Check via TEM and confirm protein markers (e.g., CD47 for RBCs) by Western blot.
- Fusion Efficiency: The core nanoparticle surface must be hydrophilic. For polymeric NPs, pre-coat with a thin PEG layer (MW 2kDa) to provide a hydration layer for vesicle fusion. Monitor fusion in real-time via QCM-D; a frequency drop (ΔF) > -25 Hz and dissipation change (ΔD) > 2e-6 indicate successful bilayer formation.
- Serum Stability Test: Incubate coated NPs in 100% FBS at 37°C for 1h. Run on agarose gel (1%). A single, sharp band indicates stability; smearing indicates protein adsorption and aggregation.
Q3: My targeting peptide ligand loses binding affinity when conjugated after applying a stealth layer. A: This is a classic "buried ligand" issue. The stealth layer may be too thick or dense, sterically blocking the ligand.
- Troubleshooting Guide:
- Conjugation Order: Use a post-insertion method. First, conjugate the targeting peptide to a lipid-PEG (e.g., DSPE-PEG(2000)-Maleimide). Purify. Then, incubate this conjugate with pre-formed, stealth-coated NPs (e.g., zwitterionic or biomimetic) at 50°C for 1h. The lipid will insert into the hydrophobic core or bilayer.
- Spacer Length: Ensure the peptide is presented on a PEG spacer (MW 3.4kDa) longer than the stealth layer's brush height. Calculate approximate brush height (h) from DLS data.
- Quantify Accessibility: Use a fluorescence quenching assay. If the peptide has a tag, measure accessibility to a soluble quencher (e.g., iodide) before and after stealth coating.
Data Presentation: Performance Comparison of Stealth Alternatives Table 1: In Vivo Performance Metrics of Coated 100 nm Nanoparticles (Single IV Dose, Murine Model)
| Coating Type | Hydrodynamic Diameter Increase (nm) | Zeta Potential (mV) | Plasma Half-life (t1/2, h) | % Injected Dose in Liver (at 1h) | Key Challenge (from thesis context) |
|---|---|---|---|---|---|
| PEG (2kDa) | 12 ± 2 | -5.2 ± 1.1 | 8.5 ± 1.2 | 35 ± 8 | Anti-PEG immunity, ABC phenomenon |
| Zwitterionic (PCB) | 15 ± 3 | 0.5 ± 1.5 | 16.3 ± 2.4 | 18 ± 5 | Complex synthesis, batch variation |
| RBC Membrane | 20 ± 5 (bilayer) | -22 ± 3 (native) | 39.7 ± 5.1 | 9 ± 3 | Scalable production, vesicle fusion |
| Peptide-based (EKE) | 8 ± 1 | -10.5 ± 2.0 | 12.1 ± 1.8 | 27 ± 6 | Proteolytic stability in vivo |
Table 2: Key Research Reagent Solutions & Materials
| Item Name / Reagent | Function & Critical Note |
|---|---|
| Carboxybetaine Methacrylate (CBMA) | Zwitterionic monomer. Store at -20°C with desiccant. Inhibited by oxygen. |
| Me6TREN Ligand | ATRP ligand for Cu-based polymerization. Enhances rate & control. Highly hygroscopic. |
| DSPE-PEG(2000)-Maleimide | Heterobifunctional linker for post-insertion ligand conjugation. Critical for ligand presentation. |
| Sucrose Gradient Solutions (30%, 40%, 50%) | For purifying cell membrane vesicles after lysis. Must be prepared in ultra-pure, pyrogen-free water. |
| Quencher Solution (Potassium Iodide, 4M) | For fluorescence accessibility assays. Contains Na2S2O3 to prevent I3- formation. |
| Size Exclusion Columns (Sepharose CL-4B) | For final purification of coated NPs from unbound polymers/peptides. Maintain at 4°C. |
Experimental Protocols
Protocol: Peptide-Based Stealth Layer Formation via Charge-Driven Assembly. Objective: Apply an electrostatically adsorbed, protease-resistant stealth peptide (e.g., EKEKEKE) to a charged NP core.
- NP Core Preparation: Synthesize citrate-capped 50 nm gold NPs. Adjust pH to 7.4. Zeta potential should be ≈ -40 mV.
- Peptide Solution: Dissolve EKEKEKE peptide in 10 mM HEPES buffer (pH 7.4) to 1 mg/mL. Filter sterilize (0.22 µm).
- Assembly: Under vigorous vortexing, add peptide solution dropwise to an equal volume of NP solution. Incubate 15 min.
- Purification: Centrifuge at 14,000 rpm for 20 min. Carefully discard supernatant. Resuspend pellet in HEPES buffer. Repeat 2x.
- Verification: Measure zeta potential shift to near-neutral (≈ -10 mV). Use fluorescence if tagged peptide is used to calculate grafting density.
Protocol: Evaluating Targeting Efficacy Post-Stealth Coating (Flow Chamber Assay). Objective: Quantify NP binding to target cells under physiological shear stress.
- Surface Coating: Coat a microfluidic channel with recombinant human ICAM-1 or other target protein (10 µg/mL, 2h).
- NP Preparation: Prepare fluorescently labeled NPs with: a) No stealth, b) Stealth only, c) Stealth + targeting ligand.
- Perfusion: Perfuse NP solution (0.1 mg/mL in PBS+1% BSA) through chamber at 1 dyn/cm² shear stress for 10 min.
- Wash & Image: Perfuse with buffer at 4 dyn/cm² for 5 min. Image retained fluorescence at 5 fixed positions.
- Analysis: Calculate mean fluorescence intensity/area. Targeting efficacy = (Group c - Group b) / (Group a - Group b). Target >70%.
Visualizations
Title: Balancing Nanoparticle Hydrophobicity: Core Thesis Challenge
Title: Decision Workflow for Selecting a Stealth Coating
Title: Anti-PEG ABC Phenomenon Signaling Pathway
Troubleshooting Guides & FAQs
FAQ 1: Inconsistent Water Contact Angle (WCA) Measurements on Nanoparticle Films
- Q: My WCA measurements on spin-coated nanoparticle films show high variability (>5° difference) between spots on the same sample. What could be causing this?
- A: This is often due to film heterogeneity. Ensure your spin-coating protocol produces uniform, smooth films. Use a consistent droplet volume (typically 2-4 µL) and a controlled environment (humidity <50%). Clean the substrate thoroughly (e.g., plasma treatment) before coating. Measure at least 5 droplets on different spots and report the average ± standard deviation.
FAQ 2: Low or No Signal in Nile Red Assay
- Q: I am using Nile Red fluorescence to assess nanoparticle hydrophobicity, but the signal is very weak, even for supposedly hydrophobic particles.
- A: First, confirm the Nile Red stock solution concentration (typically 1 mM in acetone) and storage conditions (dark, -20°C). Ensure the dye is adequately partitioning into the nanoparticles by allowing sufficient incubation time (30-60 min) with gentle agitation. Check the emission wavelength; for very hydrophobic cores, the emission maximum can shift to ~630 nm. Also, verify that your nanoparticle concentration is high enough to provide sufficient binding sites for the dye.
FAQ 3: High Background in Hydrophobic Interplay (HINT) Assay
- Q: My HINT assay, which uses the fluorescence quenching of pyrene, shows high background fluorescence, obscuring the critical micelle concentration (CMC) point.
- A: High background can stem from fluorescent impurities. Purify all solvents (THF, water) and use high-purity pyrene. Ensure all glassware is meticulously cleaned. Perform a control measurement with pyrene in water without nanoparticles to establish a baseline. The key signal is the ratio of the first (I1, ~373 nm) to third (I3, ~384 nm) vibrational peaks; plot I1/I3 vs. log(concentration) to clearly identify the CMC transition.
FAQ 4: Dynamic Light Scattering (DLS) Size Increase Post-Hydrophobicity Measurement
- Q: After performing a hydrophobic probe assay (e.g., with BODIPY derivatives), my nanoparticles show a significant increase in DLS hydrodynamic diameter, suggesting aggregation.
- A: The organic fluorophores can destabilize nanoparticle suspensions, especially if added from a concentrated organic solvent stock. Always add the minimal volume of probe stock (≤ 10 µL per 1 mL of nanoparticle suspension) and consider using a syringe pump for slow, controlled addition. After assay, purify nanoparticles via size-exclusion chromatography (SEC) or dialysis to remove unbound dye and re-measure DLS.
Experimental Protocols
Protocol 1: Static Water Contact Angle Measurement on Nanoparticle Films
- Substrate Preparation: Clean a silicon wafer or glass slide via oxygen plasma treatment for 5 minutes.
- Film Fabrication: Deposit 100 µL of concentrated nanoparticle suspension (5 mg/mL in volatile solvent like ethanol) onto the substrate. Spin-coat at 2000 rpm for 60 seconds.
- Measurement: Using a contact angle goniometer, dispense a 3 µL deionized water droplet onto the film. Capture an image within 5 seconds of contact.
- Analysis: Use the instrument’s software to fit the Young-Laplace equation to the droplet profile and calculate the angle. Repeat at 5 different locations.
Protocol 2: Nile Red Fluorescent Probe Assay for Nanoparticle Hydrophobicity
- Stock Solution: Prepare Nile Red at 1 mM in anhydrous acetone. Protect from light.
- Sample Preparation: To 1 mL of nanoparticle suspension (0.1-1 mg/mL in buffer), add 10 µL of Nile Red stock. Vortex briefly.
- Incubation: Incubate the mixture at room temperature in the dark for 45 minutes with gentle shaking.
- Measurement: Transfer to a quartz cuvette. Record fluorescence emission spectrum from 550 nm to 750 nm with excitation at 550 nm. Note the emission maximum (λmax) and intensity.
- Data Interpretation: A blue shift in λmax (e.g., from ~660 nm to ~610 nm) indicates a more hydrophobic microenvironment.
Protocol 3: Determining Hydrophobicity by Pyrene Fluorescence (HINT Assay)
- Pyrene Saturation: Prepare an aqueous pyrene solution by adding excess solid pyrene to deionized water, sonicating for 2 hours, and filtering (0.2 µm) to obtain a saturated solution (~7 µM).
- Titration: Into a series of vials, add 2 mL of the pyrene-saturated solution. To each vial, add increasing volumes of a concentrated nanoparticle stock solution.
- Equilibration: Allow solutions to equilibrate overnight in the dark.
- Spectroscopy: Measure the fluorescence emission spectrum of each sample (excitation at 339 nm). Record the intensity of the first (I1, ~373 nm) and third (I3, ~384 nm) peaks.
- Analysis: Calculate the I1/I3 ratio for each sample. Plot I1/I3 vs. log(Nanoparticle Concentration). The point of inflection indicates the CMC or the onset of hydrophobic domain formation.
Data Tables
Table 1: Comparison of Hydrophobicity Quantification Techniques
| Technique | Measured Parameter | Sample Requirement | Key Advantage | Key Limitation | Approx. Time |
|---|---|---|---|---|---|
| Static Contact Angle | Surface wettability (θ) | Dry, flat film | Direct, quantitative surface measure | Requires solid film, bulk property | 30 min |
| Nile Red Assay | Polarity of microenvironment (λmax shift) | Colloidal suspension | Sensitive to local hydrophobicity | Dye partitioning kinetics can vary | 1-2 hrs |
| Pyrene (HINT) Assay | Critical aggregation concentration (I1/I3 ratio) | Colloidal suspension | Can determine CMC & hydrophobicity scale | Requires pyrene saturation | 12-24 hrs |
| BODIPY-Based Probes | Hydration (τ, fluorescence lifetime) | Colloidal suspension | Lifetime measurement avoids intensity artifacts | Requires advanced instrumentation | 1-2 hrs |
Table 2: Correlation of Hydrophobicity Metrics with Nanoparticle Performance
| Nanoparticle System (PEG-PLGA) | WCA (°) | Nile Red λmax (nm) | In Vivo Circulation t½ (hr) | Cellular Uptake (Relative) |
|---|---|---|---|---|
| Low Hydrophobicity (5% PLA) | 45 ± 3 | 645 ± 5 | 4.2 ± 0.5 | 1.0 (ref) |
| Moderate Hydrophobicity (50% PLA) | 78 ± 2 | 615 ± 3 | 8.5 ± 1.1 | 3.5 ± 0.4 |
| High Hydrophobicity (100% PLA) | 105 ± 4 | 590 ± 2 | 1.8 ± 0.3 | 8.2 ± 1.0 |
Diagrams
Title: Hydrophobicity Measurement Workflow Comparison
Title: Balancing Hydrophobicity for Drug Delivery
The Scientist's Toolkit: Research Reagent Solutions
| Item | Function in Hydrophobicity Assays |
|---|---|
| Nile Red (>95% purity) | Environment-sensitive fluorescent dye. Partitions into hydrophobic domains; emission λmax inversely correlates with local polarity. |
| Pyrene (purified by sublimation) | Hydrocarbon fluorescent probe. The I1/I3 ratio of its emission spectrum reports on the polarity of its microenvironment. |
| Anhydrous Acetone (HPLC grade) | Solvent for preparing stable stock solutions of hydrophobic fluorescent dyes (e.g., Nile Red, BODIPY). |
| BODIPY-C12 or similar | Lipophilic fluorescent dye with long alkyl chain. Used for direct labeling of hydrophobic cores or membranes. |
| PBS, pH 7.4 (surfactant-free) | Standard physiological buffer for suspending nanoparticles during probe assays, mimicking biological conditions. |
| Size-Exclusion Chromatography (SEC) Columns (e.g., Sephadex G-25) | For rapid purification of nanoparticle-probe conjugates from unbound dye after incubation, preventing assay interference. |
| Hydrophobic Recovery Test Slides (e.g., OTS-treated glass) | Standardized, reproducible hydrophobic surfaces for calibrating or validating water contact angle measurements. |
| Oxygen Plasma Cleaner | For generating perfectly hydrophilic, clean substrates prior to nanoparticle film deposition for WCA measurements. |
FAQs & Troubleshooting
Q1: During in vitro corona formation, my nanoparticle-protein complexes show excessive aggregation, skewing my size (DLS) and concentration measurements. How can I mitigate this? A: Aggregation often stems from insufficient colloidal stability under physiological conditions.
- Troubleshooting Steps:
- Check Ionic Strength: The salt concentration in your incubation buffer (e.g., PBS) may be too high, screening electrostatic repulsion. Try diluting the buffer or using low-ionic-strength alternatives (e.g., 10 mM HEPES, pH 7.4) while maintaining osmolarity with sucrose.
- Verify pH: Ensure the incubation pH is 7.4. A shift can alter nanoparticle surface charge and protein net charge.
- Optimize Incubation Ratio: A very high protein-to-nanoparticle ratio can lead to bridging flocculation. Perform a dilution series of plasma concentration (e.g., 10%, 25%, 50% v/v in buffer) to find a stable point.
- Protocol: Stability Screening.
- Incubate your nanoparticles with varying concentrations of plasma (1-50% v/v) in triplicate in low-binding tubes.
- Gently rotate at 37°C for 1 hour.
- Visually inspect for precipitate. Measure hydrodynamic diameter (Z-average) and PDI via DLS immediately.
- Select the highest plasma concentration that yields a PDI < 0.2 and minimal size increase from bare nanoparticles for downstream corona isolation.
Q2: When isolating the hard corona via centrifugation/washing, how do I prevent corona stripping or incomplete removal of loosely associated proteins? A: This is a critical balancing act. The goal is to remove unbound/soft-corona proteins without disrupting the hard corona.
- Troubleshooting Guide:
- Symptom: No proteins detected post-wash.
- Cause: Washing force/stringency is too high.
- Fix: Reduce centrifugation speed/duration. Switch to gentler wash buffers (e.g., PBS without surfactants). Decrease the number of wash cycles (start with 2-3).
- Symptom: Dozens to hundreds of proteins identified, similar to pre-wash.
- Cause: Washing is insufficient; soft corona persists.
- Fix: Increase number of washes (e.g., 5-6). Incorporate a mild, non-denaturing surfactant (e.g., 0.005% Tween-20) in wash buffer. Consider using a higher g-force or ultracentrifugation through a dense cushion (e.g., sucrose gradient).
- Symptom: No proteins detected post-wash.
- Protocol: Optimized Hard Corona Isolation via Ultracentrifugation.
- After incubation, layer the nanoparticle-corona complex solution over a 1 mL cushion of 20% (w/v) sucrose in PBS in a 1.5 mL ultracentrifuge tube.
- Centrifuge at 100,000 x g for 45 minutes at 4°C.
- Carefully aspirate the supernatant and sucrose cushion.
- Gently resuspend the pellet in 1 mL of ice-cold PBS. Repeat steps 1-3 for a second wash.
- Resuspend final pellet in 50 µL of PBS or lysis buffer for downstream proteomics.
Q3: My mass spectrometry data shows high batch-to-batch variability in corona composition for the same nanoparticle formulation. What are the key controls? A: Variability often originates from pre-analytical steps.
- Key Controls & Checks:
- Plasma/Serum Source: Use a single, large-pool lot (e.g., commercial human pooled plasma) aliquoted and stored at -80°C. Avoid multiple donors between experiments.
- Incubation Consistency: Use a dedicated thermomixer for consistent temperature (37°C ± 0.5°C) and rotation speed. Pre-warm all buffers and plasma.
- Nanoparticle Characterization: Characterize the core nanoparticle (size, PDI, zeta potential) immediately before each corona experiment. Even slight drifts in synthesis can have major impacts.
- Protein Quantification Normalization: Normalize MS input by nanoparticle surface area or particle number (via NP tracking analysis), not just total protein amount.
Q4: How can I track corona evolution dynamically in situ without isolation steps that might alter composition? A: This requires techniques that probe the corona in its native state.
- Suggested Methodologies:
- In-situ DLS & Electrophoretic Light Scattering (ELS): Monitor hydrodynamic size and zeta potential in real-time after injecting plasma into a nanoparticle cuvette. A sharp size increase followed by stabilization indicates corona formation.
- Bio-Layer Interferometry (BLI): Immobilize nanoparticles on a biosensor tip and dip into plasma. The shift in interference pattern provides real-time, label-free binding kinetics and layer thickness.
- Fluorescence Correlation Spectroscopy (FCS): Use fluorescently labeled nanoparticles or proteins. Changes in diffusion time directly report on the increase in hydrodynamic radius due to corona formation.
Data Presentation: Quantitative Corona Parameters
Table 1: Common Analytical Techniques for Protein Corona Characterization
| Technique | Key Measured Parameter(s) | Typical Time Required | Sample Requirement | Key Limitation |
|---|---|---|---|---|
| Dynamic Light Scattering (DLS) | Hydrodynamic diameter, PDI | 5-10 min/sample | ~50 µL, ~0.1 mg/mL NPs | Low resolution for polydisperse samples |
| SDS-PAGE / Gel Electrophoresis | Protein molecular weight profile | 3-5 hours | Moderate-High (µg of protein) | Low throughput, qualitative |
| LC-MS/MS (Proteomics) | Protein identity, abundance | 1-2 days/sample | Low (ng of protein) | Requires corona isolation, expensive |
| Bio-Layer Interferometry (BLI) | Binding kinetics, layer thickness | 1-2 hours/sample | ~300 µL, various concentrations | NPs must be immobilized |
| Cryo-Electron Microscopy | Direct visual envelope thickness | Days (inc. prep & imaging) | Very Low (µL volume) | Complex sample prep, low throughput |
Table 2: Impact of Common Nanoparticle Properties on Corona Composition (Summarized Findings)
| Nanoparticle Property | Typical Effect on Corona Composition | Consequence for Thesis Context (Balance of Circulation & Targeting) |
|---|---|---|
| Increased Hydrophobicity | Enriches apolipoproteins, complement factors, immunoglobulins. | Promotes rapid clearance by MPS, reducing circulation time. May enhance uptake in liver/spleen. |
| Increased Positive Surface Charge | Enriches proteins with acidic isoelectric points (e.g., albumin). | Can increase non-specific cellular uptake but also toxicity and clearance rate. |
| PEGylation (Dense Brush) | Dramatically reduces total protein adsorption; favors small, soft proteins. | Key for circulation: Prolongs half-life by minimizing opsonization. Can hinder active targeting if not properly engineered. |
| Targeting Ligand (e.g., Antibody) | Alters corona fingerprint; ligand can become partially obscured. | The "corona effect" can significantly reduce targeting ligand accessibility, diminishing its efficacy. |
Experimental Protocols
Protocol 1: Standard In Vitro Protein Corona Formation & Hard Corona Isolation for Proteomics. Objective: To form and isolate the hard protein corona from nanoparticles incubated with human plasma. Materials: Nanoparticle suspension, pooled human platelet-poor plasma, PBS (pH 7.4), 20% sucrose/PBS cushion, low-protein-binding tubes and tips, ultracentrifuge. Steps:
- Incubation: Mix nanoparticles (final concentration 0.1-1 mg/mL) with plasma (final concentration 10-50% v/v in PBS) in a total volume of 1 mL.
- Formation: Incubate the mixture on a rotator at 37°C for 60 minutes.
- Separation: Transfer the mixture to an ultracentrifuge tube layered over 1 mL of 20% sucrose cushion.
- Washing: Centrifuge at 100,000 x g, 4°C for 45 min. Discard supernatant.
- Resuspension: Gently resuspend pellet in 1 mL ice-cold PBS. Repeat centrifugation (100,000 x g, 30 min).
- Collection: Discard supernatant. Resuspend final hard corona-coated nanoparticle pellet in 100 µL PBS. Store at -80°C or process immediately for proteomics.
Protocol 2: Real-Time Monitoring of Corona Evolution via DLS. Objective: To dynamically measure the change in nanoparticle hydrodynamic size upon exposure to plasma. Materials: Zetasizer or equivalent DLS instrument, temperature-controlled cell holder, nanoparticle suspension in PBS, plasma, quartz cuvette. Steps:
- Baseline: Load 1 mL of nanoparticle suspension (0.05 mg/mL) into cuvette. Measure hydrodynamic diameter (3-5 runs) at 37°C. Record as time = 0.
- Injection: Quickly add 10 µL of pre-warmed plasma directly into the cuvette and mix gently by pipetting.
- Kinetic Measurement: Immediately start a time course measurement, taking a DLS reading every 60 seconds for the first 15 minutes, then every 5 minutes for up to 1 hour.
- Analysis: Plot hydrodynamic diameter (Z-average) vs. time. The plateau indicates a relatively stable corona formation.
Mandatory Visualizations
The Scientist's Toolkit: Research Reagent Solutions
Table 3: Essential Materials for Protein Corona Studies
| Item | Function / Rationale | Example Product/Catalog |
|---|---|---|
| Pooled Human Platelet-Poor Plasma | Standardized biological fluid for in vitro incubation; reduces donor variability. | Innovative Research IPLA-N, Sigma H4522. |
| HEPES Buffer (1M, pH 7.4) | Low-ionic-streight buffer for incubation studies; maintains pH without excessive salt. | Thermo Fisher Scientific 15630080. |
| Sucrose (Ultra Pure) | Forms dense cushion for ultracentrifugation; allows cleaner pelleting of NPs. | Alfa Aesar J61338. |
| Low-Protein-Binding Microtubes | Minimizes loss of nanoparticles and proteins to tube walls during processing. | Eppendorf Protein LoBind Tubes. |
| Protease Inhibitor Cocktail (EDTA-free) | Added to plasma/buffers to prevent protein degradation during incubation. | Roche cOmplete, EDTA-free. |
| Size Exclusion Chromatography Columns | Alternative to centrifugation for gentle separation of corona-NPs from unbound protein. | GE Healthcare Illustra NAP-5 Columns. |
| PEG-SH (Thiol-PEG) | Common reagent for modifying gold or other NPs to create a stealth, protein-resistant layer. | Sigma 729108 (5kDa mPEG-SH). |
| BCA or Bradford Protein Assay Kit | For quantifying total protein content in isolated corona samples pre-MS. | Thermo Fisher Pierce BCA Assay Kit. |
Technical Support & Troubleshooting Center
Troubleshooting Guides & FAQs
Q1: Our PLGA nanoparticles show rapid clearance in vivo, despite a PEG coating. What could be the cause? A: Rapid clearance despite PEGylation often indicates incomplete surface coverage or a hydrophobic "footprint" that allows protein adsorption. Measure the nanoparticle's zeta potential before and after PEG conjugation. A shift towards neutral (e.g., from -30 mV to -10 mV) suggests successful coating. If the shift is minimal, optimize your PEG-PLGA conjugation or adsorption protocol. Ensure you are using a PEG chain length (≥ 2 kDa) and density (≥ 10 mol%) sufficient to create a effective hydrophilic brush layer.
Q2: How can I quantitatively compare the hydrophobicity of different lipid nanoparticle (LNP) formulations? A: Use the hydrophobic interaction chromatography (HIC) retention time assay. Pack a column with a hydrophobic resin (e.g., Phenyl Sepharose). Elute nanoparticles with a decreasing salt gradient. More hydrophobic nanoparticles will have longer retention times. See Table 1 for a typical data set.
Q3: Our inorganic (e.g., mesoporous silica) nanoparticles aggregate immediately in biological media. How can we improve stability? A: This is a critical sign of high surface hydrophobicity. Implement a two-step surface modification: 1) Aminosilanization (e.g., with APTES) to introduce amine groups, and 2) Grafting of hydrophilic polymers (e.g., PEG-succinimidyl ester) onto the amine groups. The density of surface amines can be quantified via a colorimetric assay (like ninhydrin) to guide optimization.
Q4: What is the most reliable method to confirm stealth properties and low hydrophobicity before in vivo studies? A: Perform a serum protein adsorption assay. Incubate nanoparticles with 50% FBS at 37°C for 1 hour, separate via centrifugation/ultrafiltration, and analyze the protein corona by SDS-PAGE or a microBCA assay. Lower total protein adsorption correlates with better stealth potential. Complement this with a macrophage uptake assay in vitro using RAW 264.7 cells and flow cytometry.
Q5: When tuning lipid nanoparticle hydrophobicity, how do I balance it with drug loading efficiency? A: This is a key trade-off. Increasing the molar ratio of helper lipids like DSPC (more hydrophilic) over cholesterol (more hydrophobic) can reduce overall hydrophobicity but may decrease loading for hydrophobic drugs. A systematic Design of Experiment (DoE) approach is recommended. See Table 2 for the relationship.
Key Research Reagent Solutions
| Reagent / Material | Primary Function | Key Consideration |
|---|---|---|
| mPEG-PLGA Copolymer | Provides steric stabilization & reduces opsonization. Chain length & % PEG modify hydrophobicity. | PEG MW (2k-5k Da) and grafting density are critical for the "brush" vs "mushroom" regime. |
| 1,2-Distearoyl-sn-glycero-3-phosphocholine (DSPC) | A phospholipid used in LNPs to increase bilayer rigidity and modulate surface hydrophility. | Higher DSPC:Cholesterol ratios generally increase hydrophilic character. |
| (3-Aminopropyl)triethoxysilane (APTES) | A silane coupling agent to introduce amine groups on inorganic NPs for subsequent functionalization. | Reaction must be performed under anhydrous conditions to control monolayer formation. |
| Fluorescent Dye (e.g., DiD, DIR) | Hydrophobic tracer for in vivo imaging and biodistribution studies of nanoparticle carriers. | Dye itself can alter nanoparticle surface properties; use minimal loading (<0.5% w/w). |
| Pluronic F-127 | Non-ionic surfactant often used as a stabilizer and to reduce nonspecific protein adhesion. | Can be adsorbed post-synthesis or incorporated during formulation. |
Table 1: HIC Retention Time vs. In Vivo Circulation Half-life
| Nanoparticle Type | Surface Modification | HIC Retention Time (min) | Circulation t₁/₂ (h) |
|---|---|---|---|
| PLGA | Unmodified | 22.5 | 0.5 |
| PLGA | 5% PEG-2k | 18.1 | 2.1 |
| PLGA | 15% PEG-5k | 9.4 | 8.7 |
| Lipid (LNP) | Ionizable Cationic Lipid Only | 25.8 | 0.8 |
| Lipid (LNP) | + 20% DSPC | 14.3 | 5.2 |
| Mesoporous Silica | Unmodified | 28.7 | 0.3 |
| Mesoporous Silica | PEGylated | 11.2 | 4.5 |
Table 2: Lipid Nanopcomposition vs. Hydrophobicity & Loading
| Formulation (Molar Ratio) | Cholesterol (%) | DSPC (%) | Log P (Predicted) | Drug Loading (%) |
|---|---|---|---|---|
| LNP-A | 50 | 10 | High | 8.5 |
| LNP-B | 40 | 20 | Moderate | 7.1 |
| LNP-C | 30 | 30 | Low | 5.3 |
Experimental Protocols
Protocol 1: Hydrophobic Interaction Chromatography (HIC) for Nanoparticles
- Column Preparation: Pack a glass column with Phenyl Sepharose High Performance resin. Equilibrate with 5 column volumes (CV) of 1.5 M ammonium sulfate in PBS, pH 7.4.
- Sample Preparation: Concentrate nanoparticle suspension to 5 mg/mL. Dialyze into the equilibration buffer.
- Loading & Elution: Load 500 µL of sample onto the column. Start a linear gradient from 1.5 M to 0 M ammonium sulfate over 30 minutes at a flow rate of 0.5 mL/min. Monitor elution by UV-Vis at 280 nm.
- Analysis: Record the retention time at the peak maximum. Longer times indicate higher surface hydrophobicity.
Protocol 2: Serum Protein Corona Analysis via MicroBCA Assay
- Incubation: Mix 1 mL of nanoparticle suspension (1 mg/mL) with 1 mL of 100% FBS. Incubate at 37°C for 1 hour with gentle rotation.
- Isolation: Ultracentrifuge at 100,000 x g for 45 minutes at 4°C. Carefully discard supernatant.
- Washing: Resuspend the pellet in 2 mL of cold PBS. Repeat ultracentrifugation. Repeat wash step twice.
- Quantification: Resuspend final pellet in 500 µL PBS. Perform a standard microBCA protein assay on 100 µL of this suspension. Compare to a BSA standard curve.
- Normalization: Report results as µg of protein adsorbed per mg of nanoparticle.
Diagrams
Title: Hydrophobicity Tuning Impacts Biological Fate
Title: Workflow for Hydrophobicity Optimization Studies
Navigating Common Pitfalls: Strategies to Optimize the Hydrophobic-Hydrophilic Balance
Troubleshooting Guides
Issue: Rapid clearance of nanoparticle (NP) from systemic circulation, measured as a short half-life (t₁/₂). Primary Suspects: 1. Inadequate stealth coating (e.g., suboptimal PEGylation). 2. Excessively hydrophilic surface leading to undesirable protein interactions.
Diagnostic Flow & Decision Tree
Title: Diagnostic Flow for Accelerated Clearance
Key Quantitative Parameters & Targets
Table 1: Critical Physicochemical Parameters for Optimal Circulation
| Parameter | Optimal Range (for Long Circulation) | High-Risk Range (Accelerated Clearance) | Measurement Technique |
|---|---|---|---|
| PEG Grafting Density | 5% - 20% surface coverage | < 5% coverage | NMR, Colorimetric assays |
| PEG Chain Length (Mw) | 2 kDa - 5 kDa | < 2 kDa | GPC, Manufacturer spec |
| Hydrodynamic Size | 20 - 100 nm | > 150 nm (spleen filtration) | Dynamic Light Scattering (DLS) |
| Zeta Potential (in PBS) | -10 mV to -20 mV | < -30 mV (Excess Hydrophilicity) | Electrophoretic Light Scattering |
| Protein Corona (% Opsonins) | < 10% of total corona protein | > 30% of total corona protein | SDS-PAGE, LC-MS/MS |
FAQs
Q1: How do I differentiate between clearance due to insufficient stealth vs. excessive hydrophilicity? A: Perform a protein corona analysis. A corona rich in opsonins (e.g., immunoglobulins, complement proteins) indicates insufficient stealth. A corona dominated by abundant serum proteins like albumin, but still leading to rapid clearance, may indicate excessive hydrophilicity and potential interactions with atypical clearance receptors. Monitor zeta potential; a strongly negative charge (< -30 mV) can signal excessive hydrophilicity.
Q2: My PEGylated nanoparticles are still cleared quickly. What are the common pitfalls in PEGylation? A: Common issues include: 1. Low grafting density (see Table 1). 2. PEG chain degradation or premature loss in vivo. 3. Incorrect conjugation chemistry leading to unstable linkages. 4. The "anti-PEG" immune response in some subjects, which accelerates clearance.
Q3: What experimental protocol can I use to measure PEG grafting density? A:
- Protocol: Colorimetric Iodine Complex Assay
- Prepare: NP dispersion (1 mg/mL), PEG standard solutions (0-100 µg/mL), iodine solution (1.5% I₂, 3% KI in water).
- Mix: 250 µL of sample/standard with 750 µL iodine solution. Vortex.
- Incubate: 15 minutes at room temperature, protected from light.
- Measure: Absorbance at 535 nm using a plate reader.
- Calculate: Use the PEG standard curve to determine the mass of PEG in your sample. Grafting density is calculated as: (Mass of PEG / Total mass of NPs) * 100%.
Q4: Are there alternatives to PEG for stealth coating? A: Yes, research into alternatives includes polymers like poly(2-oxazoline)s (POx), polysarcosine, or biomimetic coatings (e.g., CD47 membrane protein mimics). These aim to provide stealth while potentially avoiding anti-PEG immunity.
The Scientist's Toolkit: Key Research Reagent Solutions
Table 2: Essential Materials for Stealth & Hydrophilicity Studies
| Item | Function & Rationale |
|---|---|
| Methoxy-PEG-NHS Ester (e.g., 2kDa, 5kDa) | Standard reagent for amine-reactive PEGylation to create stealth layer on NPs with surface amines. |
| Size Exclusion Chromatography (SEC) Columns | For purifying PEGylated NPs from free, unreacted PEG polymers. |
| Dynamic & Electrophoretic Light Scattering (DLS/ELS) Instrument | For measuring hydrodynamic size (nm) and zeta potential (mV), the two key physical parameters. |
| Pre-formed Fluorescently Labeled Liposomes | Model nanoparticle systems for controlled in vivo pharmacokinetics screening studies. |
| Opsonin-Specific Antibodies (e.g., anti-C3, anti-IgG) | For detecting and quantifying specific opsonin proteins in the hard corona via ELISA or Western Blot. |
| Density Gradient Medium (e.g., Sucrose/Iodixanol) | For isolating the protein corona-NP complex from free plasma proteins via ultracentrifugation. |
Experimental Workflow for Diagnosis
Title: Workflow for Surface Property vs. Clearance Study
Troubleshooting Guides & FAQs
Q1: How can I definitively determine if my nanoparticle’s poor cellular uptake is due to excessive PEG density (stealth) rather than other factors?
A: Perform a competitive inhibition assay with free PEG polymers.
- Experimental Protocol: Incubate your target cells (e.g., HeLa, HEK293) with a high concentration (e.g., 1-5 mg/mL) of free, non-conjugated PEG (matching the molecular weight of your surface PEG) for 30 minutes. Then, add your fluorescently labeled nanoparticles without washing away the free PEG. Measure cellular fluorescence via flow cytometry after 2-4 hours. A significant increase (e.g., >50%) in nanoparticle signal in the pre-treated cells indicates that free PEG is blocking inhibitory receptors (e.g., SR-BI), confirming excessive stealth as the primary issue.
Q2: What are the quantitative benchmarks for PEG density that typically shift the balance from effective uptake to excessive stealth?
A: The optimal density is highly dependent on PEG molecular weight (MW) and core material. Here are general benchmarks:
| PEG Molecular Weight (Da) | Typical "Optimal" Density (chains/nm²) for Uptake | Density (chains/nm²) Associated with "Excessive Stealth" | Key Supporting References |
|---|---|---|---|
| 2,000 (2k) | 0.5 - 1.2 | > 1.5 | Hatakeyama et al., 2013; Gref et al., 2000 |
| 5,000 (5k) | 0.3 - 0.7 | > 1.0 | Perry et al., 2012 |
| 10,000 (10k) | 0.1 - 0.3 | > 0.5 | Salvati et al., 2013 |
Q3: What experimental protocol can I use to measure the "PEG density" on my nanoparticles?
A: Use a combination of H-NMR and quantitative colorimetric assays.
- H-NMR Protocol for Grafting Density: Dissolve lyophilized PEGylated nanoparticles in deuterated solvent (e.g., CDCl3, D2O). Compare the integral of characteristic PEG peak (e.g., -O-CH2-CH2- at ~3.6 ppm) to the integral of a core-specific peak. Use the known core quantity to calculate the number of PEG chains per particle.
- Iodine Staining Protocol: For a rapid, semi-quantitative check, use the iodine stain method. Prepare a barium chloride/iodine solution (1% I2, 2% BaCl2 in water). Mix with nanoparticle solution. A yellow-brown color indicates the presence of PEG. Compare intensity against PEG standards of known concentration via UV-vis at 500 nm.
Q4: If I have confirmed excessive PEGylation, what strategies can I use to restore uptake without completely sacrificing circulation time?
A: Implement a "differential shielding" or "layered" approach.
- Mixed PEG Layer Protocol: Synthesize nanoparticles with a mixed brush layer. Use a 70:30 or 80:20 molar ratio of long-chain PEG (e.g., 5k Da) to short-chain PEG (e.g., 1k Da) or a short targeting ligand during formulation. The long PEG provides stealth, while the short, sparse components create local charge/hydrophobicity patches for adsorption-mediated uptake.
- PEG-Sheddable Coating Protocol: Design nanoparticles with PEG attached via a cleavable linker (e.g., pH-sensitive hydrazone or matrix metalloproteinase (MMP)-sensitive peptide). Verify cleavage and uptake rescue in vitro by comparing uptake at pH 7.4 vs. pH 5.5 (for pH-sensitive) or in the presence/absence of active MMPs.
Q5: How do I specifically test if poor endosomal escape is linked to the PEG coating, and not just a lack of proton buffering?
A: Conduct a fluorescent co-localization "escape" assay with and without PEG.
- Experimental Protocol:
- Prepare two batches of nanoparticles with identical cores and endosomolytic agents (e.g., chloroquine, HA2 peptide) but one with a dense PEG coat and one without.
- Load both with a pH-sensitive dye (e.g., CypHer5E) that fluoresces only at low pH.
- Incubate with cells, then fix at set time points (1, 4, 8, 24h).
- Stain for early endosomes (EEA1) and lysosomes (LAMP1).
- Image via confocal microscopy. Analyze the Manders' overlap coefficient between the nanoparticle signal (now in acidic compartments) and the lysosomal signal. A significantly higher lysosomal co-localization for the PEGylated version indicates PEG is inhibiting the escape mechanism, trapping the particle in the degradative pathway.
The Scientist's Toolkit: Key Research Reagent Solutions
| Item | Function & Rationale |
|---|---|
| mPEG-NHS Ester (various MWs) | Gold standard for amine-reactive PEGylation. Used to create the stealth layer. Different MWs allow tuning of stealth thickness. |
| DSPE-PEG(2000)-Biotin | A phospholipid-PEG conjugate for inserting into lipid-based nanoparticles. Biotin allows downstream purification or detection via streptavidin. |
| pHrodo Red / CypHer5E | pH-sensitive fluorescent dyes. Fluorescence increases in acidic environments (endosomes/lysosomes), allowing tracking of internalization and fate. |
| LysoTracker Deep Red / DND-99 | Cell-permeant dyes that accumulate in acidic organelles. Used to label lysosomes for co-localization studies. |
| Chloroquine diphosphate | A lysosomotropic agent that neutralizes endosomal pH. Used as a positive control to demonstrate pH-dependent endosomal escape. |
| DAPI (4',6-diamidino-2-phenylindole) | Nuclear counterstain for fluorescence microscopy. Essential for confirming cell viability and locating intracellular nanoparticles. |
| Iodine Staining Solution | A rapid, qualitative tool to confirm the presence of a PEG corona on nanoparticles. |
Visualizations
Diagram 1: PEG Density Impact on Nanoparticle-Cell Interaction
Diagram 2: Endosomal Trapping Due to Excessive PEG
Diagram 3: Protocol for Diagnosing Excessive Stealth
FAQs & Troubleshooting Guides
Q1: In our nanoparticle formulation, we observe rapid clearance despite PEGylation. What could be the cause and how can we troubleshoot? A: Rapid clearance often indicates suboptimal PEG configuration. First, measure your actual surface PEG density. A density below 0.5 chains/nm² for a 2kDa PEG may be insufficient to form an effective steric barrier, leading to opsonin adsorption. Increase the molar ratio of PEG-lipid during preparation. If density is adequate, consider increasing PEG chain length to 3kDa or 5kDa to improve the hydration layer and steric repulsion. Verify that PEG conjugation chemistry is efficient and not compromised by batch variability in functionalized lipids/polymers.
Q2: How do we balance the "stealth" effect of dense, long PEG chains with the need for targeting ligand accessibility? A: This is a core optimization challenge. A common strategy is to use a mixed-layer approach: use a longer PEG (e.g., 3-5kDa) at high density for stealth, and co-conjugate a shorter, functionalized PEG (e.g., 2kDa) terminated with your targeting ligand (e.g., an antibody, peptide). This positions the ligand above the stealth corona. Experiment with ratios (e.g., 95% stealth PEG : 5% ligand-PEG). Use surface plasmon resonance (SPR) or flow cytometry to confirm ligand accessibility and binding to the target receptor.
Q3: Our targeted nanoparticles show good in vitro binding but poor in vivo efficacy. What experimental parameters should we revisit? A: This points to a dissociation between targeting and circulation. The primary culprit is often excessive PEG density/chain length masking the ligand. Systematically reduce the density of the background "stealth" PEG while monitoring circulation time in a murine model. Alternatively, switch to a cleavable PEG linkage that sheds in the tumor microenvironment. Also, characterize the "dangling" versus "brush" conformation of your PEG layers via techniques like NMR or neutron scattering; a brush conformation is more protective but more masking.
Q4: What are the key characterization techniques to confirm PEG configuration, and what are typical target values? A: See Table 1 for quantitative targets and techniques.
Table 1: Key Characterization for PEG Configuration
| Parameter | Technique | Typical Optimal Range for Long Circulation | Notes |
|---|---|---|---|
| PEG Density | NMR, Radiolabeling, Colorimetric Assay | 5-20 mol% (lipid systems); 0.5-2 chains/nm² | Critical threshold exists for brush conformation. |
| PEG Chain Length | GPC, MALDI-TOF | 2 kDa - 5 kDa | Longer chains increase hydrodynamic radius more effectively. |
| Hydrodynamic Diameter | Dynamic Light Scattering (DLS) | < 100 nm (ideally 30-80 nm) | Post-PEGylation increase of 5-15 nm is typical. |
| Surface Charge (Zeta Potential) | Laser Doppler Microelectrophoresis | Near neutral (-10 mV to +10 mV) | Highly negative/positive can promote clearance. |
| Conformation (Brush vs Dangling) | Neutron Scattering, AFM | Brush Conformation | Density > 1 chain/ (π*Rg²) promotes brush. |
Experimental Protocols
Protocol 1: Determining PEG Density on Liposomal Nanoparticles
- Prepare Liposomes: Formulate using thin-film hydration with a known fraction of DSPE-PEG(2000)-NHS (e.g., 10 mol%) and a trace amount of radiolabeled or fluorescently tagged lipid.
- Purify: Purify via size-exclusion chromatography (SEC) to remove unencapsulated material and free PEG-lipid.
- Quantify Lipid Phosphorus: Use a Bartlett assay or Stewart assay on an aliquot to determine total phospholipid content.
- Quantify PEG-Lipid: For radioactive tags, use scintillation counting. For fluorescent tags, use fluorescence spectroscopy against a standard curve. For unlabeled PEG, use a colorimetric iodine complexation assay (requires hydrolysis).
- Calculate: PEG density (chains/nm²) = (Number of PEG molecules) / (Total surface area of nanoparticles). Surface area is calculated from the number of liposomes (estimated from total lipid) and mean diameter (from DLS).
Protocol 2: In Vivo Screening of PEG Configuration for Circulation Half-Life
- Formulation Library: Prepare a matrix of nanoparticles (e.g., 70 nm liposomes) varying PEG chain length (2kDa, 3kDa, 5kDa) and density (1, 5, 10, 15 mol% PEG-lipid). Label each batch with a near-infrared (NIR) dye like DiR.
- Animal Study: Inject each formulation (n=5 mice/group) intravenously via the tail vein at a standard lipid dose.
- Blood Kinetics: Collect small blood samples (e.g., 10 µL) from the retro-orbital plexus at time points: 2 min, 30 min, 2h, 8h, 24h, 48h.
- Sample Processing: Lyse blood samples in PBS with 1% Triton X-100. Measure fluorescence intensity of the supernatant using a plate reader.
- Data Analysis: Express fluorescence as % of injected dose per gram of blood (%ID/g). Fit data to a two-compartment model to calculate alpha and beta half-lives (t1/2α, t1/2β). The beta phase (t1/2β) represents the circulation half-life for optimization.
Diagrams
Title: PEG Density Optimization Logic
Title: PEG Configuration Optimization Workflow
The Scientist's Toolkit: Research Reagent Solutions
| Item | Function & Rationale |
|---|---|
| DSPE-PEG (Varied MW & End Groups) | The workhorse lipid-PEG conjugate. Different molecular weights (1k-5kDa) control chain length. Functional end-groups (e.g., NHS, Maleimide, COOH) enable ligand conjugation. |
| mPEG-Thiol / -Amine | For conjugating PEG to the surface of pre-formed polymeric or metallic nanoparticles via gold-thiol or carbodiimide chemistry. |
| Cleavable PEG Linkers (e.g., DSPE-PEG(2000)-SS) | PEG linked via a disulfide bond that cleaves in the reducing tumor microenvironment, shedding the stealth layer to expose targeting ligands. |
| Size-Exclusion Chromatography (SEC) Columns | Critical for purifying PEGylated nanoparticles from unconjugated PEG, free ligands, and other small molecules post-reaction. |
| Near-Infrared (NIR) Lipophilic Dyes (DiR, DiD) | For in vivo tracking. These dyes incorporate into nanoparticle membranes, allowing quantitative measurement of blood kinetics and biodistribution. |
| Colorimetric PEG Assay Kits (e.g., Iodine-Based) | For quantifying PEG density on nanoparticle surfaces without the need for radioactive labeling. |
| Functionalized Lipids (e.g., DSPE-PEG(2000)-Biotin) | A model system for studying ligand accessibility using streptavidin binding assays (SPR, ELISA) before moving to more complex targeting moieties. |
FAQs & Troubleshooting Guides
Q1: My sheddable PEG coating fails to detach in the tumor microenvironment (TME), leading to poor cellular uptake. What could be the cause? A: This is often due to an incorrect match between the linker's cleavage sensitivity and the specific TME conditions. Troubleshoot using this protocol:
- Quantify TME Triggers: Isolate tumor interstitial fluid from your model system. Use a fluorescent probe (e.g., pHrodo Red) to measure exact extracellular pH. Use a commercial MMP activity assay kit (e.g., SensoLyte) to quantify specific MMP (e.g., MMP-2/9) concentrations and activity levels.
- Validate Linker Response In Vitro: Incubate your coated nanoparticles in buffers mimicking both physiological (pH 7.4) and TME (pH 6.5-6.8) conditions, with and without added recombinant MMPs at the concentration measured in step 1. Analyze hydrodynamic diameter via DLS and surface charge via zeta potential every 30 minutes for 4 hours to confirm shedding.
Q2: My nanoparticles are cleared rapidly despite the stealth coating, suggesting opsonization. How can I diagnose this? A: Rapid clearance indicates premature protein corona formation. Perform this serum stability assay:
- Protocol: Incubate your nanoparticle sample (1 mg/mL) with 50% fetal bovine serum (FBS) in PBS at 37°C under gentle rotation.
- Sample at Time Points: 0, 15, 60, and 120 minutes.
- Analysis: Centrifuge samples (15,000 x g, 20 min) to pellet nanoparticles with adsorbed proteins. Wash gently. Run the eluted proteins on an SDS-PAGE gel. A thick, time-dependent protein banding pattern confirms opsonization.
- Solution: Optimize PEG density (>5 chains per 100 nm²) and ensure linker stability at pH 7.4. Consider alternative stealth polymers like poly(2-oxazoline).
Q3: After coating shedding, my nanoparticles aggregate, hindering targeting. How can I prevent this? A: Aggregation exposes the hydrophobic nanoparticle core. This table summarizes key parameters to balance:
| Parameter | Target Range | Measurement Technique | Purpose |
|---|---|---|---|
| Core Hydrophobicity (Log P) | 2 - 4 | Computational (Molinspiration) / HPLC | Balances drug loading vs. post-shedding stability |
| PEG Grafting Density | 0.5 - 2 chains / 100 nm² | NMR / TGA | Provides initial stealth without hindering shedding |
| Post-Shedding Zeta Potential | ±20 - ±30 mV | Dynamic Light Scattering | Maintains colloidal stability after PEG removal |
| Linker Cleavage Half-life (TME) | < 1 hour | Fluorescence Dequenching Assay | Ensures rapid shedding for timely targeting |
Experimental Protocol: Validating Sequential Stealth-to-Targeting Switch Objective: To quantitatively demonstrate pH-dependent PEG shedding and subsequent target cell binding. Materials:
- Nanoparticles with pH-sensitive linkers (e.g., hydrazone, acetal) conjugated to PEG and a targeting ligand (e.g., folate, RGD peptide).
- Fluorescent dye (e.g., Cy5) loaded in nanoparticle core.
- Buffer A: PBS, pH 7.4. Buffer B: MES, pH 6.5.
- Target cell line (e.g., KB cells for folate targeting) and control cell line. Method:
- Shedding Kinetics: Incubate NPs in Buffer A and B separately at 37°C. Use DLS to measure size and zeta potential every 15 min for 2 hours. A significant drop in size and charge shift confirms shedding.
- Binding/Uptake Assay: Pre-incubate NPs for 1 hour in Buffer A or B. Add treated NPs to cells in corresponding pH media. After 2 hours, wash, trypsinize, and analyze via flow cytometry. Compare fluorescence intensity.
The Scientist's Toolkit: Key Research Reagent Solutions
| Item | Function | Example / Key Property |
|---|---|---|
| MMP-2/9 (Recombinant) | Validates MMP-responsive linker cleavage kinetics. | Human, active enzyme, >95% purity (by SDS-PAGE). |
| pHrodo Red AM Intracellular pH Indicator | Accurately measures extracellular and intratumoral pH. | Fluorescence increases sharply in acidic environments. |
| DLS/Zeta Potential Kit | Measures hydrodynamic size and surface charge stability. | Requires specific electrolyte solution for zeta measurement. |
| SensoLyte 520 MMP-2 Assay Kit | Fluorimetrically quantifies MMP-2 activity in tumor homogenates. | Sensitive to 0.1 ng/mL activity. |
| Dibenzocyclooctyne (DBCO)-PEG₄-NHS Ester | For "click" chemistry conjugation of PEG to nanoparticle surface. | Enables controlled, site-specific grafting. |
| Mal-PEG-NHS (Ortho Pyridyl Disulfide) | For constructing reducible (GSH-responsive) disulfide linkers. | Enables stealth coating shedding in high intracellular GSH. |
Title: Nanoparticle with Sheddable Coating
Title: Sequential Stealth to Targeting Workflow
Technical Support Center
Troubleshooting Guides & FAQs
Q1: My DoE model for predicting circulation time shows poor fit (low R²). What are the likely causes and solutions?
- A: A low R² in your response surface model often indicates missing critical factors or interactions.
- Cause 1: The chosen DoE range for your factors (e.g., PEG density, hydrophobic ligand %) may be too narrow. The response (circulation half-life) may not change significantly within it.
- Solution: Perform a screening design (e.g., Plackett-Burman) with wider ranges first to identify active factors.
- Cause 2: Key surface properties affecting protein corona formation were not included as factors.
- Solution: Add factors like "zeta potential" or "surface energy" to your experimental matrix. Use a Fractional Factorial or D-Optimal design to manage the increased number of factors.
- Cause 3: High experimental noise in measuring the outcome (e.g., pharmacokinetic data variability).
- Solution: Increase replication, especially at center points, to better estimate pure error. Standardize animal handling and blood sampling protocols.
Q2: During in vitro targeting assays, my nanoparticles with optimized hydrophobicity show non-specific binding. How can I refine the DoE?
- A: This indicates that the balance between stealth (hydrophilicity) and targeting (controlled hydrophobicity) has not been correctly captured.
- Refinement Step: Introduce a new response variable into your existing DoE analysis: "Specificity Index" (Target Cell Uptake / Non-Target Cell Uptake).
- Protocol: In vitro Specificity Assay:
- Culture target cells (e.g., cancer cell line with overexpressed receptor) and non-target cells.
- Treat co-cultures or separate wells with your DoE library of nanoparticles (fluorescently labeled).
- Use flow cytometry to quantify nanoparticle association (MFI) for each cell type after 1-2 hours.
- Calculate the Specificity Index for each formulation.
- Analysis: Fit a model for the Specificity Index. The optimal region for "circulation time" and "specificity" can be found using a Desirability Function overlay plot.
Q3: How do I handle conflicting objectives (long circulation vs. strong targeting) when analyzing DoE results?
- A: Use a multi-response optimization approach.
- Method: Desirability Function Analysis.
- Fit individual models for each critical response (Y1 = Circulation Half-life, Y2 = Targeting Efficacy).
- Define desirability functions (d) for each response (0 to 1, where 1 is most desirable).
- The overall desirability (D) is the geometric mean of individual desirabilities: D = (d1 × d2)^(1/2).
- Use statistical software (JMP, Minitab, Design-Expert) to find factor settings that maximize D.
- Visual Output: Generate an Overlay Plot showing the "sweet spot" region where all predictions meet your criteria.
- Method: Desirability Function Analysis.
Q4: My resource for animal testing is limited. What is the most efficient DoE to start mapping surface properties to in vivo outcomes?
- A: A Central Composite Design (CCD) or a Small, Response Surface Design is optimal for resource-constrained in vivo studies.
- Recommended Protocol: Use a two-stage approach.
- Stage 1 (In vitro screening): Use a full or fractional factorial design with 3-4 factors (e.g., ligand type, PEG length, coupling ratio, hydrophobic modifier %) and measure in vitro proxies (hydrophobicity index via HIC, protein adsorption, cell uptake).
- Stage 2 (Focused in vivo validation): Select 3-5 promising leads from Stage 1. Create a small, focused CCD (as few as 15-20 total data points) where you slightly vary the two most critical factors around the lead formulation to map the local response surface for circulation time.
- Recommended Protocol: Use a two-stage approach.
Data Presentation
Table 1: Example DoE Matrix (Face-Centered CCD) & Simulated Outcomes for Nanoparticle Optimization
| Run | Factor A: PEG Density (chains/nm²) | Factor B: Hydrophobic Ligand (%) | Response 1: Circulation t₁/₂ (h) | Response 2: Target Cell Uptake (MFI) |
|---|---|---|---|---|
| 1 | 0.2 (-1) | 5 (-1) | 2.1 | 8500 |
| 2 | 0.6 (+1) | 5 (-1) | 8.5 | 1200 |
| 3 | 0.2 (-1) | 25 (+1) | 1.5 | 15500 |
| 4 | 0.6 (+1) | 25 (+1) | 5.2 | 9800 |
| 5 | 0.05 (-α) | 15 (0) | 0.8 | 11000 |
| 6 | 0.75 (+α) | 15 (0) | 10.3 | 2500 |
| 7 | 0.4 (0) | 0 (-α) | 6.4 | 800 |
| 8 | 0.4 (0) | 30 (+α) | 3.8 | 16800 |
| 9-13 | 0.4 (0) | 15 (0) | 5.9, 6.2, 6.0, 5.8, 6.1 | 7200, 7050, 7350, 7100, 7250 |
Table 2: Analysis of Variance (ANOVA) for Fitted Circulation Time Model
| Source | Sum of Sq | df | Mean Square | F-Value | p-value |
|---|---|---|---|---|---|
| Model | 98.45 | 5 | 19.69 | 65.63 | <0.0001 |
| A-PEG Density | 72.25 | 1 | 72.25 | 240.83 | <0.0001 |
| B-Ligand % | 12.10 | 1 | 12.10 | 40.33 | 0.0003 |
| AB | 4.84 | 1 | 4.84 | 16.13 | 0.0037 |
| A² | 6.25 | 1 | 6.25 | 20.83 | 0.0015 |
| B² | 3.02 | 1 | 3.02 | 10.07 | 0.0128 |
| Residual | 2.10 | 7 | 0.30 | ||
| Lack of Fit | 1.55 | 3 | 0.52 | 3.25 | 0.1415 |
| Pure Error | 0.55 | 4 | 0.14 | ||
| R² = 0.979 |
Experimental Protocols
Protocol 1: Hydrophobic Interaction Chromatography (HIC) for Nanoparticle Hydrophobicity Index
- Objective: Quantify relative surface hydrophobicity as a key input variable for DoE.
- Materials: HIC column (e.g., Butyl Sepharose), HPLC system, PBS, ammonium sulfate buffers.
- Steps:
- Equilibrate column with 1.5M ammonium sulfate in PBS, pH 7.4.
- Inject nanoparticle sample (100 µL).
- Run a 20-min linear gradient from 1.5M to 0M ammonium sulfate.
- Record retention time. The Hydrophobicity Index is calculated as the normalized retention time relative to a standard.
- Perform in triplicate for each formulation in the DoE matrix.
Protocol 2: In Vivo Circulation Half-life Pharmacokinetic Study
- Objective: Measure primary efficacy response for DoE model.
- Materials: Mice (n=5 per formulation), fluorescent dye (DIR) or radiolabel (¹¹¹In), IVIS or gamma counter, blood collection supplies.
- Steps:
- Label nanoparticles from each DoE run.
- Inject dose intravenously via tail vein.
- Collect blood samples (10-20 µL) at pre-determined time points (e.g., 2 min, 30 min, 2h, 8h, 24h).
- Quantify signal in blood samples.
- Fit blood concentration-time curve to a two-compartment model using software (e.g., PK Solver) to calculate terminal half-life (t₁/₂).
Mandatory Visualization
Diagram Title: DoE Workflow for Nanoparticle Surface Optimization
Diagram Title: Hydrophobicity Trade-off in Nanoparticle Design
The Scientist's Toolkit
Table 3: Key Research Reagent Solutions for DoE-Based Nanoparticle Optimization
| Item | Function in Experiments |
|---|---|
| Functionalized PEG Lipids (e.g., DSPE-PEG-COOH, -Maleimide, -NH₂) | Provides stealth layer. Terminal group allows covalent coupling of targeting/hydrophobic ligands. Systematic variation of PEG length/density is a key DoE factor. |
| Hydrophobic Ligand Library (e.g., Cholesterol derivatives, Tocopherol, C18 chains) | Modulates core/surface hydrophobicity. Different ligands are tested as a categorical factor in screening designs. |
| HIC Calibration Standards | Used to normalize nanoparticle retention times into a quantitative "Hydrophobicity Index" for model input. |
| Fluorescent Lipophilic Dyes (e.g., DIR, DiD, DiO) | Labels nanoparticles for in vitro and in vivo tracking (uptake, circulation, biodistribution). Critical for quantifying DoE responses. |
| Pre-activated Targeting Ligands (e.g., Folate-NHS, cRGDfK-Maleimide) | Enables controlled, reproducible conjugation to PEG termini. Coupling efficiency is often a key process factor in the DoE. |
| Ammonium Sulfate Gradient Buffers | For HIC analysis. Consistent buffer preparation is essential for reproducible hydrophobicity measurements across the DoE library. |
| Software for DoE & Analysis (e.g., JMP, Minitab, Design-Expert) | Used to generate randomized run orders, analyze results, fit models, and perform multi-response optimization. |
Benchmarking Performance: In Vitro, In Vivo, and Computational Validation of Optimized Formulations
Technical Support Center: Troubleshooting & FAQs
Serum Stability Assays
Q1: Our nanoparticles are aggregating rapidly in serum, confounding DLS measurements. What are the primary causes and solutions? A: Rapid aggregation often indicates insufficient surface hydrophilic shielding or opsonin adsorption.
- Troubleshooting Steps:
- Check PEG Density/Conformation: Increase PEGylation density (aim for >5 kDa PEG at 1 molecule per 10-100 nm²) or use branched PEG for better steric protection.
- Verify Purification: Ensure complete removal of unreacted hydrophobic precursors or surfactants via size exclusion chromatography (SEC) or tangential flow filtration (TFF).
- Modify Incubation Conditions: Perform a serial dilution of serum in buffer (e.g., 10%, 50%, 100%) to identify if aggregation is concentration-dependent. Consider shorter initial time points (5, 15, 30 mins).
- Protocol for Assessing Aggregation via DLS:
- Dilute nanoparticles in 1x PBS to a standard concentration (e.g., 0.1 mg/mL).
- Mix 1:1 with pre-warmed (37°C) fetal bovine serum (FBS) or human serum.
- Incubate at 37°C. At defined timepoints (0, 0.5, 1, 2, 4, 24 h), remove 50 µL aliquot and dilute in 1 mL of PBS or DI water in a DLS cuvette.
- Measure hydrodynamic diameter and polydispersity index (PDI). A >20% increase in size and PDI >0.3 indicates instability.
Q2: How do we differentiate between degradation and aggregation in a serum stability experiment? A: Use complementary techniques.
- Use SEC-HPLC: To separate intact nanoparticles from protein aggregates and degraded components.
- Perform Fluorescence Correlation Spectroscopy (FCS): If particles are fluorescently labeled, FCS can detect changes in diffusion time indicating aggregation, even in serum.
- Apply Asymmetric Flow Field-Flow Fractionation (AF4): Coupled with MALS/DLS for high-resolution size separation in complex biological media.
Macrophage Uptake Assays
Q3: Our flow cytometry data shows high variability in macrophage uptake between replicates. What could be the reason? A: Inconsistent macrophage activation or differentiation state is a common culprit.
- Troubleshooting Guide:
- Standardize Cell Source & Differentiation: Use the same donor/passage number for primary cells, or a consistent clone for cell lines (e.g., RAW 264.7, THP-1). For THP-1, detail PMA concentration (e.g., 100 nM), duration (e.g., 48h), and recovery time (e.g., 24h in PMA-free media).
- Control Media Components: Use charcoal-stripped FBS to minimize variability from serum factors. Avoid antibiotics during the assay if possible, as they can affect phagocytosis.
- Include Internal Controls: Use fluorescent calibration beads and include wells with a known positive control (e.g., amine-modified polystyrene beads) and negative control (untreated cells).
- Gating Strategy: Use a viability dye (e.g., propidium iodide) to exclude dead cells. Gate on single cells using FSC-A vs. FSC-H.
Q4: How can we confirm that fluorescence signal is from internalization and not just surface binding? A: Implement a quenching step.
- Detailed Protocol for Distinguishing Internalization:
- Plate macrophages in a 24-well plate at 2x10^5 cells/well and allow to adhere overnight.
- Incubate with fluorescent nanoparticles for the desired time (e.g., 2-4 h) at 37°C.
- Wash cells 3x with ice-cold PBS.
- Quench External Fluorescence: Treat cells with 0.4% Trypan Blue (or 0.2 mg/mL Evans Blue) in PBS for 1 minute at room temperature. This dye quenches extracellular fluorescence but cannot penetrate live cell membranes.
- Wash 3x with PBS, trypsinize, and resuspend in flow cytometry buffer for immediate analysis.
- Compare mean fluorescence intensity (MFI) of quenched samples to unquenched controls.
Target Cell Association Assays
Q5: We observe high non-specific association of our targeted nanoparticles to off-target cells. How can we reduce this? A: High non-specific association typically stems from residual hydrophobic patches or charge interactions.
- Solutions:
- Optimize the "PEG Dilemma": Increase PEG length/density to shield non-specific interactions, but balance this by using a longer linker or a cleavable PEG to maintain target accessibility.
- Modify Surface Charge: Aim for a slightly negative zeta potential (e.g., -10 to -20 mV) in PBS to minimize electrostatic interactions with negatively charged cell membranes.
- Include Competitive Blocking: In your assay, pre-incubate targeted cells with an excess of free targeting ligand (e.g., 100x molar excess) for 30 minutes before adding nanoparticles. A significant reduction in MFI in the blocked sample confirms specific binding.
- Protocol for Competitive Binding Assay:
- Prepare two sets of target cells.
- To the "blocked" set, add free ligand in serum-free media. Incubate 30 min at 37°C.
- Add fluorescent nanoparticles to both "blocked" and "normal" sets. Co-incubate for 1-2 h.
- Wash, harvest, and analyze by flow cytometry. Calculate % specific association = (MFInormal - MFIblocked) / MFI_normal * 100.
Q6: What is the best way to quantify binding affinity (KD) of nanoparticles to cells? A: Use a saturation binding assay with flow cytometry.
- Methodology:
- Incubate a constant number of cells (e.g., 2x10^5) with increasing concentrations of fluorescent nanoparticles (e.g., 0.1 nM to 100 nM) for a set time at 4°C (to inhibit internalization).
- Wash, analyze MFI via flow cytometry.
- Subtract MFI from non-specific binding (measured in the presence of excess free ligand).
- Plot specific MFI vs. nanoparticle concentration. Fit data using a one-site specific binding model (e.g., in GraphPad Prism) to derive KD.
Table 1: Common Nanoparticle Formulations & In Vitro Performance
| Formulation (Core-Coating-Target) | Hydrodynamic Size (nm) | PDI | Zeta Potential (mV) | Serum Half-life (t½) | Macrophage Uptake (MFI) | Target Cell Assoc. (MFI) |
|---|---|---|---|---|---|---|
| PLGA-PEG-OH | 105 ± 8 | 0.08 | -5 ± 2 | ~4 h | 2,500 | 1,800 |
| PLGA-PEG-Folate | 115 ± 12 | 0.12 | -8 ± 3 | ~3.5 h | 3,100 | 15,400 |
| PLA-PEG-RGD | 95 ± 5 | 0.15 | -12 ± 1 | ~6 h | 1,800 | 12,900 |
| PS-PMA (No PEG) | 150 ± 25 | 0.35 | +15 ± 5 | <0.5 h | 45,000 | 22,000 |
Table 2: Troubleshooting Matrix for Key Assay Problems
| Assay | Problem | Possible Cause | Verification Experiment | Suggested Fix |
|---|---|---|---|---|
| Serum Stability | Size increase & high PDI | Aggregation due to opsonization | SEC-HPLC of serum sample | Increase PEG density; use dysopsonin (e.g., CD47 mimetic) |
| Macrophage Uptake | Low/unexpectedly high signal | Incorrect cell state; serum opsonic factors | Check markers (CD11b, F4/80); use heat-inactivated serum | Standardize PMA treatment; use 10% HI-FBS |
| Target Association | High background on off-target cells | Hydrophobic/charge interactions | Measure zeta potential; test in serum-free media | Introduce more PEG; adjust surface to slight negative charge |
| All Flow Assays | High replicate variability | Inconsistent cell counts/gating | Count cells pre-assay; use counting beads in flow | Standardize seeding protocol; implement strict single-cell gating |
Experimental Protocols
Protocol 1: Comprehensive Serum Stability Assessment Objective: Determine nanoparticle stability in 100% FBS over 24 hours. Materials: Nanoparticle suspension (1 mg/mL in PBS), FBS, PBS, DLS instrument, SEC-HPLC system. Procedure:
- Pre-warm FBS to 37°C.
- In a microcentrifuge tube, mix 100 µL of nanoparticles with 900 µL of FBS (final conc. 0.1 mg/mL). Vortex briefly.
- Incubate at 37°C in a shaking incubator (200 rpm).
- At t = 0, 1, 2, 4, 8, 24 hours, remove 100 µL aliquot.
- For DLS: Dilute aliquot 1:20 in PBS, measure size/PDI in triplicate.
- For SEC-HPLC: Inject 50 µL of undiluted aliquot onto a size-exclusion column (e.g., TSKgel). Monitor at 280 nm (protein) and your NP's specific wavelength (e.g., 650 nm).
- Calculate the percentage of intact nanoparticles remaining at each time point based on HPLC peak area.
Protocol 2: Quantitative Macrophage Uptake via Flow Cytometry Objective: Measure time- and concentration-dependent uptake in RAW 264.7 cells. Materials: RAW 264.7 cells, fluorescent nanoparticles, complete DMEM, PBS, Trypan Blue solution (0.4%), flow cytometer. Procedure:
- Seed cells in a 12-well plate at 3x10^5 cells/well in 1 mL complete media. Culture overnight.
- Prepare nanoparticle dilutions in serum-containing media (e.g., 5, 25, 50 µg/mL).
- Aspirate media from wells, add 1 mL of nanoparticle suspension per well. Include wells with media only (negative control).
- Incubate at 37°C/5% CO2 for 1, 2, and 4 hours.
- Place plate on ice. Aspirate media, wash wells 3x with 1 mL ice-cold PBS.
- Add 0.5 mL of Trypan Blue solution per well for 1 min to quench extracellular fluorescence.
- Wash 3x with PBS. Add 0.3 mL trypsin, incubate at 37°C for 5 min. Neutralize with 0.7 mL media.
- Transfer cell suspension to FACS tubes, centrifuge (300 x g, 5 min), and resuspend in 0.3 mL PBS containing 1% BSA.
- Analyze immediately on flow cytometer. Gate on live, single cells and report MFI.
Diagrams
Title: The Hydrophobicity Balance for Nanoparticle Design
Title: Serum Stability Assay Workflow
Title: Macrophage Uptake & Clearance Pathway
The Scientist's Toolkit: Research Reagent Solutions
Table 3: Essential Materials for In Vitro Validation Assays
| Item | Function & Relevance | Example Product/Catalog |
|---|---|---|
| Charcoal-Stripped FBS | Removes endogenous hormones, growth factors, and lipophilic compounds to reduce variability in cell association/uptake assays. | Gibco, Cat #12676029 |
| Size Exclusion Columns | For purifying nanoparticles from unreacted components and analyzing serum stability via SEC-HPLC. | TSKgel G4000SWxl, Superose 6 Increase |
| PMA (Phorbol 12-myristate 13-acetate) | Differentiates monocytic cell lines (e.g., THP-1) into adherent macrophage-like cells for uptake studies. | Sigma, Cat #P8139 |
| Trypan/Evans Blue Dye | Quenches extracellular fluorescence to confirm cellular internalization in flow cytometry. | Thermo Fisher, Cat #T10282 |
| Counting Beads for Flow | Absolute quantitation of cell concentration and uptake per cell, improving reproducibility. | CountBright Beads, Cat #C36950 |
| AF4-MALS-DLS System | Advanced characterization of nanoparticle size distribution and stability directly in complex media like serum. | Wyatt Technology Eclipse |
| Competitive Free Ligand | Validates specificity of targeted nanoparticles in association assays (e.g., free folate for folate-targeted NPs). | Sigma (Follic acid, Cat #F7876) |
| Zeta Potential Reference | Standard for calibrating zeta potential measurements in different dispersion media. | Malvern Zeta Potential Transfer Standard |
Troubleshooting Guides and FAQs
Q1: Why do our hydrophobic nanoparticles show rapid clearance from systemic circulation, despite high encapsulation efficiency?
A: Excessive nanoparticle hydrophobicity is a primary cause of rapid opsonization and uptake by the mononuclear phagocyte system (MPS), primarily in the liver and spleen. This compromises circulation half-life (t₁/₂). The balance is critical; some hydrophobicity aids cellular internalization, but too much accelerates clearance.
- Troubleshooting Steps:
- Characterize Surface Properties: Measure the zeta potential and hydrophobicity (e.g., via contact angle or hydrophobic interaction chromatography). A highly negative or positive charge and high hydrophobicity increase MPS recognition.
- Modify Surface Chemistry: Implement PEGylation (using DSPE-PEG, PLGA-PEG) to create a hydrophilic steric barrier. Critical Parameter: PEG density and chain length (2kDa vs. 5kDa) directly impact "stealth" properties.
- Optimize Formulation: Increase the molar ratio of hydrophilic polymer (e.g., PEG) to core polymer (e.g., PLGA). A common starting point is a 10:90 PEG-PLGA ratio, adjusted empirically.
- Validate in Vivo: Compare PK of old vs. new formulations. A successful stealth coating should decrease the area under the curve (AUC) in the liver and spleen and increase AUC in plasma in biodistribution studies.
Q2: How can we resolve discrepancies between high in vitro targeting efficacy and poor in vivo tumor accumulation?
A: This is a classic challenge in balancing hydrophobicity for targeting vs. circulation. In vitro, active targeting ligands (e.g., antibodies, peptides) bind effectively. In vivo, rapid clearance prevents nanoparticles from reaching the tumor site.
- Troubleshooting Steps:
- Verify the "Enhanced Permeability and Retention" (EPR) Effect: Ensure your tumor model has adequate vascular permeability. Use imaging to confirm baseline nanoparticle accumulation without ligands.
- Assess Ligand Density: Too high ligand density can increase hydrophobicity/immunogenicity, accelerating clearance. Perform a ligand density optimization study (e.g., 0%, 25%, 50%, 100% ligand substitution on PEG termini).
- Check Binding Integrity: Confirm that the conjugation chemistry does not degrade the ligand's activity. Use surface plasmon resonance (SPR) or cell-based binding assays post-conjugation.
- Sequential Administration: Consider administering a plain PEGylated nanoparticle dose first to saturate the MPS, followed by the targeted dose (a "priming" strategy).
Q3: What are the best practices for ensuring reproducible and quantitative biodistribution data using radiolabels or fluorescent dyes?
A: Inaccurate data often stems from label instability (leaching) or altered nanoparticle behavior due to the label.
- Troubleshooting Steps:
- Validate Label Stability: Perform an in vitro sink condition test: incubate labeled nanoparticles in serum or PBS at 37°C, separate nanoparticles (via ultracentrifugation/filtration), and measure % of free label in supernatant. >5% leaching over 24h is problematic.
- Use Dual Labels: For critical studies, incorporate both a radioactive label (e.g., ¹¹¹In, ⁶⁴Cu) in the core/chelator and a near-infrared (NIR) dye (e.g., DiR, Cy7) in the lipid layer. Correlate signals from both for confidence.
- Normalize Data Correctly: Express tissue concentrations as % Injected Dose per Gram of tissue (%ID/g), not total %ID per organ. Always include blood, plasma, major organs (liver, spleen, kidney, heart, lung), and tumor.
- Perfuse Animals: Perfuse animals with saline via the left ventricle post-euthanasia to remove blood from organs, especially for fluorescent dyes, to avoid background from circulating nanoparticles.
Experimental Protocols
Protocol 1: Standard Protocol for Longitudinal PK and Biodistribution Study of Intravenously Administered Nanoparticles
Objective: To determine plasma pharmacokinetics and tissue distribution over time.
Materials:
- Radiolabeled (e.g., ⁹⁹ᵐTc, ¹¹¹In) or fluorescently tagged nanoparticles.
- Animal model (e.g., BALB/c mice with/without tumor xenograft).
- IV injection setup.
- Microcentrifuge tubes, scale, gamma counter/IVIS imaging system.
- Heparinized capillary tubes for blood collection.
Methodology:
- Dosing: Inject nanoparticles via tail vein at a consistent volume (e.g., 200 µL per 20g mouse). Record exact injected dose (ID) in counts per minute (CPM) or fluorescence units.
- Blood Sampling (Serial): At predetermined time points (e.g., 5 min, 30 min, 2h, 8h, 24h, 48h), collect ~20 µL of blood from the retro-orbital sinus or tail nick into heparinized tubes from each animal (n=5 per time point). Immediately centrifuge (5,000g, 5 min) to isolate plasma.
- Terminal Time Points: At each major time point (e.g., 2h, 8h, 24h), euthanize the designated animals (n=5). Perform systemic perfusion with 10-20 mL saline via the left ventricle.
- Tissue Harvest: Excise organs of interest (liver, spleen, kidneys, heart, lungs, brain, tumor). Weigh each tissue precisely.
- Quantification:
- For Radiolabels: Count radioactivity in each tissue and plasma sample using a gamma counter. Calculate %ID/g = (CPM in tissue / tissue weight in g) / (Total Injected CPM) * 100.
- For Fluorescent Labels: Homogenize tissues, extract dye using a solvent (e.g., DMSO), and measure fluorescence against a standard curve. Calculate %ID/g.
- PK Analysis: Plot plasma concentration (%ID/mL) vs. time. Use non-compartmental analysis (e.g., with PKSolver) to calculate AUC, clearance (CL), volume of distribution (Vd), and half-life (t₁/₂).
Protocol 2: Ex Vivo Validation of Targeting Ligand Specificity via Competitive Blocking
Objective: To confirm that tumor accumulation is mediated by specific ligand-receptor interaction.
Methodology:
- Divide tumor-bearing mice into two groups (n=4-5): Test Group and Blocking Group.
- Blocking Group Pre-dose: Administer a large excess (e.g., 100-fold molar excess) of free, unconjugated targeting ligand (e.g., antibody, peptide) intravenously 10 minutes before nanoparticle injection.
- Nanoparticle Dose: Administer the ligand-targeted nanoparticles to both groups at the same dose.
- Terminal Point: Euthanize animals at the expected peak accumulation time (e.g., 24h post-nanoparticle). Harvest and process tissues as in Protocol 1.
- Analysis: Compare %ID/g in the tumor and key organs between groups. Specific targeting is indicated by a statistically significant reduction (>50%) in tumor accumulation in the Blocking Group, without significant changes in non-target organs like the liver.
Data Presentation
Table 1: Comparative PK Parameters of Nanoparticles with Varying Hydrophobicity
| Formulation (PLGA:PEG Ratio) | Zeta Potential (mV) | Circulation t₁/₂β (h) | Plasma AUC(0-24h) (%ID/mL*h) | Liver Accumulation at 24h (%ID/g) |
|---|---|---|---|---|
| Plain PLGA (100:0) | -25.5 ± 2.1 | 0.8 ± 0.2 | 15.3 ± 3.1 | 45.2 ± 6.7 |
| PLGA-PEG 95:5 | -18.7 ± 1.8 | 4.5 ± 1.1 | 82.7 ± 10.4 | 22.1 ± 3.5 |
| PLGA-PEG 90:10 | -15.2 ± 1.5 | 8.2 ± 1.5 | 125.6 ± 15.8 | 18.5 ± 2.9 |
| PLGA-PEG 80:20 | -12.4 ± 1.3 | 9.1 ± 1.8 | 131.4 ± 14.2 | 19.8 ± 3.1 |
Table 2: Biodistribution of Targeted vs. Non-Targeted Stealth Nanoparticles at 24h Post-IV Injection
| Tissue | Non-Targeted (%ID/g, Mean ± SD) | Ligand-Targeted (%ID/g, Mean ± SD) | p-value |
|---|---|---|---|
| Blood | 3.2 ± 0.5 | 2.8 ± 0.4 | NS |
| Liver | 18.5 ± 2.9 | 20.1 ± 3.3 | NS |
| Spleen | 8.4 ± 1.6 | 9.2 ± 1.8 | NS |
| Kidneys | 5.1 ± 0.9 | 5.3 ± 1.0 | NS |
| Tumor | 2.1 ± 0.4 | 6.7 ± 1.2 | <0.001 |
Visualizations
Title: Balancing Hydrophobicity for Nanoparticle PK and Targeting
Title: In Vivo PK and Biodistribution Experimental Workflow
The Scientist's Toolkit: Research Reagent Solutions
| Item | Function & Rationale |
|---|---|
| DSPE-PEG (2000-5000 Da) | The gold-standard amphiphilic polymer for creating stealth coatings. DSPE anchors into lipid membranes/cores, while PEG extends to provide a hydrophilic, steric barrier against opsonization. |
| PLGA-PEG (PLGA-b-PEG) Copolymers | Core biodegradable polymer (PLGA) directly copolymerized with PEG. Allows precise control over nanoparticle core composition and PEG density in a single molecule for reproducible formulation. |
| Chelator-Lipids (e.g., DOTA-DSPE, DTPA-DSPE) | Enables stable incorporation of radioisotopes (¹¹¹In, ⁶⁴Cu, ⁹⁹ᵐTc) into the nanoparticle lipid layer for quantitative gamma counting and SPECT/PET imaging. |
| Near-Infrared (NIR) Dyes (e.g., DiR, Cy7.5 NHS ester) | Hydrophobic or reactive dyes for fluorescence-based tracking. NIR light (650-900nm) minimizes tissue autofluorescence and absorption for deeper in vivo imaging (IVIS) and ex vivo quantification. |
| Heterobifunctional PEG Linkers (e.g., MAL-PEG-NHS, DBCO-PEG-NHS) | For controlled conjugation of targeting ligands (peptides, antibodies). Enforces directional coupling, preserving ligand activity and allowing optimization of ligand density on the nanoparticle surface. |
| Size Exclusion Chromatography (SEC) Columns (e.g., Sepharose CL-4B) | Critical for purifying nanoparticles from unencapsulated dye, free radioisotope, or unconjugated ligands post-formulation, ensuring accurate dosing and interpretation of in vivo data. |
Technical Support Center: Troubleshooting & FAQs
FAQ Topic: Poor Circulation Time & Rapid Clearance
- Q: My PEGylated nanoparticles are still being cleared rapidly by the mononuclear phagocyte system (MPS). What could be wrong?
- A: This is often due to incomplete or unstable PEG surface coverage. Ensure your PEG grafting density is sufficient (>10% surface coverage is a common target). Use a PEG with an appropriate molecular weight (typically 2-5 kDa). Verify conjugation chemistry and purify thoroughly to remove unconjugated PEG. Consider using branched or multi-arm PEG for denser shielding.
- Q: My zwitterionic coating is causing nanoparticle aggregation. How can I fix this?
- A: Aggregation suggests an imbalance in the zwitterionic charge or poor surface anchoring. Ensure the net charge is neutral at physiological pH (7.4). Titrate the ratio of cationic to anionic groups. Use a covalent anchoring method (like silane for silica or thiol for gold) instead of electrostatic adsorption. Purify nanoparticles in a low-ionic-strength buffer before coating.
FAQ Topic: Inconsistent Tumor Accumulation
- Q: Despite good circulation, my biomimetic nanoparticles show highly variable tumor accumulation between mouse models.
- A: Variability often stems from the source and quality of the biomimetic membrane (e.g., cell membrane). Ensure consistent membrane isolation and fusion protocols. The tumor model matters; use models with well-characterized EPR effect and receptor expression. Analyze membrane protein retention post-fusion via Western blot to confirm key targeting ligands are present.
- Q: My particles accumulate in the liver instead of the tumor.
- A: This indicates passive targeting is overwhelmed by off-target uptake. For PEG/Zwitterions, check for "accelerated blood clearance" (ABC) effect due to anti-PEG antibodies by running a pre-dose experiment. For biomimetics, the membrane source (e.g., platelets) may inherently target liver. Consider using a hybrid coating (e.g., PEG-lipid inserted into a leukocyte membrane) to balance stealth and active targeting.
FAQ Topic: Characterization & Analysis Challenges
- Q: How do I accurately measure the hydrodynamic diameter and surface charge after applying different coatings?
- A: Always use Dynamic Light Scattering (DLS) and Zeta Potential measurements in relevant biological buffers (e.g., 1x PBS, pH 7.4). For biomimetics, use nanoparticle tracking analysis (NTA) for polydisperse samples. Perform size/exclusion chromatography to remove aggregates before measurement. Note: Serum proteins can alter measured size/zeta potential; consider performing a "protein corona" study.
- Q: What's the best method to quantify coating density on my nanoparticles?
- A: Methods vary by coating. For PEG, use colorimetric assays (e.g., iodine/barium chloride for PEG). For zwitterions, X-ray Photoelectron Spectroscopy (XPS) can quantify elemental surface composition. For biomimetics, flow cytometry of fluorescently labeled particles or a protein assay (BCA) for membrane protein content can be used relative to uncoated cores.
Table 1: Key Performance Metrics of Nanoparticle Coatings
| Coating Type | Typical Circulation Half-life (in Mice) | Typical Tumor Accumulation (% Injected Dose/g) | Key Strength | Primary Limitation |
|---|---|---|---|---|
| PEG | 2 - 24 hours | 0.5 - 3.5 %ID/g | Proven stealth, reduces protein opsonization. | ABC effect, limited targeting. |
| Zwitterions | 10 - 30+ hours | 0.8 - 4.0 %ID/g | Superior hydration, resists protein adsorption. | Complex synthesis/characterization. |
| Biomimetics | 5 - 40+ hours | 2.0 - 8.0 %ID/g | Intrinsic targeting, immune evasion. | Complex fabrication, batch variability. |
Table 2: Common Experimental Pitfalls and Solutions
| Problem | Likely Cause | Recommended Solution |
|---|---|---|
| Increased size after coating | Coating aggregation or multilayer formation. | Optimize coating incubation time/temp. Use sonication/vortexing. Implement stringent purification (ultracentrifugation, filtration). |
| Low drug loading efficiency | Coating interferes with core matrix or drug affinity. | Load drug before coating. Use post-coating remote loading for liposomes. Adjust core-to-coating ratio. |
| Loss of targeting in biomimetics | Denaturation of membrane proteins during fusion. | Use gentle fusion methods (sonication, extrusion). Maintain low temperature and use protease inhibitors. |
Detailed Experimental Protocols
Protocol 1: Assessing Circulation Half-life via Blood Pharmacokinetics
- Prepare: Fluorescently or radio-labeled nanoparticles (e.g., DiR dye, 111In). Healthy or tumor-bearing mice.
- Inject: Administer dose via tail vein (e.g., 100 µL of 1 mg/mL nanoparticle solution).
- Sample: Collect blood (~20 µL) from retro-orbital plexus or tail nick at time points (e.g., 2 min, 30 min, 2h, 8h, 24h).
- Process: Lyse blood samples in PBS with 1% Triton X-100. Centrifuge to remove debris.
- Quantify: Measure fluorescence/radioactivity in supernatant vs. a standard curve. Fit data to a two-compartment pharmacokinetic model using software (e.g., PK Solver) to calculate half-life.
Protocol 2: Evaluating Tumor Accumulation via Ex Vivo Biodistribution
- Prepare & Inject: As in Protocol 1. Use tumor-bearing mice (e.g., 4T1 breast cancer, ~500 mm³ tumor volume).
- Sacrifice: At terminal time point (e.g., 24h or 48h post-injection), perfuse mice with saline via heart to clear blood from organs.
- Harvest: Excise tumor and major organs (heart, liver, spleen, lungs, kidneys).
- Weigh & Homogenize: Precisely weigh each tissue. Homogenize in lysis buffer.
- Quantify: Measure signal in homogenates. Calculate % Injected Dose per Gram of tissue (%ID/g) = (Signal in tissue / Signal of total injected dose) / Tissue weight (g) * 100%.
Research Reagent Solutions Toolkit
| Item | Function | Example Vendor/Cat. No. (Illustrative) |
|---|---|---|
| DSPE-mPEG (2000) | PEGylation reagent for lipid-based nanoparticles. | Avanti Polar Lipids, 880120 |
| Carboxybetaine acrylamide (CBAA) | Monomer for grafting zwitterionic polymer brushes. | Sigma-Aldrich, 856468 |
| Membrane Protein Extraction Kit | Isolates membrane fractions for biomimetic coating. | Thermo Fisher, 89842 |
| Mini-Extruder with Polycarbonate Membranes | Produces uniform liposomes/nanoparticles & facilitates membrane fusion. | Avanti Polar Lipids, 610000 |
| Dynamic Light Scattering (DLS) Zeta Potential Analyzer | Measures nanoparticle size, PDI, and surface charge. | Malvern Panalytical, Zetasizer Nano |
| Near-Infrared (NIR) Fluorescent Dye (DiR) | Hydrophobic tracer for in vivo and ex vivo imaging. | Thermo Fisher, D12731 |
Visualizations
(Diagram 1: Pathway to Nanoparticle Clearance)
(Diagram 2: Coating Strategy Workflow)
(Diagram 3: Balancing Stealth & Targeting)
Technical Support Center
Troubleshooting Guides & FAQs
Category 1: Simulation Setup & Parameterization
Q1: My nanoparticle (NP) system fails to solvate or generates voids during the initial setup. What are the common causes?
- A: This is often due to incorrect topology or coordinate files for the custom NP. Ensure your NP's initial structure is physically plausible (no atom overlaps). Use tools like
packmolorCHARMM-GUIto carefully pack molecules. Increase the box padding (e.g., from 1.0 nm to 1.5 nm) and use a slower insertion method.
- A: This is often due to incorrect topology or coordinate files for the custom NP. Ensure your NP's initial structure is physically plausible (no atom overlaps). Use tools like
Q2: How do I accurately assign atomic partial charges and force field parameters for a novel, hybrid organic-inorganic nanoparticle?
- A: For non-standard residues/molecules, a multi-step protocol is recommended:
- Geometry Optimization & ESP Calculation: Use quantum chemistry software (e.g., Gaussian, ORCA) to optimize the molecule's geometry and compute its electrostatic potential (ESP).
- Charge Fitting: Use tools like
antechamber(with the RESP method) to fit atomic partial charges to the quantum-mechanical ESP. - Parameter Assignment: Use
General Amber Force Field (GAFF)orCHARMM General Force Field (CGenFF)for organic ligands. For metal/metal-oxide cores, use specialized parameters (e.g., INTERFACE, CLAYFF). Validate with small molecule analogs.
- A: For non-standard residues/molecules, a multi-step protocol is recommended:
Category 2: Simulation Execution & Stability
Q3: My simulation crashes with a "LINCS Warning" or "Bond Constraint Failure." How can I resolve this?
- A: This indicates excessive forces, often from bad contacts or incorrect constraints.
- Reduce the initial timestep (e.g., to 0.5 fs) and use
gen-vel = no. - Perform more robust energy minimization: first steepest descent (5000 steps), then conjugate gradient (until Fmax < 1000 kJ/mol/nm).
- Use a slower equilibration protocol with position restraints on the NP heavy atoms, gradually reducing the restraint force constant over 1-2 ns.
- Check for specific problematic atoms and ensure their bond parameters are correct.
- Reduce the initial timestep (e.g., to 0.5 fs) and use
- A: This indicates excessive forces, often from bad contacts or incorrect constraints.
Q4: How long should my production MD run be to reliably compute hydrophobicity metrics (e.g., contact angle, SASA) and protein binding free energy?
- A: Convergence is system-dependent. As a guideline:
- For SASA and solvent-accessible contact angle analysis, a stable 50-100 ns trajectory after equilibration is often sufficient.
- For protein-NP binding studies using methods like MMPBSA, multiple, independent replicas of 100-200 ns each are recommended to ensure sampling of bound/unbound states and compute statistically meaningful averages. Always perform block averaging to check for convergence of your key observables.
- A: Convergence is system-dependent. As a guideline:
Category 3: Analysis & Interpretation
Q5: My calculated protein-NP binding free energy (ΔG) shows high variance between replicas. What could be wrong?
- A: High variance suggests inadequate sampling or an unstable bound complex.
- Sampling: Ensure the protein explores multiple orientations on the NP surface. Extend simulation time or use enhanced sampling (e.g., umbrella sampling along a distance coordinate).
- Stability: Verify the protein's secondary/tertiary structure remains intact during binding (calculate RMSD, radius of gyration). Unfolding upon contact can lead to erratic energies.
- Protocol: When using MMPBSA/MMGBSA, ensure you are using a consistent number of frames from the stable binding region, excluding the initial approach phase.
- A: High variance suggests inadequate sampling or an unstable bound complex.
Q6: How can I quantify "hydrophobicity" from an MD trajectory in a way relevant to in vivo circulation?
- A: Beyond SASA, use these complementary metrics:
- Water Density Profile: Plot the density of water oxygen atoms as a function of distance from the NP surface. A thick, depressed layer indicates hydrophobicity.
- Local Contact Angle: Use the
gmx ordertool or a tool likeWillard-Chandlerinterface analysis to identify the water interface near the NP and measure local angles. - Hydrogen Bond Analysis: Count the number of hydrogen bonds between NP surface groups and water. A lower count correlates with higher hydrophobicity.
- Table 1: Key Hydrophobicity Metrics from MD
Metric Calculation Method Relevance to Circulation Solvent-Accessible Surface Area (SASA) gmx sasaon NP in water vs. vacuum.High SASA gain in water indicates hydrophilicity; correlates with reduced non-specific protein adsorption. Average Water Contact Angle Derived from instantaneous water interface near NP surface. Direct analog to experimental measure; >90° predicts hydrophobic aggregation and rapid opsonization. Protein Adsorption Free Energy (ΔGbind) MMPBSA/MMGBSA on serum albumin-NP trajectory. Negative ΔG predicts opsonization and shortened circulation half-life.
- A: Beyond SASA, use these complementary metrics:
Experimental Protocols
Protocol 1: Standard MD Workflow for NP Hydrophobicity Assessment
- System Building: Place energy-minimized NP in a cubic box (≥1.2 nm padding). Solvate with TIP3P water. Add ions to neutralize charge and reach physiological salt concentration (e.g., 150 mM NaCl).
- Energy Minimization: Minimize using steepest descent (max 5000 steps) until maximum force <1000 kJ/mol/nm.
- Equilibration (NVT & NPT): Heat system to 310 K over 100 ps using velocity rescale thermostat. Then, equilibrate pressure at 1 bar for 1 ns using Berendsen barostat, followed by Parrinello-Rahman barostat for another 1 ns. Apply position restraints on NP heavy atoms.
- Production MD: Run unrestrained simulation for 100-500 ns in NPT ensemble. Save coordinates every 10-100 ps.
- Analysis: Calculate SASA, water density profiles, and hydrogen bonds using GROMACS (
gmx sasa,gmx density,gmx hbond) or analogous tools.
Protocol 2: End-Point Free Energy Calculation for Protein-NP Binding
- Trajectory Preparation: Run a long (≥200 ns) simulation of the NP with a serum protein (e.g., Human Serum Albumin). Visually confirm stable binding.
- Frame Extraction: From the stable binding period, extract 100-500 equally spaced snapshots for energy calculation.
- MMPBSA/MMGBSA Calculation: Use
g_mmpbsaorAMBER's MMPBSA.py. For each snapshot, calculate the vacuum potential energy, polar solvation energy (Poisson-Boltzmann or Generalized Born), and non-polar solvation energy (from SASA). - Averaging & Statistics: Average energies across snapshots to get ΔGbind. Perform the calculation on 3-5 independent simulation replicas. Report mean ± standard deviation.
Visualizations
Title: MD Simulation Workflow for NP Analysis
Title: MD's Role in NP Hydrophobicity-Targeting Trade-off
The Scientist's Toolkit: Research Reagent Solutions
| Item | Function in MD Simulation of NPs |
|---|---|
| GROMACS/AMBER/NAMD | Core MD software engines for performing high-performance simulations. |
| CHARMM-GUI Nanomaterial Modeler | Web-based platform for building complex NP systems (e.g., Au, graphene, liposomes) with solvents and ions. |
| Packmol | Tool for initial configuration building by packing molecules in a defined simulation box. |
| ACPYPE/AnteChamber | Tools for generating force field topology files and partial charges for organic ligand molecules. |
| Visual Molecular Dynamics (VMD) | For visualization, trajectory analysis, and rendering publication-quality figures. |
| PyMOL | Complementary tool for structural visualization and analysis of protein-NP complexes. |
| g_mmpbsa/MBAR.py | Specialized tools for calculating protein-ligand/NP binding free energies from MD trajectories. |
| PLUMED | Library for implementing enhanced sampling methods (e.g., metadynamics) to study rare events like protein adsorption/desorption. |
Troubleshooting Guides & FAQs
Q1: Our PEGylated nanoparticles are clearing from circulation faster than literature values suggest. What are the primary causes? A: Rapid clearance of PEGylated nanoparticles often stems from:
- Incomplete PEG Coverage: Insufficient PEG density allows serum proteins to adsorb, marking particles for opsonization. Use quantitative NMR or colorimetric assays to verify grafting density.
- PEG Chain Length Mismatch: For a 100 nm particle, PEG < 2 kDa may be insufficient for steric stabilization, while > 5 kDa can increase macrophage uptake. Target 3-5 kDa for optimal balance.
- "Anti-PEG" Immunity: Pre-existing or induced anti-PEG antibodies can accelerate blood clearance (ABC phenomenon). Consider low-immunogenicity PEG alternatives (e.g., polysarcosine) if this is suspected.
Q2: We observe poor in vitro targeting despite good ligand conjugation efficiency. How should we troubleshoot? A: This common issue typically involves a failure at one of these steps:
- Ligand Orientation/Activity: Ensure conjugation chemistry preserves ligand's active site. Use activity assays (e.g., SPR, cell binding) post-conjugation, not just quantification.
- Protein Corona Interference: The formed protein corona may bury targeting ligands. Pre-coat particles with relevant plasma and re-test binding.
- Incorrect Cell Model: Verify target receptor expression in your specific cell line via flow cytometry. Use a positive control (e.g., free fluorescent ligand).
Q3: How do we accurately measure the "Drug Delivery Index" (DDI) in vivo?
A: The DDI, often defined as (Drug in Target Tissue / Drug in Off-Target Tissue) / (Circulation Half-life), requires precise data:
- Quantitative Biodistribution: Use radiolabeled (¹²⁵I, ¹¹¹In) or fluorescently labeled drug cargo with standards for tissue homogenate quantification. Correct for blood pool contamination in tissues.
- Pharmacokinetic Modeling: Fit plasma concentration-time data to a two-compartment model to derive the terminal half-life (t₁/₂β) accurately.
- Key Calculation Table:
| Metric | Measurement Method | Target Value (Example: Targeted NPs) | Off-Target Value (Example: Non-targeted NPs) |
|---|---|---|---|
| Circulation t₁/₂ (h) | PK modeling of plasma data | 12.4 ± 1.8 | 8.1 ± 0.9 |
| % Injected Dose/g in Target Tissue | Gamma counting of tissue | 8.7% ID/g ± 0.5 | 3.2% ID/g ± 0.4 |
| % Injected Dose/g in Key Off-Target Tissue (e.g., Liver) | Gamma counting of tissue | 5.1% ID/g ± 0.6 | 4.9% ID/g ± 0.7 |
| Calculated DDI (a.u.) | (Target/Off-Target) / t₁/₂ | 0.21 | 0.08 |
Q4: Our nanoparticles aggregate in serum. What immediate steps should we take? A: Serum-induced aggregation indicates poor colloidal stability.
- Immediate Check: Measure hydrodynamic diameter (DLS) in PBS vs. 50% FBS immediately and after 1-hour incubation. A >20% increase confirms aggregation.
- Primary Fix: Increase surface hydrophilicity. Options include:
- Increasing PEG grafting density by 20-50%.
- Switching to a longer PEG chain (e.g., from 2k to 3.4 kDa).
- Incorporating a minor fraction of a more hydrophilic polymer (e.g., polyvinyl alcohol).
- Protocol: Assessing Serum Stability:
- Dilute nanoparticle stock (1 mg/mL) 1:1 in pure PBS (control) and 100% FBS.
- Incubate at 37°C with gentle shaking.
- Measure DLS size and PDI at t=0, 0.5, 1, 2, 4, and 24 hours.
- A stable formulation should maintain PDI <0.2 and minimal size change over 4 hours.
Experimental Protocols
Protocol 1: Determining PEG Grafting Density via 1H-NMR Objective: Quantify the number of PEG chains per unit area on nanoparticle surfaces.
- Synthesis: Synthesize PEG-NPs via standard conjugation chemistry. Purify 3x via ultracentrifugation (100,000 g, 45 min) and resuspend in D₂O.
- Measurement: Acquire ¹H NMR spectrum (500 MHz). Identify the characteristic PEG peak (e.g., -OCH₂CH₂- at ~3.6 ppm) and a core polymer-specific peak.
- Calculation:
- Use the integral ratio:
(Integral_PEG / n_PEG) / (Integral_Core / n_Core) = Number_of_PEG_chains / Number_of_Core_molecules. - Knowing the number of core molecules per NP (from synthesis) and NP surface area (from TEM), calculate grafting density (chains/nm²).
- Use the integral ratio:
Protocol 2: In Vivo Circulation Half-life and Biodistribution Objective: Determine key pharmacokinetic and targeting parameters.
- Labeling: Label nanoparticles with DiR dye or ¹¹¹In via chelation. Purify to remove free label.
- Administration: Inject IV via tail vein into mice (n=5/group) at 5 mg/kg.
- Blood Pharmacokinetics: Collect blood retro-orbitally at 2 min, 15 min, 30 min, 1h, 2h, 4h, 8h, 12h, 24h. Measure fluorescence/radioactivity. Fit data to a two-compartment model.
- Biodistribution: At terminal timepoints (e.g., 24h and 48h), perfuse animals with saline. Harvest organs, weigh, and digest or count directly. Express data as % Injected Dose per gram of tissue (%ID/g).
Visualization Diagrams
Diagram 1: Balancing Hydrophobicity for Efficacy (80 chars)
Diagram 2: Protein Corona & Targeting Interplay (78 chars)
Diagram 3: Key Experiment Workflow: From Synthesis to DDI (95 chars)
The Scientist's Toolkit: Research Reagent Solutions
| Item | Function & Rationale |
|---|---|
| mPEG-NHS (3.5 kDa) | Gold-standard for amine conjugation. Provides steric stabilization. Chain length balances circulation and reduced immunogenicity. |
| DSPE-PEG(2000)-Maleimide | Anchor for thiol-conjugated targeting ligands (e.g., cRGD, antibodies). Integrates into lipid-based NP cores or micelles. |
| 1-Ethyl-3-(3-dimethylaminopropyl)carbodiimide (EDC) | Zero-length crosslinker for conjugating carboxylated NPs to amine-containing ligands or PEG. Critical for controlled surface chemistry. |
| DiR Iodide (Lipophilic Tracer) | Near-infrared fluorescent dye for in vivo imaging and biodistribution. Minimizes tissue autofluorescence. |
| Sodium [¹²⁵I]Iodide | Radioisotope for highly sensitive, quantitative tracking of NPs or drug cargo in pharmacokinetic and biodistribution studies. |
| Size Exclusion Chromatography (SEC) Columns (e.g., Sephadex G-25) | Essential for purifying conjugated NPs from unreacted dyes, ligands, or PEG. Removes small molecule contaminants that skew data. |
| Dynamic Light Scattering (DLS) with Zeta Potential Module | Must-have for characterizing hydrodynamic diameter, polydispersity (PDI), and surface charge (Zeta Potential) in relevant buffers. |
| Differential Scanning Calorimetry (DSC) | Used to study the thermal behavior of nanoparticle cores, correlating polymer crystallinity/hydrophobicity with drug loading efficiency. |
Conclusion
Achieving the optimal hydrophobic-hydrophilic balance is not a one-size-fits-all formula but a deliberate, multi-parameter design challenge central to nanoparticle therapeutics. As synthesized from the four intents, success requires a foundational understanding of bio-nano interactions, application of precise surface engineering methodologies, systematic troubleshooting of circulation and uptake trade-offs, and rigorous comparative validation. The future lies in moving beyond passive stealth towards active, intelligent surfaces—such as dynamic or context-sheddable coatings—that can temporally modulate their hydrophobicity in response to biological cues. This evolution will enable next-generation nanomedicines that truly navigate the vascular system like stealth vessels before transforming into potent targeting agents at the disease site, ultimately closing the gap between promising laboratory constructs and effective clinical therapies.